Capture memory dumps on the Azure App Service platform
This article provides guidance about Microsoft Azure App Service debugging features for capturing memory dumps. The capture method that you use is dictated by the scenario in which you capture a memory dump for troubleshooting a performance or availability issue. For example, capturing a memory dump is different for a process that's experiencing excessive memory consumption than for a process that's throwing exceptions or responding slowly. The process in this context is the Internet Information Services (IIS) worker process (W3WP, which runs as w3wp.exe).
Mapping memory dump scenarios to Azure App Service debugging features
The following table provides recommendations about the commands that each App Service feature runs to generate a memory dump. There are so many approaches to capturing a memory dump that the process might be confusing. If you're already proficient in capturing a W3WP memory dump, this information isn't intended to change your approach. Instead, we hope to provide guidance for inexperienced users who haven't yet developed a preference.
| Scenario | Azure App Service debugging feature | Command |
|---|---|---|
| Unresponsive or slow | Auto-heal (request duration) | procdump -accepteula -r -dc "Message" -ma <PID> <PATH> |
| Crash (process termination) | Crash monitoring | Uses DbgHost to capture a memory dump |
| Crash (handled exceptions) | Traces in Application Insights/Log Analytics | None |
| Crash (unhandled exceptions) | Application Insights Snapshot Debugger | None |
| Excessive CPU usage | Proactive CPU monitoring | procdump -accepteula -dc "Message" -ma <PID> <PATH> |
| Excessive memory consumption | Auto-heal (memory limit) | procdump -accepteula -r -dc "Message" -ma <PID> <PATH> |
Note
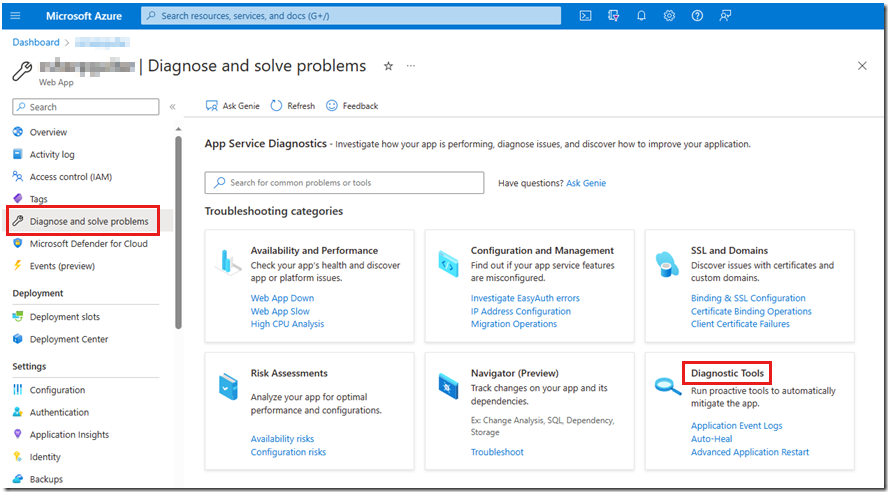
We have a secondary recommendation for capturing a W3WP process memory dump in the unresponsive or slow scenario. If that scenario is reproducible, and you want to capture the dump immediately, you can use the Collect a Memory dump diagnostic tool. This tool is located in the Diagnose and solve problems toolset page for the given App Service Web App in the Azure portal. Another location to check for general exceptions and poor performance is on the Application Event Logs page. (You can access Application logs also from the Diagnose and solve problems page.) We discuss all the available methods in the "Expanded Azure App Service debugging feature descriptions" section.
Expanded process scenario descriptions
This section contains detailed descriptions of the six scenarios that are shown in the previous table.
Unresponsive or slow scenario
When a request is made to a web server, some code must usually be run. The code execution occurs within the w3wp.exe process on threads. Each thread has a stack that shows what's currently running.
An unresponsive scenario can be either permanent (and likely to time out) or slow. Therefore, the unresponsive scenario is one in which a request takes longer than expected to run. What you might consider being slow depends on what the code is doing. For some people, a three-second delay is slow. For others, a 15-second delay is acceptable. Basically, if you see performance metrics that indicate slowness, or a super user states that the server is responding slower than normal, then you have an unresponsive or slow scenario.
Crash (process termination) scenario
Over many years, Microsoft .NET Framework has improved the handling of exceptions. In the current version of .NET, the exception handling experience is even better.
Historically, if a developer didn't place code snippets within a try-catch block, and an exception was thrown, the process terminated. In that case, an unhandled exception in the developer's code terminated the process. More modern versions of .NET handle some of these “unhandled” exceptions so that the process that's running the code doesn't crash. However, not all unhandled exceptions are thrown directly from the custom code. For example, access violations (such as 0xC0000005 and 0x80070005) or a stack overflow can terminate the process.
Crash (handled exceptions) scenario
Although a software developer takes special care to determine all possible scenarios under which the code runs, something unexpected can occur. The following errors can trigger an exception:
- Unexpected null values
- Invalid casting
- A missing instantiated object
It's a best practice to put code execution into try-catch code blocks. If a developer uses these blocks, the code has an opportunity to fail gracefully by specifically managing what follows the unexpected event. A handled exception is an exception that is thrown inside a try block and is caught in the corresponding catch block. In this case, the developer anticipated that an exception could occur and coded an appropriate try-catch block around that section of code.
In the catch block, it's useful to capture enough information into a logging source so that the issue can be reproduced and, ultimately, resolved. Exceptions are expensive code paths in terms of performance. Therefore, having many exceptions affects performance.
Crash (unhandled exceptions) scenario
Unhandled exceptions occur when code tries to take an action that it doesn't expect to encounter. As in the Crash (process termination) scenario, that code isn't contained within a try-catch code block. In this case, the developer didn't anticipate that an exception could occur in that section of code.
This scenario differs from the previous two exception scenarios. In the Crash (unhandled exceptions) scenario, the code in question is the code that the developer wrote. It isn't the framework code that's throwing the exception, and it isn't one of the unhandled exceptions that kills the w3wp.exe process. Also, because the code that's throwing an exception isn't within a try-catch block, there's no opportunity to handle the exception gracefully. Troubleshooting the code is initially a bit more complex. Your goal would be to find the exception text, type, and stack that identifies the method that's throwing this unhandled exception. That information enables you to identify where you have to add the try-catch code block. Then, the developer can add the similar logic to log exception details that should exist in the Crash (unhandled exceptions) scenario.
Excessive CPU usage scenario
What's excessive CPU usage? This situation is dependent on what the code does. In general, if the CPU usage from the w3wp.exe process is 80 percent, then your application is in a critical situation that can cause various symptoms. Some possible symptoms are:
- Slowness
- Errors
- Other undefined behavior
Even a 20-percent CPU usage can be considered excessive if the web site is just delivering static HTML files. Post-mortem troubleshooting of an excessive CPU spike by generating a memory dump probably won't help you to determine the specific method that's using it. The best that you can do is to determine which requests were likely taking the longest time, and then try to reproduce the issue by testing the identified method. That procedure assumes that you don't run performance monitors on the performance systems that captured that burst. In many cases, you can cause performance issues by having monitors constantly run in real time.
Excessive memory consumption scenario
If an application is running in a 32-bit process, excessive memory consumption can be a problem. Even a small amount of activity can consume the 2-3 GB of allocated virtual address space. A 32-bit process can never exceed a total of 4 GB, regardless of the amount of physical memory that's available.
A 64-bit process is allocated more memory than a 32-bit process. It's more likely that the 64-bit process will consume the amount of physical memory on the server than that the process will consume its allocated virtual address space.
Therefore, what constitutes an excessive memory consumption issue depends on the following factors:
- Process bitness (32-bit or 64-bit)
- The amount of memory usage that's considered to be "normal."
If your process is consuming more memory than expected, collect a memory dump for analysis to determine what is consuming memory resources. For more information, see Create a memory dump of your App Service when it consumes too much memory.
Now that you have a bit more context about the different process scenarios that a memory dump can help you to troubleshoot, we'll discuss the recommended tool for capturing memory dumps on the Azure App Service platform.
Expanded Azure App Service debugging feature descriptions
In the table in the "Mapping memory dump scenarios to Azure App Service debugging features" section, we identified six debugging features that are targeted at collecting memory dumps. Each of these features is accessible from within the Azure portal on the Diagnose and solve problems page when you select the Diagnostic Tools tile.
In the following sections, we discuss each of these debugging features in more detail.
Auto-heal (request duration) feature
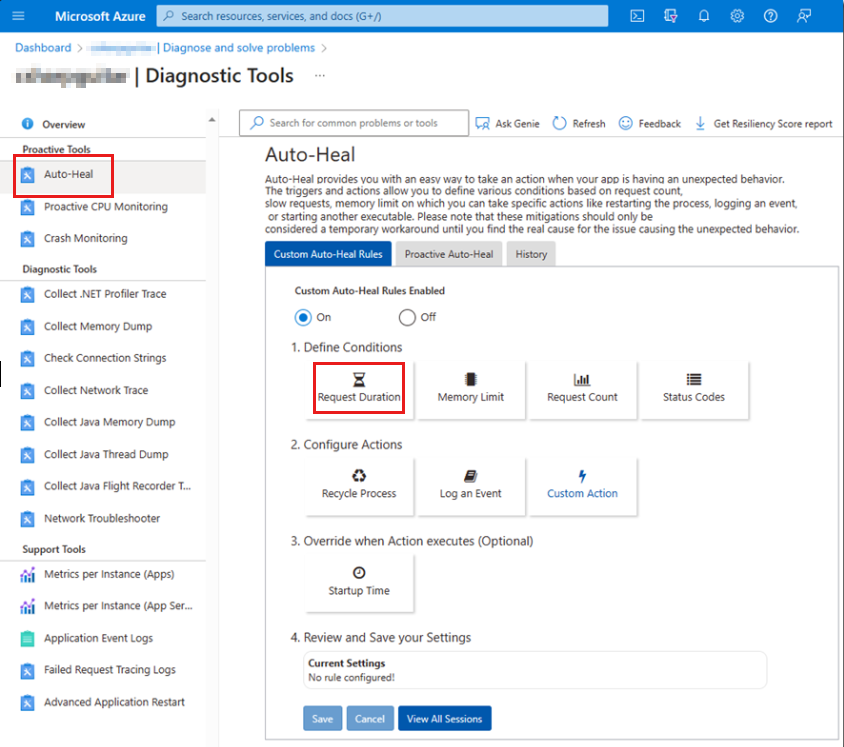
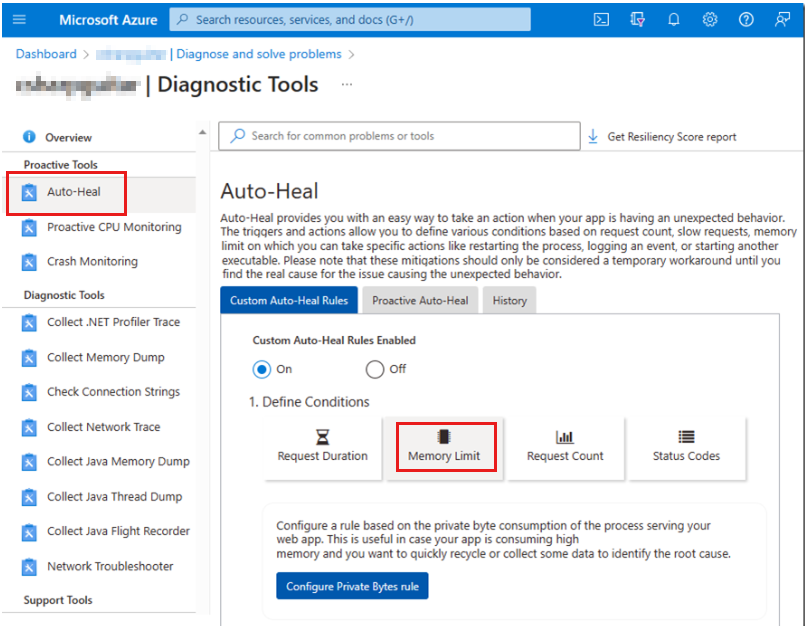
The auto-heal (request duration) feature is useful for capturing a memory dump if the response is taking longer than expected to finish. You can see the link to Auto-Heal in the Diagnostic Tools tile in the previous screenshot. Select that link to go directly to the feature, or select the Diagnostic Tools tile to review all the available tools on the Diagnostic Tools page. For information about how to configure this feature, see the following articles:
Announcing the New Auto Healing Experience in App Service Diagnostics
Collect and automate diagnostic actions with Azure App Services
The auto-heal feature is shown in the following screenshot.
Another feature that's named "Collect a Memory dump" is useful in this scenario when the issue is currently occurring or reproducible. This feature quickly collects a memory dump on manual demand.
Collect a memory dump feature
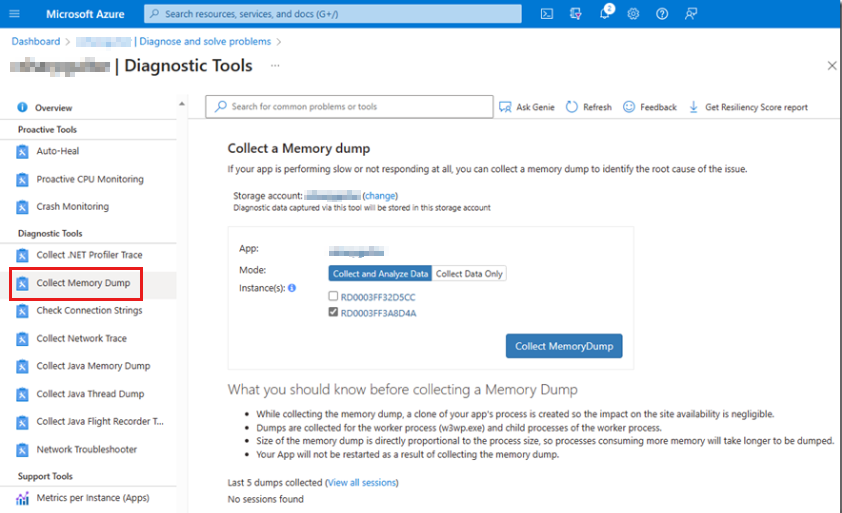
This approach requires manual intervention. The following screenshot shows the Collect a Memory dump page.
To use the feature, select a storage account in which to store the memory dump. Then, select which server instance you want to collect the memory dump from. If you have more than a single instance, make sure that the issue that you're debugging is occurring on that instance. Notice that a restart might not be optimal on a production application that's in operation.
Crash Monitoring feature
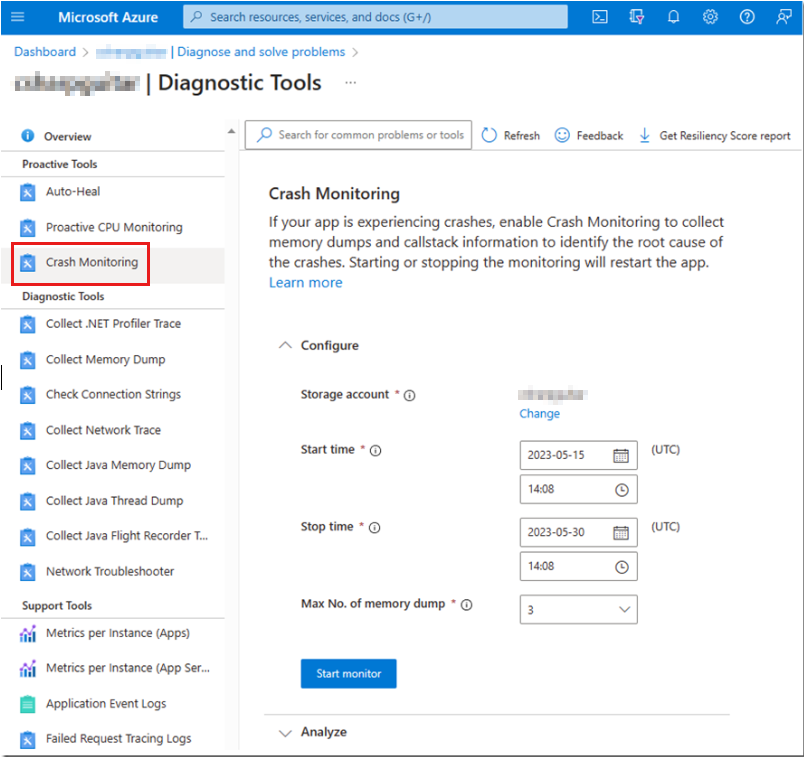
The Crash Monitoring feature is useful for capturing a memory dump if an unhandled exception causes the W3WP process to terminate. The following screenshot shows the Crash Monitoring page in Diagnostic Tools:
To view a guided walk-through about how to configure the crash monitoring feature in Azure App Service, see Crash monitoring in Azure App Service.
Traces in Application Insights/Log Analytics feature
A handled exception is a scenario in which the code that's contained within a try-catch block tries to take an action that's unexpected or unsupported. For example, the following code snippet tries to divide a number by zero even though this is an illegal operation:
decimal percentage = 0, number = 1000, total = 0;
try
{
  percentage = number / total;
}
catch (DivideByZeroException divEx)
{
  _logger.LogError("A handled exception just happened: -> {divEx.Message}", divEx.Message);
}
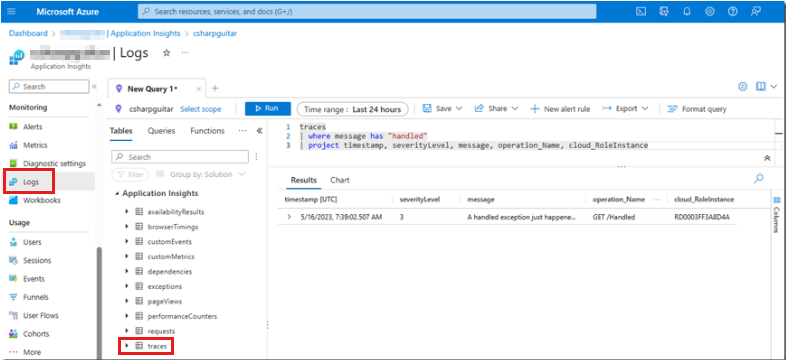
This code snippet causes a divide-by-zero exception that's handled because the unsupported mathematical operation is placed within a try-catch block. Application Insights doesn't log handled exceptions unless you intentionally include the Microsoft.ApplicationInsights NuGet package in your application code, and then add the code to log the information. If the exception occurs after you add the code, you can view the entry in Log Analytics, as shown in the following screenshot.
The following Kusto code contains the query that's used to extract the data from Log Analytics:
traces
| where message has "handled"
 | project timestamp, severityLevel, message, operation_Name, cloud_RoleInstance
The message column is the location in which you can store the details that are required to find the root cause of the exception. The code that's used to write this query is in the division-by-zero code snippet. The software developer who wrote this code is the best person to ask about these kinds of exceptions and the attributes that are necessary to capture for analyzing root causes.
The best approach to add this functionality to your application code depends on the application code stack and version that you have (for example, ASP.NET, ASP.NET Core, MVC, Razor, and so on). To determine the best approach for your scenario, review Application Insights logging with .NET.
Application event logs (handled exceptions) feature
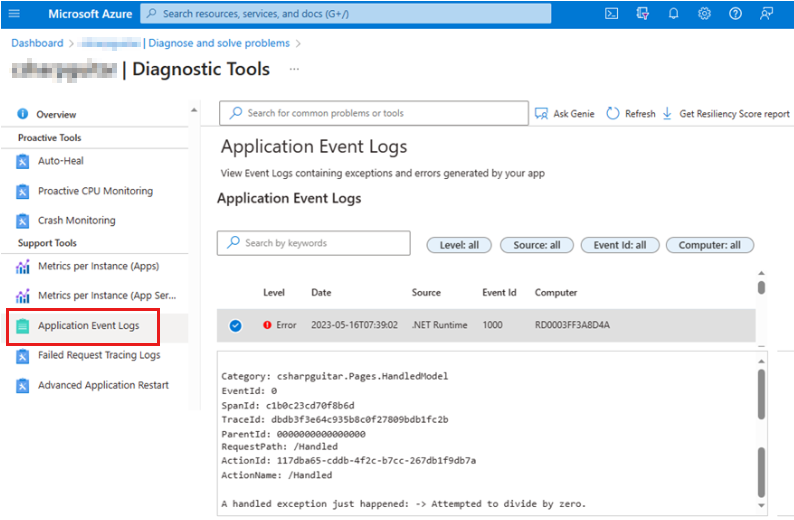
You also can find unhandled exceptions in the handled exception in the Application Event Logs page of Diagnostic Tools in the Azure portal, as shown in the following screenshot.
In this situation, you receive the same error message that you logged through your code. However, you lose some flexibility in how you can customize the queries on Application Insights trace logs.
Application Insights Snapshot Debugger feature
Unhandled exceptions are also logged on the Application Event Logs page, as shown in the output text in the next section. However, you can also enable the Application Insights Snapshot Debugger. This approach doesn't require that you add any code to your application.
Application event logs (unhandled exceptions) feature
The following output is from the Application Event Logs page of Diagnostic Tools in the Azure portal. It shows some example text of an unhandled application exception:
Category: Microsoft.AspNetCore.Diagnostics.ExceptionHandlerMiddleware
EventId: 1
SpanId: 311d8cb5d10b1a6e
TraceId: 041929768411c12f1c3f1ccbc91f6751
ParentId: 0000000000000000
RequestId: 8000006d-0001-bf00-b63f-84710c7967bb
RequestPath: /Unhandled

An unhandled exception has occurred while executing the request.

Exception:
System.DivideByZeroException: Attempted to divide by zero.
   at System.Decimal.DecCalc.VarDecDiv(DecCalc& d1, DecCalc& d2)
   at System.Decimal.op_Division(Decimal d1, Decimal d2)
   at contosotest.Pages.Pages Unhandled.ExecuteAsync()
     in C:\Users\contoso\source\repos\contosorepo\contosorepo\Pages\Unhandled.cshtml:line 12
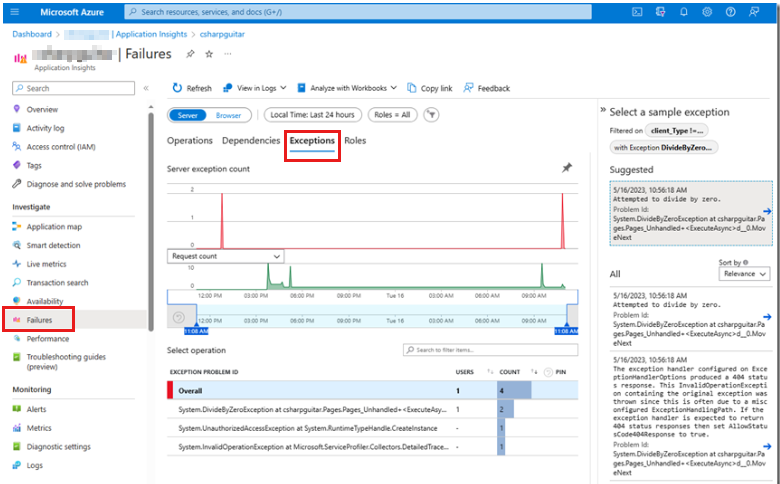
One difference here from the handled exception in the Application log is the existence of the stack that identifies the method and the line from which the exception is thrown. Also, you can safely assume that the Microsoft.AspNetCore.Diagnostics.ExceptionHandlerMiddleware functionality contains code to catch this unhandled exception so that termination of the process is avoided. The exception is shown in Application Insights on the Exceptions tab of the Failures page, as shown in the following screenshot.
In this view, you see all Exceptions, not only the one that you're searching for. The graphical representation of all exceptions that occur in your application is helpful to gain an overview of the health of your system. The Application Insights dashboard is more helpful visually in comparison to the Application event logs.
Proactive CPU monitoring feature
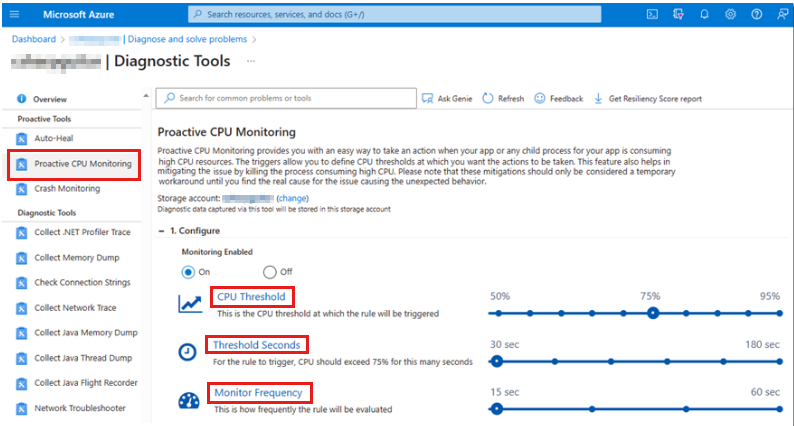
During excessive CPU usage scenarios, you can use the proactive CPU monitoring tool. For information about this tool, see Mitigate your CPU problems before they happen. The following image shows the Proactive CPU Monitoring page in Diagnostic Tools.
You should consider CPU usage of 80 percent or more as a critical situation that requires immediate investigation. In the Proactive CPU Monitoring page, you can set the scenario for which you want to capture a memory dump based on the following data monitoring categories:
- CPU Threshold
- Threshold Seconds
- Monitor Frequency
CPU Threshold identifies how much computer CPU the targeted process uses (W3WP in this case). Threshold Seconds is the amount of time that the CPU was used at the CPU Threshold. For example, if there's 75-percent CPU usage for a total of 30 seconds, the memory dump would be captured. As configured on the Proactive CPU Monitoring page, the process would be checked for threshold breaches every 15 seconds.
Auto-heal (memory limit) feature
The auto-heal (memory limit) feature is useful for capturing a memory dump if the process is consuming more memory than expected. Again, pay attention to the bitness (32 or 64). If you experience memory pressure in the 32-bit process context, and the memory consumption is expected, you might consider changing the bitness to 64. Typically, if you change the bitness, you have to also recompile the application.
Changing the bitness doesn't reduce the amount of memory that's used. It does allow the process to use more than 4 GB of total memory. However, if the memory consumption isn't as expected, you can use this feature to determine what's consuming the memory. Then, you can take an action to control the memory consumption.
In the "Expanded Azure App Service debugging feature descriptions" section, you can see the link to Auto-Heal in the Diagnostic Tools tile in the first screenshot. Select that link to go directly to the feature, or select the tile and review all the available tools in the Diagnostic Tools page. For more information, go to the "Auto-healing" section of Azure App Service diagnostics overview.
The auto-heal feature is shown in the following screenshot.
When you select the Memory Limit tile, you have the option to enter a memory value that triggers the capture of a memory dump when that memory limit is breached. For example, if you enter 6291456 as the value, a memory dump of the W3WP process is taken when 6 GB of memory is consumed.
The Collect a Memory dump feature is useful in this scenario if the issue is currently occurring or reproducible. This feature quickly collects a memory dump on manual demand. For more information, see the "Collect a memory dump" section.
Expanded command descriptions
The art of memory dump collection takes some time to study, experience, and perfect. As you have learned, different procedures are based on the symptoms that the process is showing, as listed in the table in the "Expanded process scenario descriptions" section. By contrast, the following table compares the Azure App Service's memory dump capture command to the procdump command that you run manually from the Kudu console.
| Scenario | Azure App Service command | General procdump command |
|---|---|---|
| Unresponsive or slow | procdump -accepteula -r -dc "Message" -ma <PID> <PATH> |
procdump -accepteula -ma -n 3 -s # <PID> |
| Crash (process termination) | Uses DbgHost to capture memory dump | procdump -accepteula -ma -t <PID> |
| Crash (handled exceptions) | None (Application Insights) | procdump -accepteula -ma -e 1 -f <filter> <PID> |
| Crash (unhandled exceptions) | None (Application Insights Snapshot Debugger) | procdump -accepteula -ma -e <PID> |
| Excessive CPU usage | procdump -accepteula -dc "Message" -ma <PID> <PATH> |
procdump -accepteula -ma -n 3 -s # -c 80 <PID> |
| Excessive memory consumption | procdump -accepteula -r -dc "Message" -ma <PID> <PATH> |
procdump -accepteula -ma -m 2000 <PID> |
The commands that you use in the memory dump capturing features in Azure App Service differ from the procdump commands that you would use if you captured dumps manually. If you review the previous section, you should notice that the memory dump collection portal feature in Azure App Service exposes the configuration. For example, in the excessive memory consumption scenario in the table, the command that the platform runs doesn't contain a memory threshold. However, the command that's shown in the general procdump command column does specify a memory threshold.
A tool that's named DaaS (Diagnostics as a service) is responsible for managing and monitoring the configuration that's specified in the Azure App Service debugging portal. This tool runs as a web job on the virtual machines (VMs) that run your web app. A benefit of this tool is that you can target a specific VM in your web farm. If you try to capture a memory dump by using procdump directly, it can be challenging to identify, target, access, and run that command on a specific instance. For more information about DaaS, see DaaS – Diagnostics as a service for Azure web sites.
Excessive CPU usage is another reason why the platform manages the memory dump collection so that they match the recommended procdump patterns. The procdump command, as shown in the previous table, collects three (-n 3) full memory dumps (-ma) 30 seconds apart (-s #, in which # is 30) when the CPU usage is greater than or equal to 80 percent (-c 80). Finally, you provide the process ID (<PID>) to the command: procdump -accepteula -ma -n 3 -s # -c 80 <PID>.
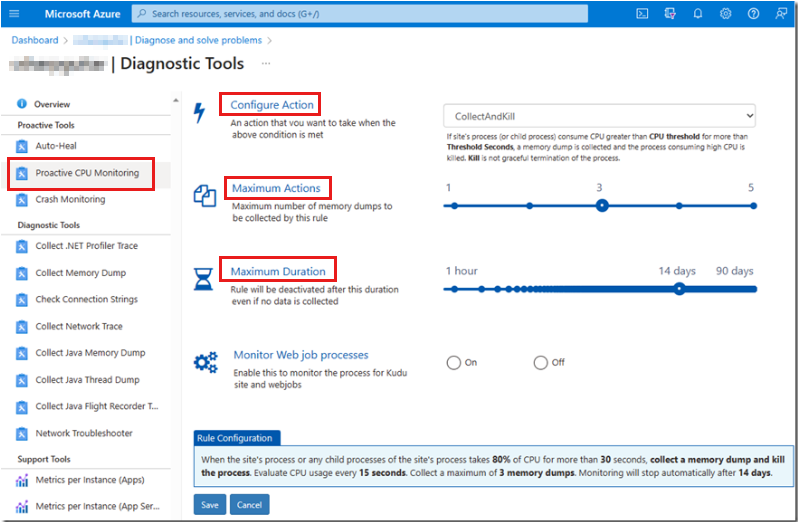
You can see the portal configuration in the "Proactive CPU monitoring" section. For brevity, that section showed only the first three configuration options: CPU Threshold (-c), Threshold Seconds (-s), and Monitor Frequency. The following screenshot illustrates that Configure Action, Maximum Actions (-n), and Maximum Duration are extra available features.
After you study the different approaches for capturing memory dumps, the next step is to practice making captures. You can use code examples on GitHub in conjunction with IIS debugging labs and Azure Functions to simulate each of the scenarios that are listed in the two tables. After you deploy the code to the Azure App Service platform, you can use these tools to capture the memory dump under each given scenario. Over time and after practice, you can perfect your approach for capturing memory dumps by using the Azure App Service debugging features. The following list contains a few suggestions to consider as you continue to learn about memory dump collection:
Capturing a memory dump consumes significant system resources and disrupts performance even further.
Capturing memory dumps on the first chance isn't optimal because you will probably capture too many. Those first-chance memory dumps are most likely irrelevant.
We recommend that you disable Application Insights before you capture a W3WP memory dump.
After the memory dump is collected, the next step is to analyze the memory dump to determine the cause of the problem, and then correct that problem.
Next steps (analyzing the memory dump)
Discussing how to analyze memory dumps is outside the scope of this article. However, there are many resources for that subject, such as the Defrag Tools training series and a list of must-know WinDbg commands.
You might have noticed the Configure Action option in the previous screenshot. The default setting for this option is CollectAndKill. This setting means that the process is killed after the memory dump is collected. A setting that's named CollectKillAndAnalyze analyzes the memory dump that's collected. In that scenario, the platform analysis might find the issue so that you don't have to open the memory dump in WinDbg and analyze it.
There are other options for troubleshooting and diagnosing performance issues on the Azure App Service platform. This article focuses on memory dump collection and makes some recommendations for approaching the diagnosis by using these methods. If you have already studied, experienced, and perfected your collection procedures, and they work well for you, you should continue to use those procedures.
Contact us for help
If you have questions or need help, create a support request, or ask Azure community support. You can also submit product feedback to Azure feedback community.
