Using the .NET Aspire dashboard
Once you've recorded telemetry data, you need a way to examine it. With .NET Aspire, the dashboard provides rich tools to investigate telemetry and diagnose problems.
Imagine you work for an outdoor equipment retailer. You're using OpenTelemetry in your .NET Aspire cloud-native app. Now you want to examine the data that telemetry emits to decide if you can use it to improve performance.
In this unit, you'll see how the .NET Aspire dashboard displays telemetry data.
Telemetry in the .NET Aspire dashboard
When you start an app built with .NET Aspire on your development computer, and the containers that run each integration, .NET starts the .NET Aspire dashboard. This web interface has five sections, four of which display telemetry:
- Resources: Lists the containers, projects, and executables that make up your entire cloud-native app. Use the links in the Endpoints column to connect to each microservice.
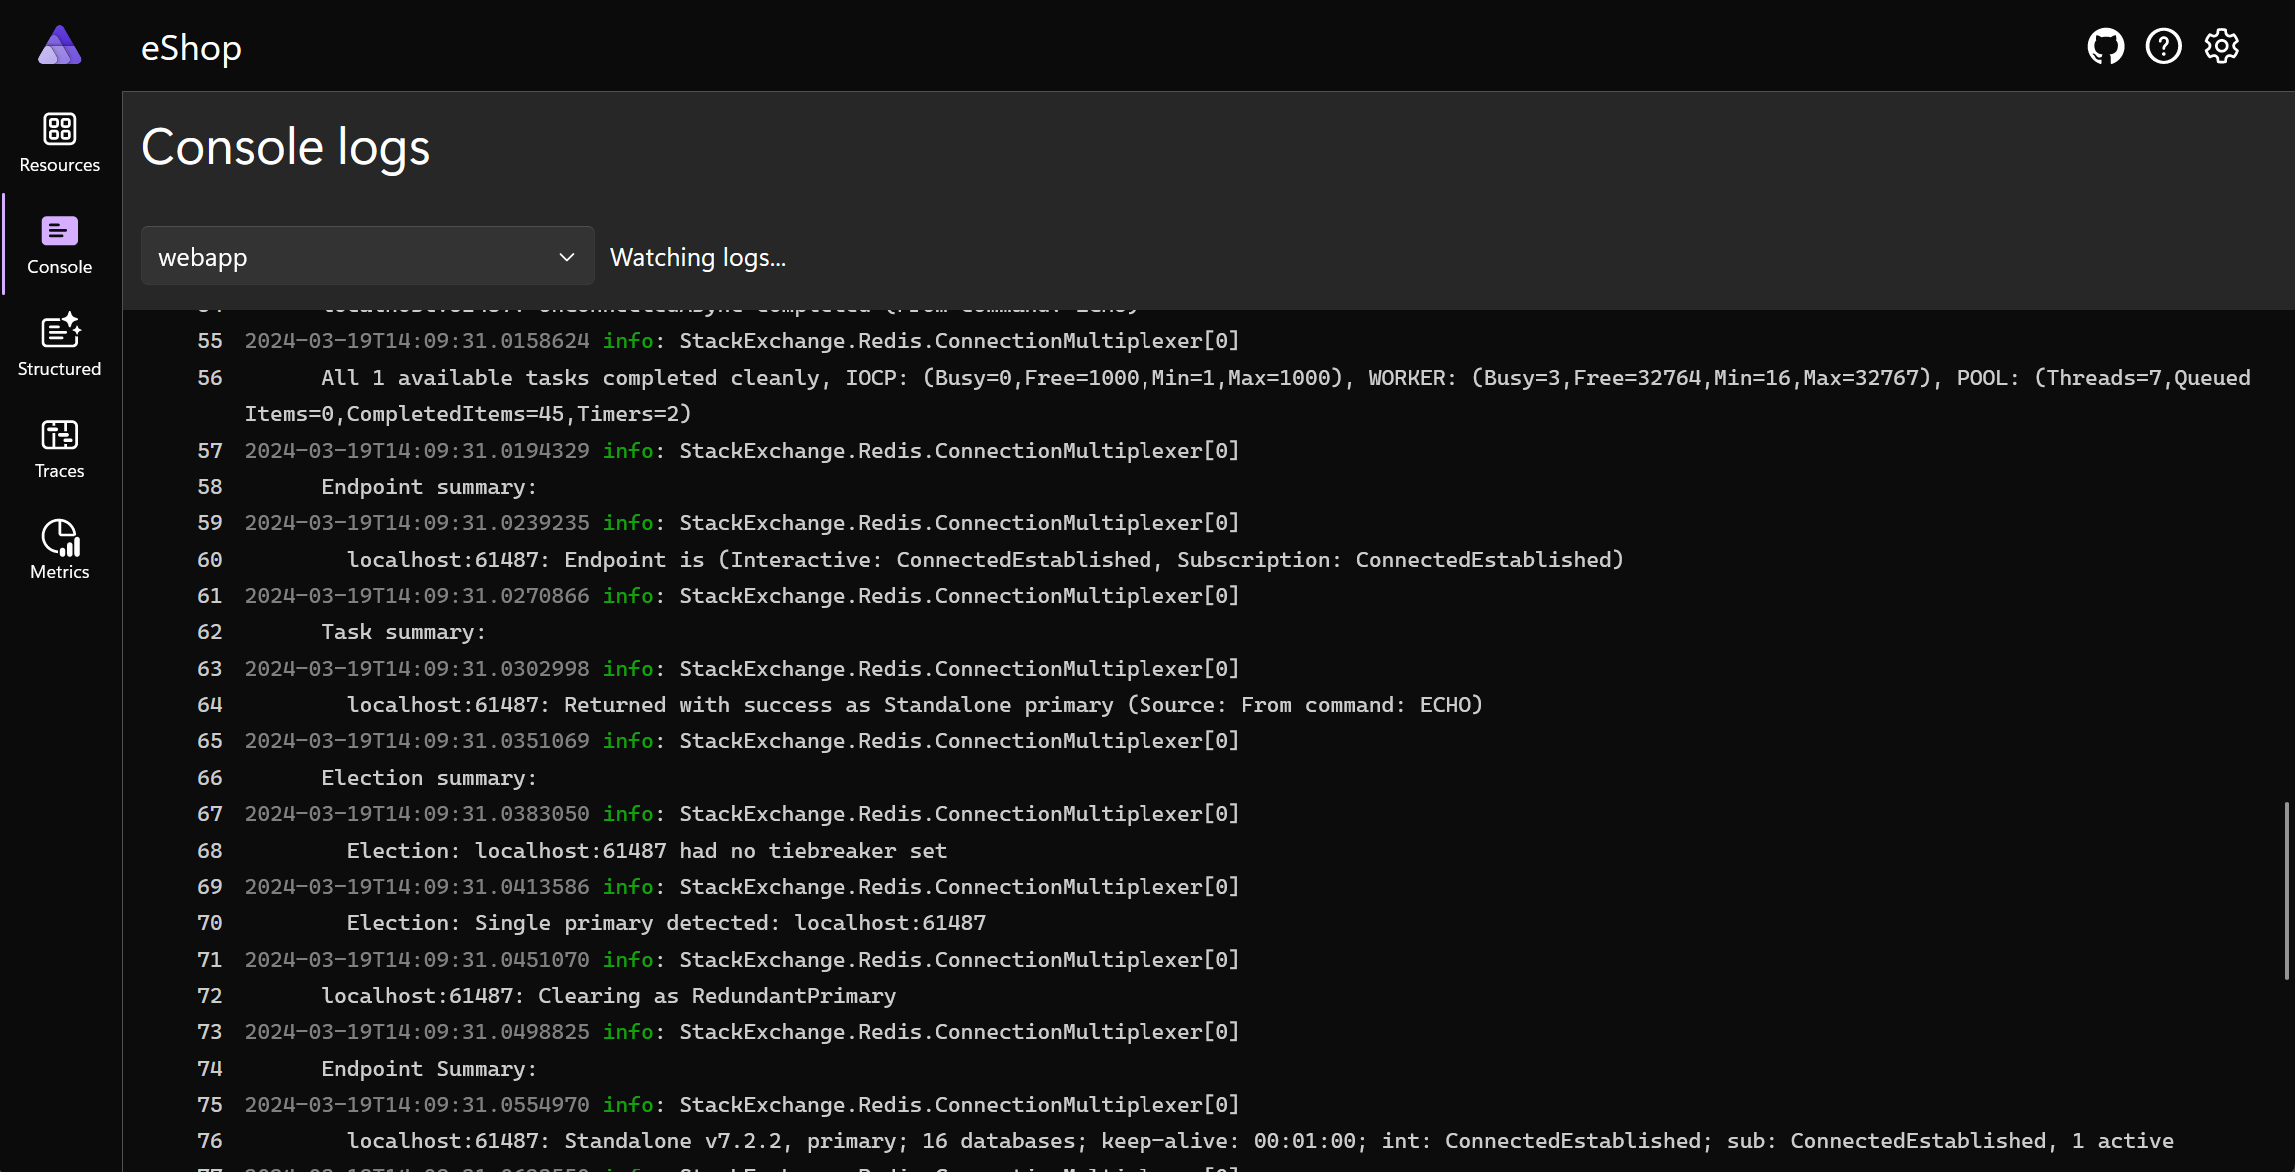
- Console: Displays the text sent to standard output from the integration you specify.
- Structured logs: Displays information sent to OpenTelemetry loggers.
- Traces: Displays a trace for each request received by any microservice in the app.
- Metrics: Displays configurable time domain graphs that show how the metrics you choose vary.
Logs in the dashboard
Logged events describe what happens as your app starts and runs. You can see two types of logged information in the dashboard: console logs and structured logs.
Console logs
Console logs display text that your app has sent to standard output. A command-line program would display such text as lines in the console but microservices and backing services have no intrinsic place to display standard output. .NET Aspire helps by providing the Console logs page in the dashboard.
When you open the page, you must first select a source integration, such as one of your microservices. The tool displays all the standard output from that source in the main window with some formatting. For example, the information events are shown in green while failures are shown in red.
Console logs are simply lines of text. They are easy for applications to create and emit, but they are hard to read for humans and difficult to process for analysis purposes because they lack structure.
Structured logs
Instead of flat text, structured logs preserve logged messages with their template and message parameters. This structure makes it easier to filter out events that are irrelevant so you can drill down to troubleshoot a specific problem. In a production environment, the logs can be persisted, indexed, and then queried like a database. In this way you can perform rich analytics on the data that they contain.
Note
Structured logs are also often called semantic logs.
In your code, send an event to the structured logs by using an OpenTelemetry ILogger object:
logger.Info("{shopitem} added to basket by {user}", "Ski goggles", "Kenny");
In the .NET dashboard, the Structured logs page shows events from every resource in your app. To drill down, select the resource that you're troubleshooting and use the Filter and Level boxes to display only relevant events.
Distributed traces in the dashboard
A trace is a record that describes how a request was processed and returned to the caller. Each trace might involve calls to multiple integrations in your app. For example, when a user requests the product catalog web page, the web UI microservice might receive the request, which may call the authentication microservice, the catalog microservice, and the Redis cache, before returning a web page to the user.
Each trace is composed of spans, such as the call to the catalog microservice. The system records each span with its timing and parent information, so that you can see which integration responds rapidly and which causes delays. Further details are available for each span.
Similar to structured logs, you can select the source and apply filters to drill down and locate traces for the specific problem you're interested in diagnosing.
Metrics in the dashboard
Metrics are values that vary over time, recorded by a integration of your app. For example, metrics may record the duration of a request and response or a count of the active connections to your catalog microservice. Some metrics are built into .NET, some come with the OpenTelemetry SDK libraries, and developers can add custom OpenTelemetry metrics that are unique to their integration.
The .NET Aspire dashboard includes the Metrics section, which you can use to investigate and display how metrics vary over time.
For example, the http.server.active_requests metric displays the number of requests being processed at any given moment:
The http.server.request.duration metric displays how responsive the app is at any given moment:
Under each graph, you can specify filters to target the graph. For example, this graph shows the request duration metric for requests to the homepage route:


