Using OpenTelemetry in .NET Aspire
.NET Aspire helps you to record a cloud-native app's behavior by including OpenTelemetry support automatically when you create a .NET Aspire project.
Imagine you work for an outdoor equipment retailer. You've decided that you want to record telemetry data. Now you want to find out how .NET Aspire helps with telemetry.
In this unit, you'll learn about the integration between .NET Aspire and OpenTelemetry APIs.
.NET Aspire and OpenTelemetry
A principal aim in the design and implementation of .NET Aspire is to ensure that cloud-native apps are easy to monitor and troubleshoot. .NET Aspire simplifies ensuring that the complete app is observable and fully instrumented by using the OpenTelemetry APIs and automatically setting up the sources of telemetry data whenever you create a new app from the templates or add an existing app to .NET Aspire orchestration.
.NET Aspire integrations also have built-in support for telemetry.
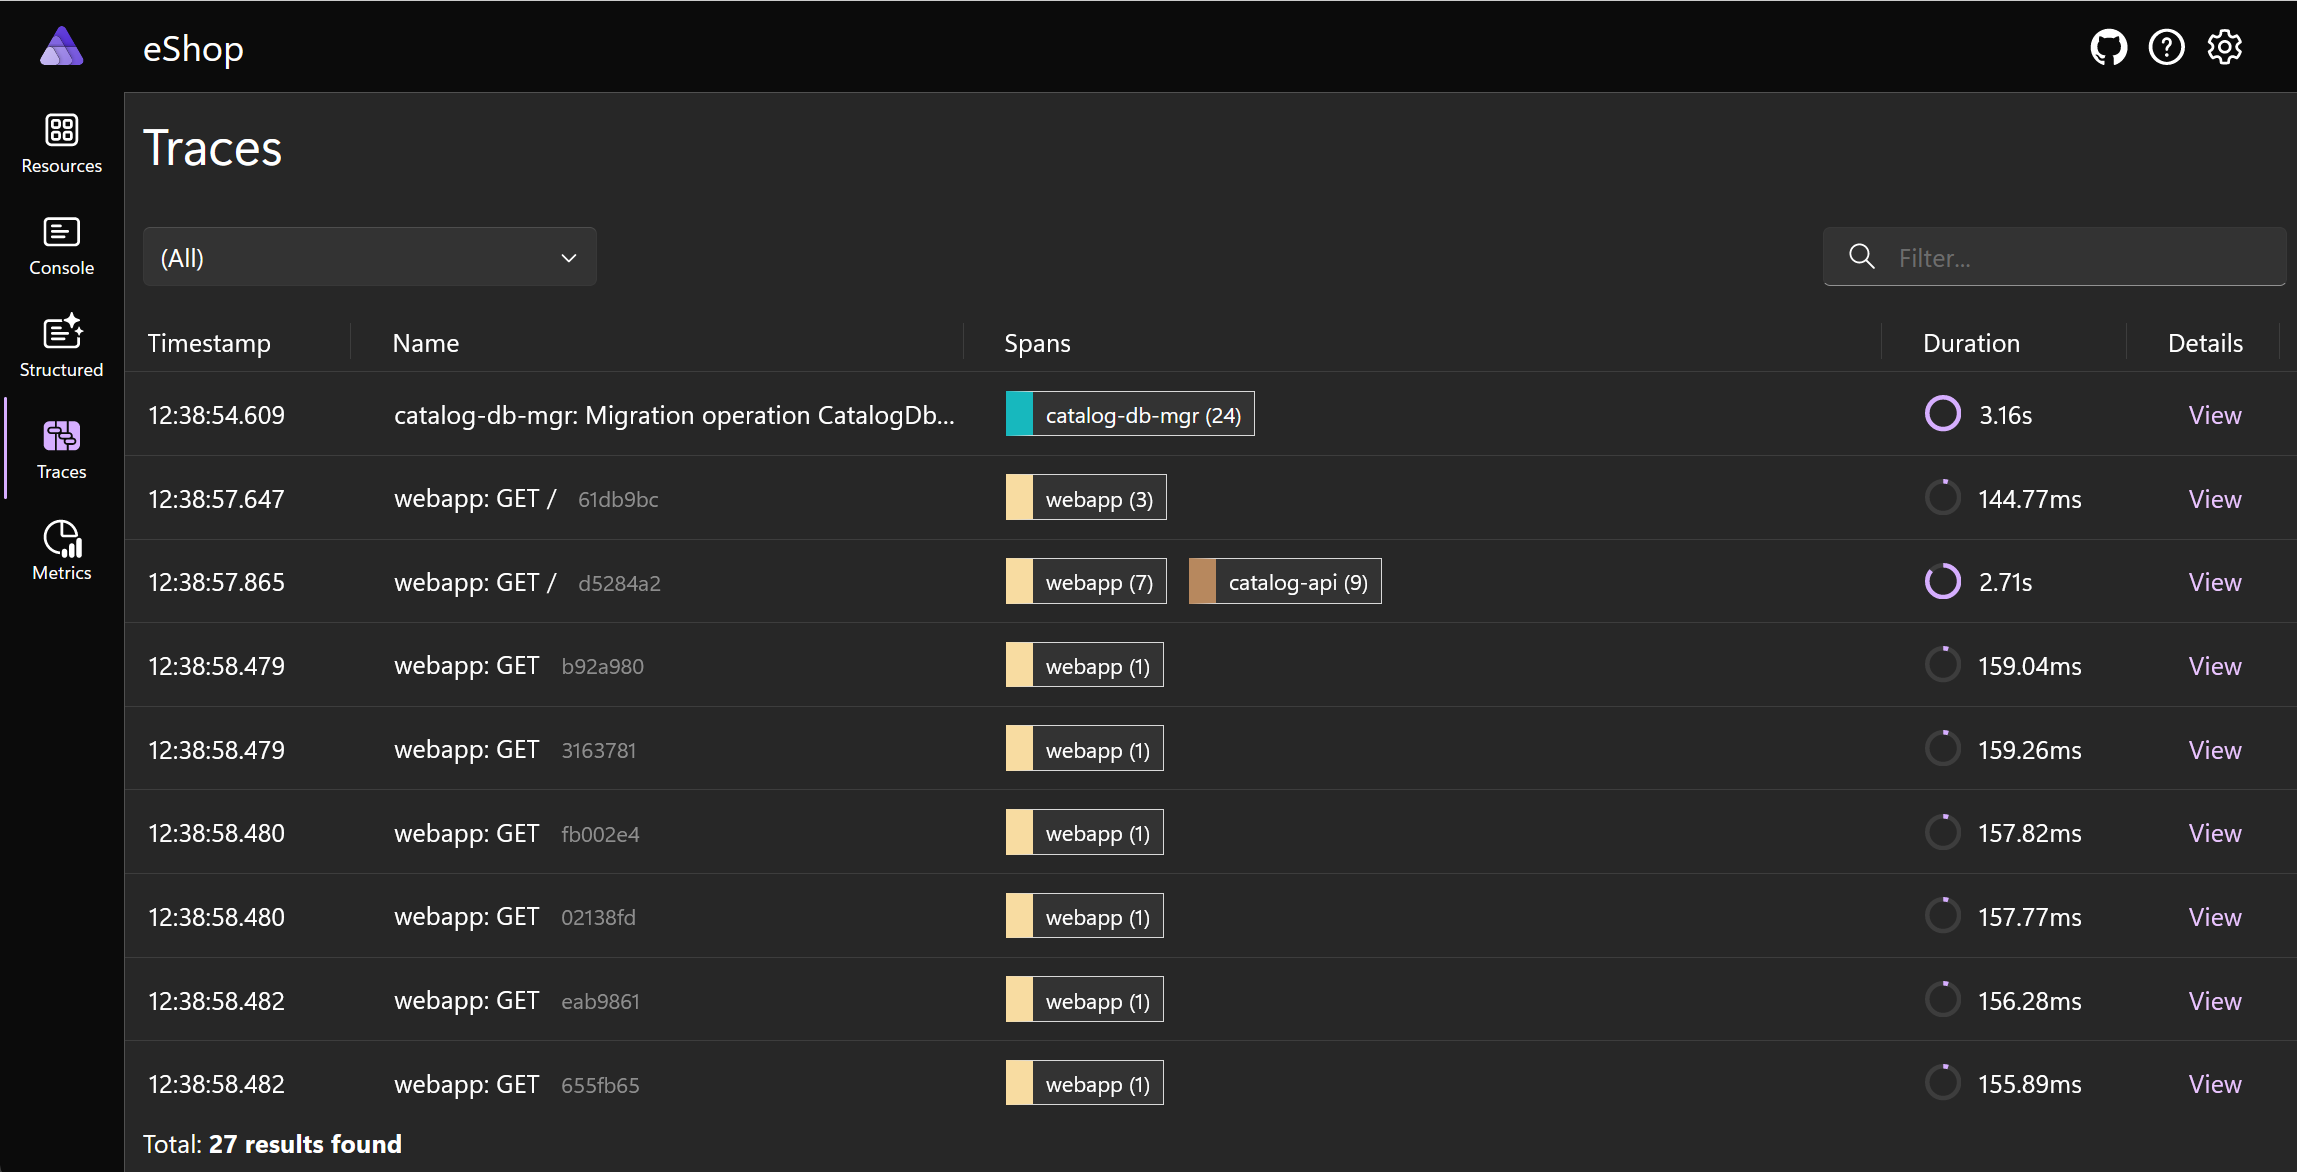
.NET Aspire provides the .NET Aspire dashboard when you debug locally. This web interface includes rich tools that display logs, metrics in graphical formats, and traces in timelines.
OpenTelemetry configuration in .NET Aspire
The code that adds and configures OpenTelemetry in a .NET Aspire solution is in the ServiceDefaults project. In the Extensions.cs file you find:
- The
ConfigureOpenTelemetry()method, which adds logging, metrics, and tracing services. - The
AddOpenTelemetryExporters()method, which adds OpenTelemetry Protocol (OTLP) exporters. - The
AddBuiltInMeters()method, which adds all the metrics that are built into .NET.
Unless you want to add other exporters or metrics, you can leave this code as it is.
You should extend this code when you want to:
- Add additional sources of metrics or distributed tracing data, such as custom metrics.
- Add exporters to send telemetry data to an Application Performance Management (APM) system such as Application Insights or Grafana.
Exporting telemetry
OpenTelemetry can export the data it records to different tools, so you can choose the one that supports the analysis you need.
Common telemetry export destinations include:
- The Aspire dashboard. You'll learn more about the dashboard later in this module.
- Other Application Performance Management (APM) tools such as Prometheus and Grafana.
- Azure Application Insights. This feature of Azure Monitor can analyze and display behavior data from many sources, both within Azure and from other sources, such as cloud-native apps.
Learn more
- .NET Aspire telemetry
- .NET observability with OpenTelemetry
- Creating custom metrics
- Adding distributed tracing instrumentation
