Continuously monitor applications and services
In this unit, you'll learn:
- How continuous monitoring helps you validate the health, performance, and reliability of your application and infrastructure.
- How observability makes data available from the systems you need to monitor.
- How Azure Monitor and Application Insights enable you to implement continuous monitoring.
- How IT Service Management Connector can help you implement a ticketing system.
What is continuous monitoring?
The team wants to monitor the website and the infrastructure during the beta test. Tim has done some research and learned a few things.
Continuous monitoring refers to the processes and technologies that you can use to monitor each phase of your application's lifecycle. Continuous monitoring helps you validate your application and infrastructure's health, performance, and reliability as changes move from development to production.
Continuous monitoring builds on CI/CD concepts, which help you develop and deliver software faster and more reliably to provide continuous value to your users.
What is observability?
Observability refers to making data available from within the system that you wish to monitor. Monitoring is the actual task of collecting and displaying this data.
What is Azure Monitor?
Azure Monitor is a service in Azure that provides full-stack observability across applications and infrastructure both in the cloud and on-premises.
Azure Monitor works with development tools such as Visual Studio and Visual Studio Code, so you can use it during your development and test phases. It integrates with Azure DevOps to provide release management and work item management during your deployment phases.
Azure Monitor also integrates with IT service management (ITSM) and Security information and event management (SIEM) tools to help you track issues and incidents within your existing IT processes.
Enable monitoring on your applications
Applications are complex and have many interconnected components. To visualize the end-to-end transactions and connections across all system, you need to enable monitoring on all of your web applications and services.
If you don't have an existing project in Azure DevOps, you might start with Azure Developer CLI. Azure Developer CLI (azd) is an open-source tool that accelerates the time it takes for you to get your application from local development environment to Azure. azd provides best practice, developer-friendly commands that map to key stages in your workflow, whether you’re working in the terminal, your editor or integrated development environment (IDE), or CI/CD (continuous integration/continuous deployment).
Then, you can add continuous monitoring to your release pipeline by combining Azure Pipelines with Azure Application Insights. Application Insights is an Azure Monitor feature that you can use to monitor your live applications. We'll take a closer look at Application Insights shortly.
Enable monitoring on your infrastructure
Applications are only as reliable as their underlying infrastructure. Having monitoring enabled across your entire infrastructure helps you achieve full observability and makes it easier to discover root causes when something fails.
Azure Monitor helps you track the health and performance of your entire hybrid infrastructure, including virtual machines, containers, storage, and networks.
With Azure Monitor, you can collect:
- Platform metrics, activity logs, and diagnostics logs from most of your Azure resources with no additional configuration needed.
- Monitoring data for VMs. (Azure Monitor for VMs)
- Monitoring data for AKS clusters. (Azure Monitor for containers)
Infrastructure as code allows you to describe, through code, the infrastructure that you need for your application. Because you describe your infrastructure by using code, you can follow the same development, testing, and versioning schemes that DevOps teams use for applications.
To enable monitoring by using an infrastructure as code approach, you can use:
- Resource Manager templates to enable monitoring and configure alerts over a large set of resources.
- Azure Policy to enforce different rules over your resources. Azure Policy helps ensure that those resources stay compliant with your corporate standards and service-level agreements (SLAs).
Use Azure resource groups to combine resources
A typical application on Azure includes compute resources such as virtual machines, Azure App Service, microservices, Azure Kubernetes Service (AKS) clusters, and Azure Service Fabric. These applications frequently depend on data and networking services such as Azure Event Hubs, Azure Storage, Microsoft SQL Database, and Azure Service Bus.
In Azure, a resource group holds related Azure resources. Combine resources in a resource group to get full observability across all the resources that make up your different applications. Azure Monitor for resource groups provides a basic way to keep track of the health and performance of your entire application and lets you drill down into individual components so that you can troubleshoot failures.
Ensure quality through continuous deployment
CI/CD enables you to integrate and deploy code changes to your application automatically, based on the results of automated testing. CI/CD streamlines the deployment process and verifies the quality of your code before changes move to production.
Here are some recommended ways to ensure quality during your deployment process:
Use Azure Pipelines to implement a CI/CD pipeline that automates your entire process, including running automated tests, from the time you commit code all the way to production.
Use deployment gates to add monitoring into your pre-deployment and post-deployment environments.
Deployment gates help ensure that you meet key health and performance metrics (KPIs) as your applications move from development to production. Deployment gates also help ensure that any differences in the infrastructure environment or the way that you scale do not negatively impact your KPIs.
Maintain separate monitoring instances among your different deployment environments such as development, test, staging, and production.
Separate monitoring instances help ensure that any data that's collected is relevant across applications and infrastructure. If you need to correlate data across environments, you can use multiple resource charts in Metrics Explorer or create cross-resource queries in Log Analytics.
Create alerts that you can act on
To ensure that your monitoring efforts are effective, you need to notify administrators of any active issues as well as issues you predict might happen. Some ways to accomplish this are to:
Create alerts in Azure Monitor, based on logs and metrics to identify predictable failure states.
The goal is to ensure that each alert represents a critical condition that you can act on. A false positive happens when monitoring reports an issue that does not actually exist. Use dynamic thresholds to automatically calculate baselines on metric data rather than defining your own static thresholds.
Define actions for alerts to that most effectively notify your administrators.
Available actions for notification include short message service (SMS), email, push notifications, or voice calls.
Use more advanced actions to connect to your ITSM tool or other alert management systems through webhooks.
Use Azure Automation runbooks or webhooks to remediate alert conditions.
Use autoscaling to dynamically adjust your compute resources based on the metrics you collect.
Create dashboards and workbooks
Ensuring that your development and operations teams have access to the same telemetry and tools allows them to view patterns across your entire environment and minimizes your Mean Time To Detect (MTTD) and Mean Time To Restore (MTTR). Here are some ways to do that:
Create custom dashboards that are based on common metrics and logs for the different roles in your organization.
Dashboards can combine data from multiple Azure resources.
Create Azure Monitor workbooks to share knowledge between development and operations teams.
You can prepare a workbook as a dynamic report that contains charts and log summaries. Developers can create troubleshooting guides to help customer support or operations troubleshoot problems.
Continuously optimize
Monitoring is one of the fundamental aspects of the popular Build - Measure - Learn philosophy, which recommends that you continuously track your KPIs and user behavior metrics and then optimize them through iterative planning exercises. Azure Monitor helps you collect metrics and logs that are relevant to your business and to add new data points in the next deployment.
- Use tools in Application Insights to track end-user behavior and engagement.
- Use Impact Analysis to help you prioritize which areas to focus on to improve on your most important KPIs.
What is Azure Application Insights?
Application Insights is an Application Performance Management (APM) service for web developers. With it, you can:
- Monitor your live web application.
- Automatically detect performance anomalies.
- Diagnose failures and understand what users actually do with your application.
Application Insights works with .NET, Node.js, Java, and many other programming languages and frameworks. It works with applications that are hosted in the cloud or on-premises.
Application Insights provides connection points that you can use to integrate with your existing DevOps processes and tools. Application Insights also integrates with Visual Studio App Center, which enables you to monitor and analyze telemetry from your mobile applications.
How does Application Insights work?
You start by adding a small instrumentation package to your application. Then, you create an Application Insights resource in the Azure portal. The instrumentation monitors your app and sends telemetry data back to Azure, which you can access from the portal. Remember that your application can run anywhere; it doesn't need to be hosted in Azure.
In addition to web applications, you can instrument almost any kind of background component. You can even instrument JavaScript code.
Here's a diagram that shows the flow of monitoring data from live services into Application Insights. Application Insights can then raise alerts or push data to another tool so that you can visualize and understand trends.
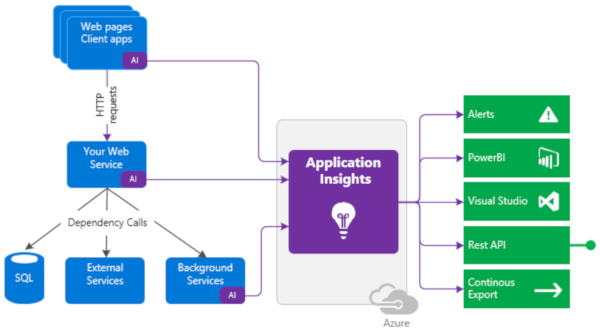
You can also pull in telemetry data from your host environments. This data includes performance counters, Azure Diagnostics, and Docker logs. You can also set up synthetic monitoring tests. Synthetic monitoring uses a set of transactions to assess performance and availability. Synthetic transactions are predictable tests that enable you to compare results from release to release.
What's the overhead? The impact on your app's performance is typically small. Tracking calls are non-blocking and are batched and sent on a separate thread.
What does Application Insights monitor?
Application Insights helps development teams understand how their app is performing and how it's being used.
Application Insights monitors:
Request rates, response times, and failure rates.
Find out which pages are most popular, at what times of day, and where your users are. See which pages perform best. See how your response times and failure rates compare to your traffic levels.
Whether external services are slowing you down.
Application exceptions.
Analyze the aggregated statistics, or pick specific instances and investigate the stack trace for related requests. Application Insights reports exceptions that occur both on the server and on the client.
Web page load performance, as reported from the user's web browser.
AJAX calls from web pages, including response times and failure rates.
User and session counts.
Performance counters from your Windows or Linux server machines, such as CPU, memory, and network usage.
Host diagnostics from Docker or Azure.
Diagnostic trace logs from your app. This enables you to correlate trace events with requests.
Custom events and metrics that you write yourself in the client or server code. For example, you might track events such as items sold or games won.
Where do I see my telemetry?
Here are ways you can view and track your telemetry data:
-
Automatic alerts adapt to your app's normal patterns of telemetry and trigger when there's something outside the usual pattern. You can also set alerts on particular levels of custom or standard metrics.

-
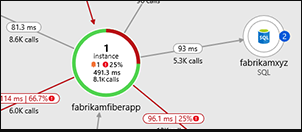
Application Map helps you spot performance bottlenecks or failure hotspots across all components of your distributed application.
-
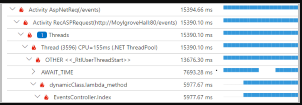
You can run Profiler on ASP.NET and ASP.NET Core apps that are running on Azure App Service that use the Basic service tier or higher.
-
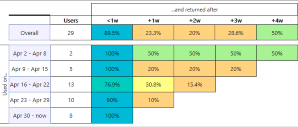
This feature lets you analyze user segmentation and retention.
-
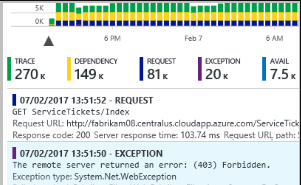
Search helps you find and explore individual telemetry items, such as page views, exceptions, or web requests.
-
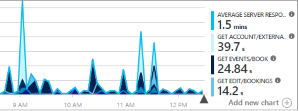
Metrics explorer allows you to plot charts, visually correlate trends, and investigate spikes and dips in metrics.
-
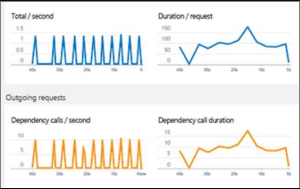
When you deploy a new build, watch performance indicators in close to real time to make sure everything works as expected.
-
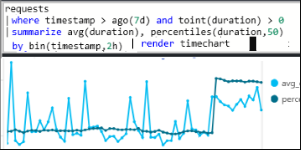
Answer tough questions about your app's performance and usage by using a powerful query language.
-
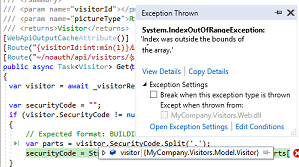
Collect a debug snapshot from your live web application.
-
Integrate usage metrics with other business intelligence.

-
Export raw data to storage as soon as it arrives.
What's IT Service Management Connector?
IT Service Management Connector (ITSMC) for Azure provides bidirectional integration between Azure monitoring tools and your ITSM tools, including:
- ServiceNow
- Provance
- Cherwell
- System Center Service Manager
You can integrate Azure monitoring tools with ITSMC to:
- Create or update work items in the ITSM tools, based on Azure alerts.
- Pull incident and change request data from ITSM tools into Azure Log Analytics.
Azure monitoring tools allow you to identify, analyze, and troubleshoot issues. However, the work items related to an issue are typically stored in an ITSM tool. It makes more sense to implement a ticketing system with the ITSMC. That way, instead of going back and forth between your ITSM tool and Azure monitoring tools, you can get all the information that you need in one place. ITSMC improves the troubleshooting experience by reducing the time it takes to resolve issues.