Understand Data Wrangler
Data Wrangler is a tool built on Microsoft Fabric notebooks that offers a comprehensive platform for exploratory and preprocessing tasks. It offers a data display, dynamic summary statistics, built-in visualizations, and a library of common data preprocessing operations.
Each operation updates the data display in real time and generates reusable code that can be saved back to the notebook. Its user-friendly interface makes it an efficient tool for data scientists to handle large volumes of data, transforming raw data into a ready-to-use dataset for analysis.
Think of Data Wrangler as a tool that generates code for your data exploration and preprocessing needs.
Work with Data Wrangler
Data Wrangler can help with the preprocessing phase of building a machine learning model by providing tools and functionalities for data cleaning, feature engineering, data exploration, and improving efficiency in data preprocessing.
Data Exploration: The tool’s grid-like data display allows you to visually explore your data, which can lead to insights about variables.
Data Cleaning: Data Wrangler provides a library of common data-cleaning operations, making it easier to handle missing values, outliers, and incorrect data types.
Feature Engineering: With its built-in visualizations and dynamic summary statistics, Data Wrangler can help you understand the distribution of your data and create new features.
Data Wrangler can help ensure that your data is in the best possible shape before it’s used to train a machine learning model. This can lead to more accurate models and better predictions.
Launch Data Wrangler from a notebook
To launch Data Wrangler in Microsoft Fabric, follow these steps.
Switch from Power BI to Data Science by using the experience switcher icon on the left side of your home page. Then, create a new notebook.
Read your data into a Pandas DataFrame in a Microsoft Fabric notebook.
import pandas as pd
df = pd.read_csv("https://raw.githubusercontent.com/plotly/datasets/master/titanic.csv")
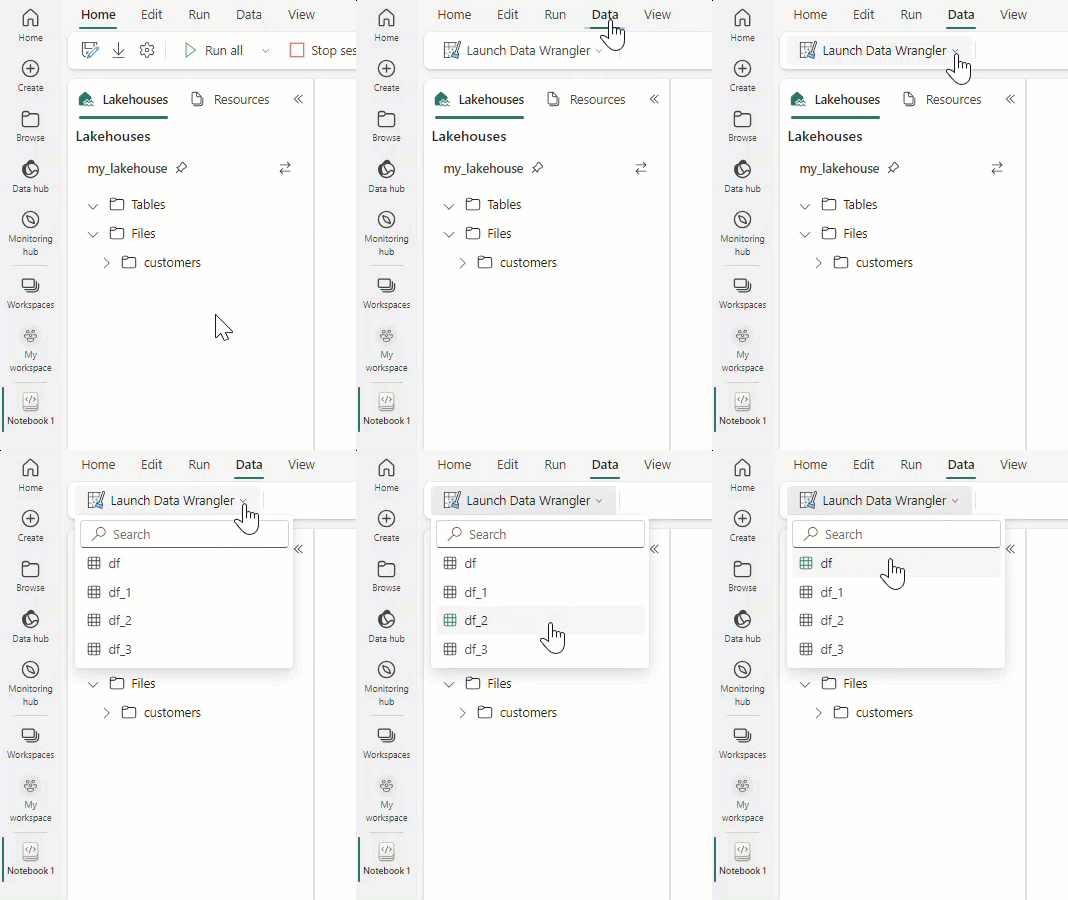
Once your data is loaded into a dataframe, select Data in the notebook ribbon.
Select Launch Data Wrangler, and then select the dataframe you want to open in Data Wrangler. If you have multiple dataframes, they all show up.

Tip
The Data Wrangler Extension for Visual Studio Code allows for the integration of Data Wrangler into both VS Code and VS Code Jupyter Notebooks.
Work with operators
Imagine you're working on a large dataset for a critical project. The data needs a lot of work. You have missing values, duplicate rows, and columns that need renaming. Plus, you need to transform some categorical data into a format that your machine learning model can understand.
This is where Data Wrangler comes in. With minimal effort, you can sort and filter rows, one-hot encode categorical data, change column types, drop unnecessary columns, rename columns, handle missing values, and much more. Not only does Data Wrangler make these tasks easier, but it also generates reusable Python code for each operation, which you can save back to your notebook. This means you can automate data processing tasks for future datasets.
Here are the operator categories that are currently available in Data Wrangler.
| Category | Description |
|---|---|
| Find and Replace | Includes operations such as dropping duplicate rows, handling missing values, and finding and replacing values. |
| Format | Involves text transformations like converting to upper/lower/capital case, splitting text, stripping whitespace, and automatic transformations powered by Microsoft Flash Fill. |
| Formulas | Allows creation of new columns using custom Python formulas, multi-label binarizer, one-hot encoding, and calculating text length. |
| Numeric | Includes operations like rounding (up, down, or to the nearest number) and scaling min/max values. |
| Schema | Allows changes to the DataFrame schema, such as changing column type, cloning/dropping/renaming/selecting columns. |
| Sort and Filter | Includes operations for filtering and sorting values. |
| Others | Includes custom operations for modifying the dataframe, grouping and aggregating, and automatic column creation powered by Microsoft Flash Fill. |
In the next units, we'll explore a variety of operators and gain insights into how they can facilitate the preprocessing tasks for building predictive models.