Embed Power BI reports
Power BI reports are the most commonly embedded content type because of the large number of visual types (including AI and custom visuals) and interactive features.
You can embed a Power BI report in three different modes:
- Embed an existing Power BI report
- Edit an embedded report
- Embed a new Power BI report
For each mode, you can set many configuration object properties to specify precisely how the app presents the report. The type property of the configuration object is always set to report.
Embed an existing report
When embedding an existing report, use a configuration object of type IReportLoadConfiguration. In addition to the required properties (described in Unit 1), your app can set the following optional properties.
contrastModeandtheme- Optional. Control the theme and contrast level that your embedded content uses. By default, any content that you embed appears with the default theme and with zero contrast. You can override this behavior by configuring a specific theme or contrast level. For more information, see Themes and high-contrast mode.pageName- Optional. Controls which page of the embedded report appears initially. When not set, it opens the selected page when the author last saved the report.filters- Optional. Sets filter state. Consider setting filter state based on the app context, perhaps to filter by the sales region of the app user. For more information, see Control report filters.slicers- Optional. Like filters, it's possible to set slicer state. For more information, see Control report slicers.bookmark- Optional. Apply a specific bookmark.datasetBinding- Optional. Connects the report to a different dataset that defines the data schema that the embedded report connects to. For more information, see Bind datasets dynamically to a report.permissions- Optional. Grants operations that the user can do. Operation options include create, view, edit, save, or save a copy of the report. Editing and creating reports is covered later in this unit.viewMode- Optional. Determines whether the report opens in view mode (default) or edit mode. As described previously, your app must grant edit permissions to enable edit mode.settings- Optional. Adjusts the appearance and behavior of the report. You can show and expand open panes to work with bookmarks, fields, filters, page navigation, selection, sync slicers, or visualizations. You can also set the layout type to mobile view, or set locale settings, which specify the language and formatting of the report. For more information, see Customize settings.
Note
In many instances, it's possible to change settings after the report loads, perhaps in response to user interactions.
Experience how your app can embed a Power BI report by going to the Power BI embedded analytics playground and working through the following instructions.
Note
The Power BI embedded analytics playground is a website that helps you learn, explore, and try out Power BI embedded analytics. It includes a developer sandbox for hands-on experiences that use the client APIs with sample Power BI content or your own content. Code snippets and showcases are available for you to explore, too.
For more information, see What is the Power BI embedded analytics playground?
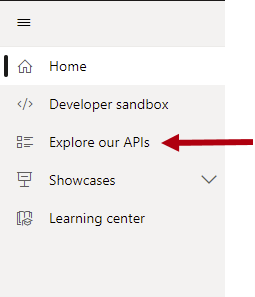
In the left pane, select Explore our APIs.
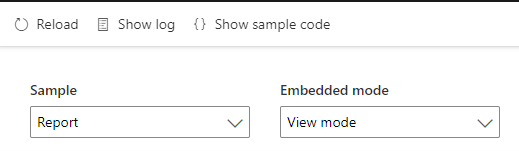
In the content pane, notice the Sample dropdown list and the adjacent Embedded mode dropdown list. By default, both dropdown lists are set to display a Power BI report in view mode.
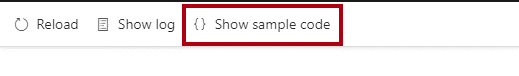
To view how the report was embedded, select Show sample code in the upper left of the pane.
In the code snippet window, scan through the code by vertically scrolling from top to bottom. Look for the lines of code that create the configuration object and embed the report (about halfway down).
// Create the embed configuration object for the report
// For more information see https://go.microsoft.com/fwlink/?linkid=2153590
let config = {
    type: 'report',
    tokenType: models.TokenType.Embed,
    accessToken: accessToken,
    embedUrl: embedUrl,
    id: embedReportId,
    permissions: permissions,
    settings: {
        panes: {
            filters: {
                visible: true
            },
            pageNavigation: {
                visible: true
            }
        }
    }
};

// Get a reference to the embedded report HTML element
let embedContainer = $('#embedContainer')[0];

// Embed the report and display it within the div container.
report = powerbi.embed(embedContainer, config);```
Notice that the configuration object sets the filters and page navigation panes to visible.
Edit an embedded report
To allow the user to edit an embedded report, use a configuration object of type IReportLoadConfiguration. Set the viewMode property to models.ViewMode.Edit.
For information about access token permissions to edit a report, see Create, edit, and save an embedded report. When the user has Copy permission, they can save of copy of the report by using Save As.
In the Power BI embedded analytics playground, in the Embedded mode dropdown list, select Edit mode.
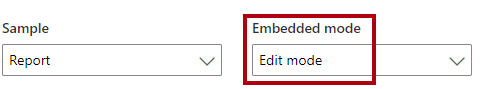
The embedded report now has the action bar across the top of the report. It includes the Save command, which is located in the far right of the report. Now, it's possible to change the report and (attempt to) save the edited report.
Note
Attempting to save the report in the Power BI embedded analytics playground will produce an error because it's a sample app.
Open the code snippet window, and locate the statement that creates the config object. Notice that the viewMode property is set to Edit.
viewMode: models.ViewMode.Edit,
Select Cancel to close the code snippet window.
Embed a new report
To embed a new report, use a configuration object of type IReportCreateConfiguration. The properties in this interface are similar to the properties of the report load configuration object, with the following two exceptions:
datasetId- Required. The DatasetID that the new report connects to.embedUrl- Required. The embed URL of the dataset.
You must set the permissions property to allow creating a report (Create and All).
For information about access token permissions to create and save a report, see Create, edit, and save an embedded report.
In the Power BI embedded analytics playground, in the Embedded mode dropdown list, select Create mode.
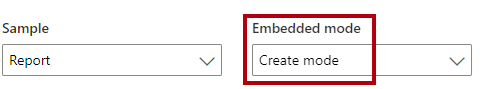
The embedded report now has the action bar across the top of the report. It includes the File menu, which is located in the far left of the report. Now, it's possible to (attempt to) save the report.
Note
Attempting to save the report in the Power BI embedded analytics playground will produce an error because it's a sample app.
Open the code snippet window, and locate the statement that creates the embedCreateConfiguration object. Notice that the code sets the datasetId property.
// This object is used when calling powerbi.createReport.
let embedCreateConfiguration = {
    tokenType: models.TokenType.Embed,
    accessToken: accessToken,
    embedUrl: embedUrl,
    datasetId: embedDatasetId,
};
Select Cancel to close the code snippet window.
For a complete description on embedding Power BI reports, see Embed a report.