Create reports with Copilot for Power BI
Now you understand the value of prepared data and how to design a semantic model based on your report needs. Next, we explore how to visualize the data and provide insights for data-driven decision making.
Create reports with Power BI Desktop
Power BI Desktop is the primary report development tool. You can connect to, transform, model, and visualize data all from this application. Let's explore how Copilot can assist you in creating visuals and reports in Power BI Desktop.
Note
You need to be signed in with an account that has access to a workspace before you can use Copilot.
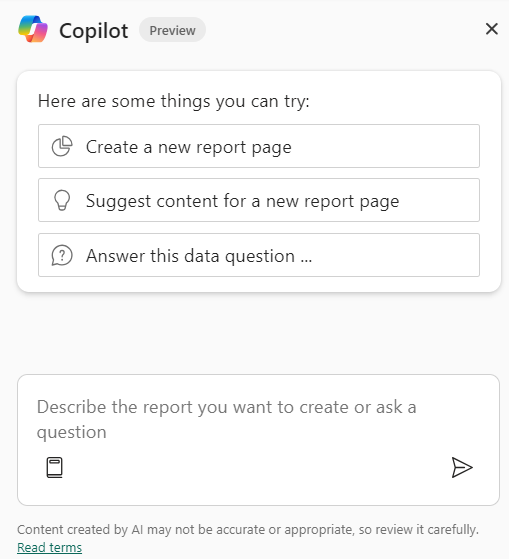
The Copilot experience is consistent with other Microsoft Copilot products - select the Copilot button and a new pane opens with suggested prompts and chat capabilities.
Some of the prompts you can try are:
- Create a new report page.
- Suggest content for a new report page.
- Answer this data question... (then insert your question in the chat).

The following example was generated by using the Create a new report page suggested prompt. Copilot asked for the name and description, and then created the report elements, including:
- Header with slicers for product and salesperson.
- Card visuals for the sums of sales, cost, and measure for profit (sales minus cost).
- Area charts evaluating sales, cost, and profit over time.
- Column charts evaluating sales, cost, and profit by product.
- A Map visual for sales by region.
This report and all of the elements were generated in a consistent theme and created quickly.

Create reports with Power BI service
When you create reports in Power BI Desktop, you can publish them to the Power BI or Fabric service for collaboration and distribution. When you publish the report, two items are created within a workspace: a semantic model and the report.
- The report is the visual representation you created in the Report view in Power BI Desktop.
- The semantic model is the underlying data, including relationships and measures.
To create reports through the Power BI service, you start by selecting the ellipsis (...) from the semantic model and then Create report.

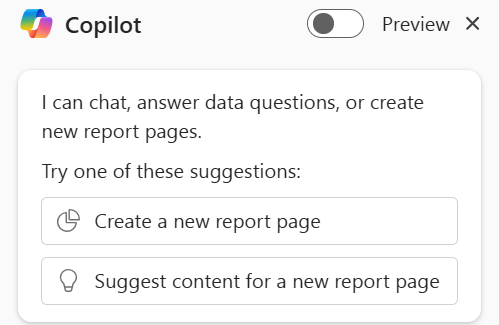
Select the Copilot button and see a similar experience with suggested prompts and chat field.

Tip
If you don't see Copilot, your admins may not have enabled it, or you may not have selected a semantic model.
For this example, we see several different possibilities offered, including:
- Sales Performance by Salesperson
- Regional Sales Analysis
- Product Cost and Profitability
In the following screenshot, we selected the Product Cost and Profitability prompt to generate a new report page. This page has a similar layout from the one created with Power BI Desktop. There are Card visuals, Bar and Column charts, and Area charts to help analyze the cost and profitability of different products, including standard cost, profit, and profit margin.

Create pages with custom prompts
You can also provide your own prompt based on your knowledge of the data and business requirements for the report. There might be limitations to what Copilot can create based on your prompt. Some ideas for our model are:
- Create a page that shows the top 10 products by sales.
- Create a visual on a new page that shows the top three colors across all products sold.
Tip
For more information, see Write Copilot prompts that produce results in Power BI.
Final considerations
When using Copilot, you should consider it to be your first draft, which requires your review before finalizing. While you might keep visuals as is, you might want to change colors or labels for others. Remember:
- Updates are being made continually, so expect improvements.
- Copilot responses are generated with AI and can make mistakes. Always check your work.
Note
The screenshots and suggestions in your environment may may differ from those that were generated at the time this unit was written.
For our examples, we published a semantic model to the Power BI service, based on the AdventureWorks database.