Use Copilot for Power BI to model your data
Properly prepared data is the foundation for data insights. Once you clean, transform, and shape your data, you can start to design the semantic model.
Connect tables with relationships
Your next step is to create relationships between tables. Relationships allow you to filter and summarize data in report visuals later in the development process. You can use the autodetect relationships feature to get you started, then use Copilot to summarize the initial semantic model to determine if any other relationships are needed.
In the following image, there's a single fact table with dimension tables connected by relationships. Power BI reports work best when using a star or snowflake schema for the semantic model.

Create quick measures
Once your tables are connected, you might find that you're unable to answer the business requirement questions with the data as is. In this scenario, you can create measures using DAX (Data Analysis Expressions) to create new data calculations to solve your requirements. DAX is versatile and powerful, but also daunting when getting started with Power BI. DAX is described as a functional language. Functional languages, like DAX, focus on using functions to compute results, which can be more counter-intuitive compared to the step-by-step approach of set-based languages.
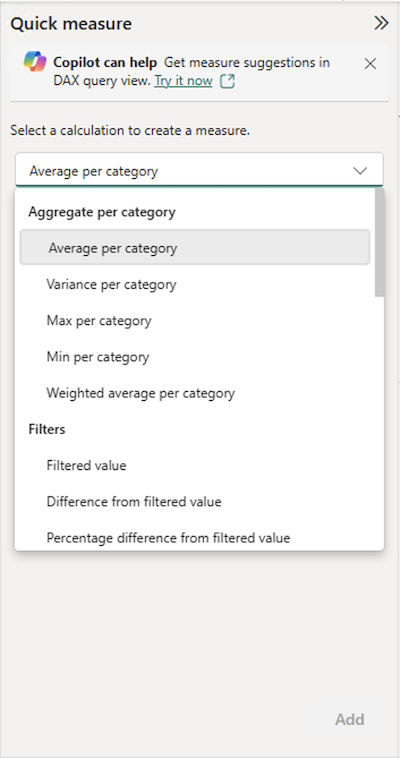
Power BI allows you to create quick measures, which allow you to add the data fields you want to calculate.

Quick measures allow you to create measures and learn DAX with minimal effort, while meeting your report requirements.
Query with DAX
There are four views in Power BI Desktop: Report, Table, Model, and DAX Query. In the DAX Query view, you can select Copilot in the ribbon and use natural language to describe what you want.
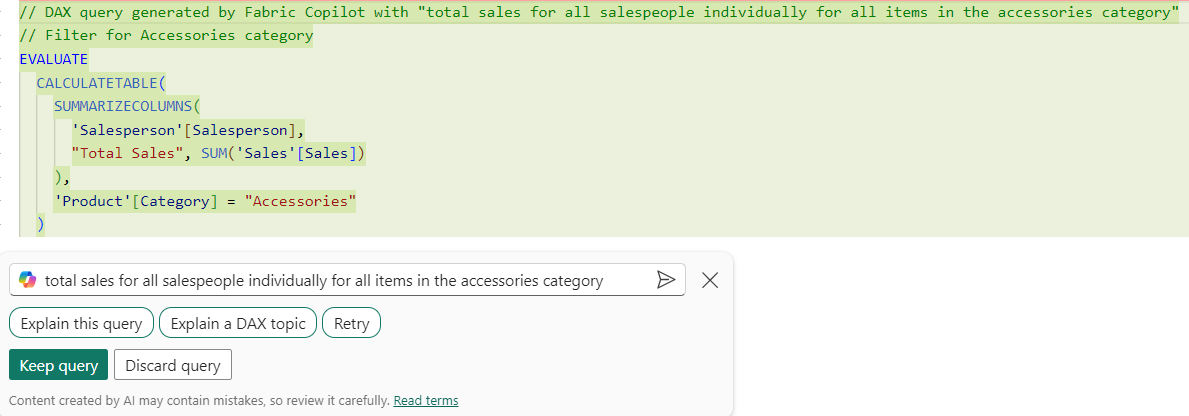
Consider the following prompt total sales for all salespeople individually for all items in the accessories category entered into the Copilot feature of DAX Query view.
This prompt is intending to calculate each individual salesperson's total sales for the accessories category. At AdventureWorks, there are multiple categories with multiple products within. Accessories have low sales, and the business requirement is to understand better who is selling more accessories, in case they can share valuable information.

// DAX query generated by Fabric Copilot with "total sales for all salespeople individually for all items in the accessories category"
// Total sales for each salesperson for items in the accessories category
EVALUATE
  SUMMARIZECOLUMNS(
    'Salesperson'[Salesperson],
    FILTER('Product', 'Product'[Category] == "Accessories"),
    "Total Sales", [Total Sales]
  )
The following table shows sample results of the Copilot-generated DAX query.
| Salesperson | Total Sales |
|---|---|
| Stephen Jiang | 8374.76 |
| Michael Blythe | 38682.84 |
| Linda Mitchell | 66916.05 |
Create measures from DAX queries
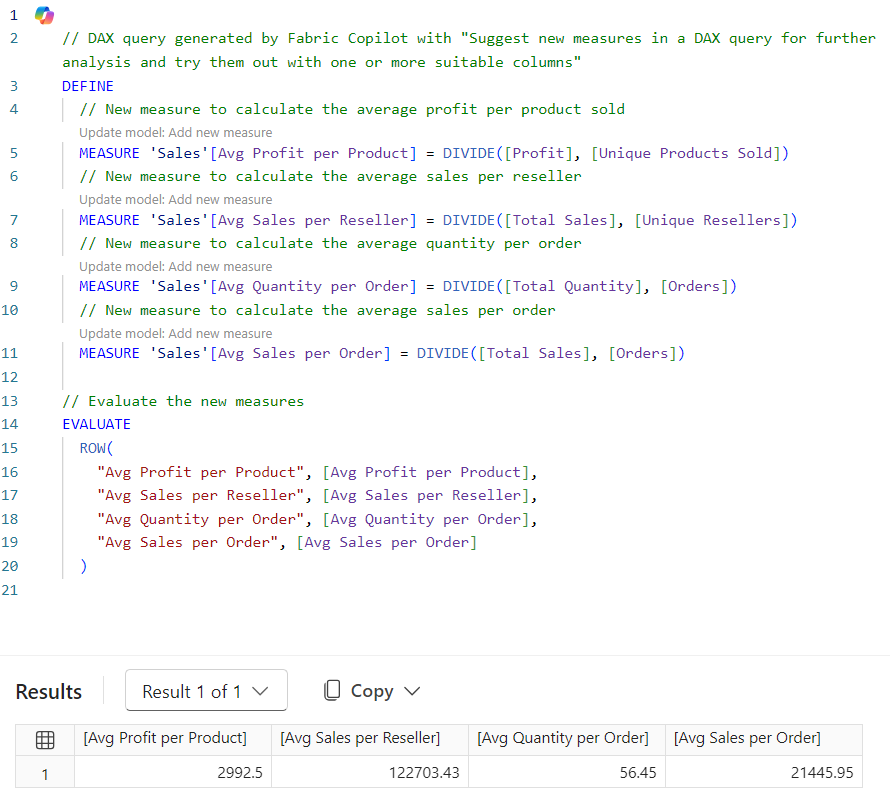
Use Copilot in DAX Query View to explore the data and determine which measures you need to create, and then select Update model with changes to create the measures. The following query was generated from a suggest measures prompt.
// DAX query generated by Fabric Copilot with "Suggest new measures in a DAX query for further analysis and try them out with one or more suitable columns"
DEFINE
  // New measure to calculate the average profit per product sold
  MEASURE 'Sales'[Avg Profit per Product] = DIVIDE([Profit], [Unique Products Sold])
  // New measure to calculate the average sales per reseller
  MEASURE 'Sales'[Avg Sales per Reseller] = DIVIDE([Total Sales], [Unique Resellers])
  // New measure to calculate the average quantity per order
  MEASURE 'Sales'[Avg Quantity per Order] = DIVIDE([Total Quantity], [Orders])
  // New measure to calculate the average sales per order
  MEASURE 'Sales'[Avg Sales per Order] = DIVIDE([Total Sales], [Orders])

// Evaluate the new measures
EVALUATE
  ROW(
    "Avg Profit per Product", [Avg Profit per Product],
    "Avg Sales per Reseller", [Avg Sales per Reseller],
    "Avg Quantity per Order", [Avg Quantity per Order],
    "Avg Sales per Order", [Avg Sales per Order]
  )
And here's the resulting table:
| Avg Profit per Product | Avg Sales per Reseller | Avg Quantity per Order | Avg Sales per Order |
|---|---|---|---|
| 2992.4987 | 122703.4339 | 56.44745575221239 | 21445.9541 |
The following screenshot is the result of three simple steps:
- Enter the suggest measures prompt.
- Select Keep query after results return.
- Run the query.
As a report developer, you can Update model with changes to create the measures best suited to your project.

Summary
Copilot allows you to explore and design semantic models more efficiently, expanding your data analysis skills and making you a better report developer.