Exercise - application performance monitoring
In this exercise, with zero configuration, you'll effortlessly monitor data flows for your sample application.
Monitor the Application with Azure Application Insights
Application Map helps you spot performance bottlenecks or failure hot spots across all components of your distributed application.
Open the Azure portal.
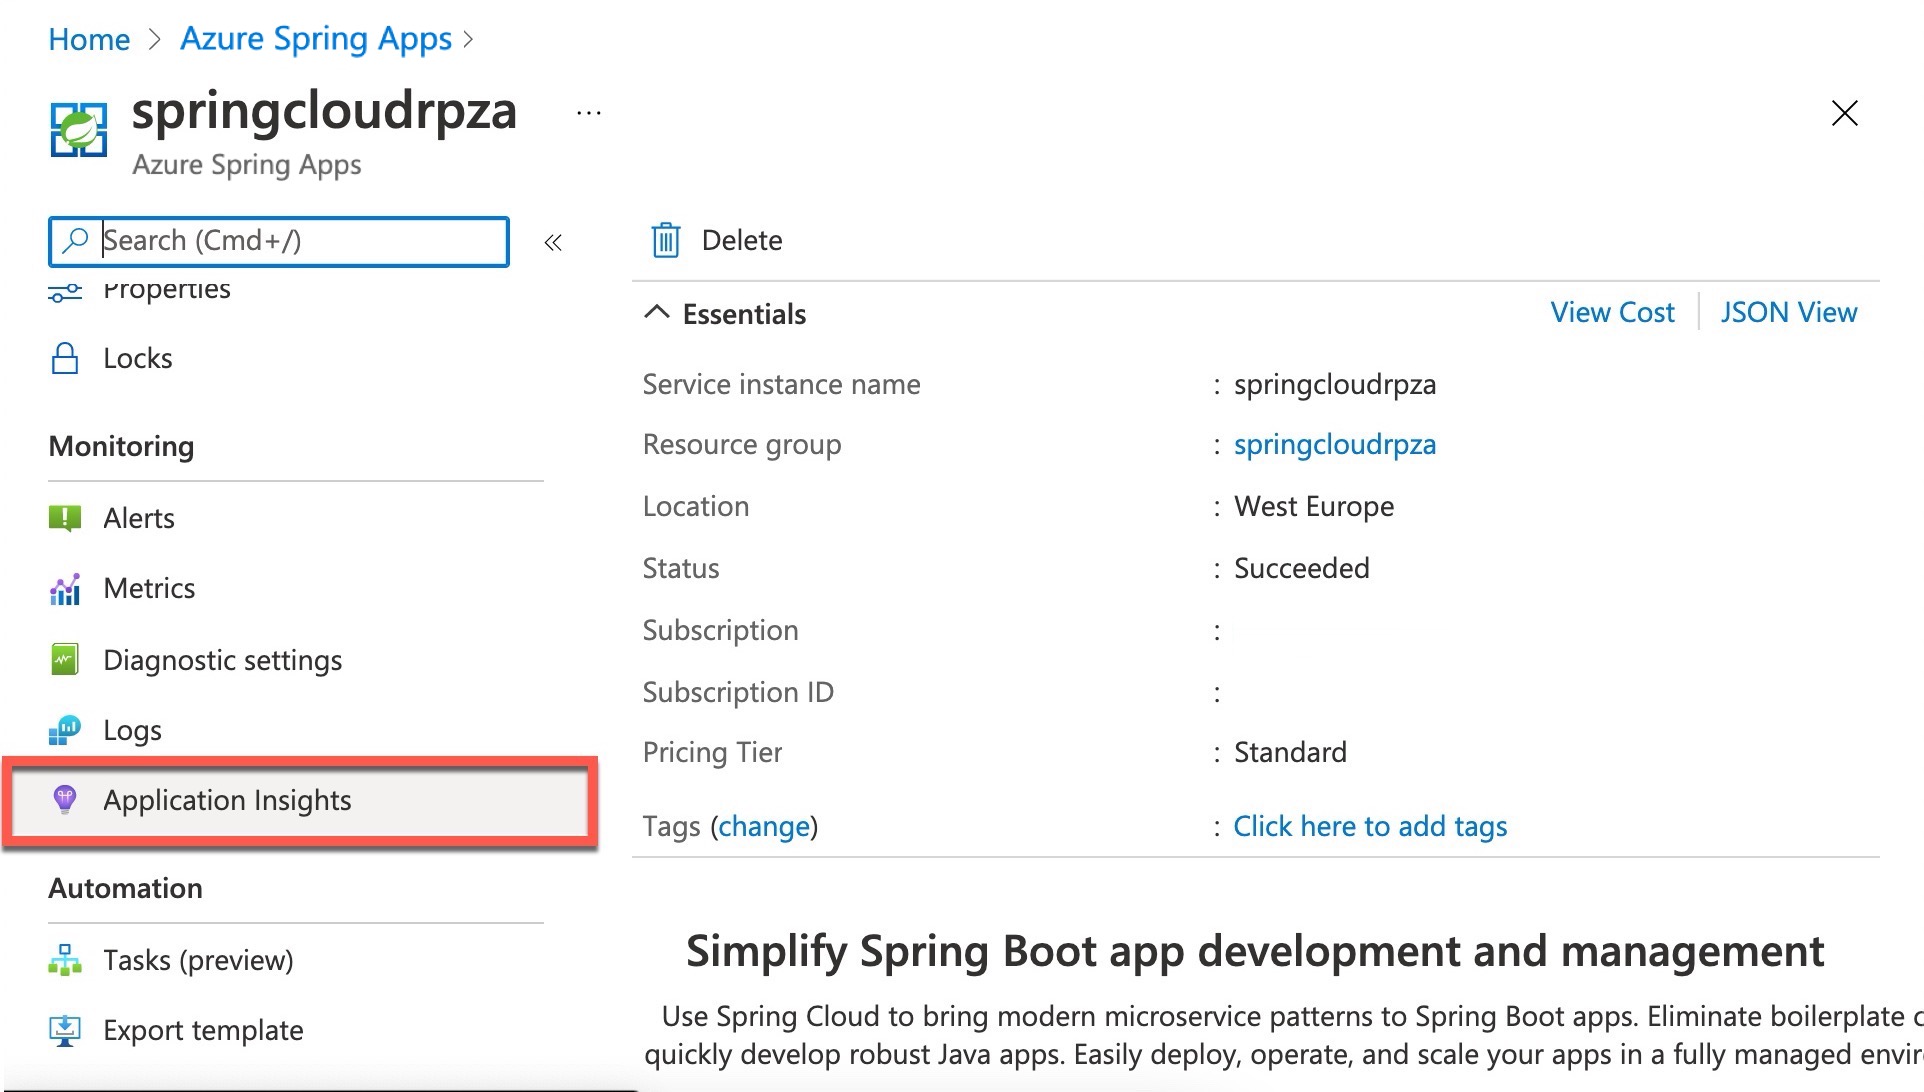
Select Azure Spring Apps from the list of Azure services.
Select your Azure Spring Apps instance.
Select Application Insights to go to the overview page of Application Insights.
On the left, navigate to Application map, where you can see a view of your Azure Spring Apps microservices:

The Application map shows applications that are operating correctly (green) and those applications with bottlenecks (red).
In the preceding Application map, each name in a green box is a different service of your Azure Spring Apps.
You can easily identify issues in your applications and quickly troubleshoot and fix them. Each node on the map represents a microservice or its dependencies, with health KPI and alerts status. You can select from any component to more detailed diagnostics, such as Application Insights events.
Performance
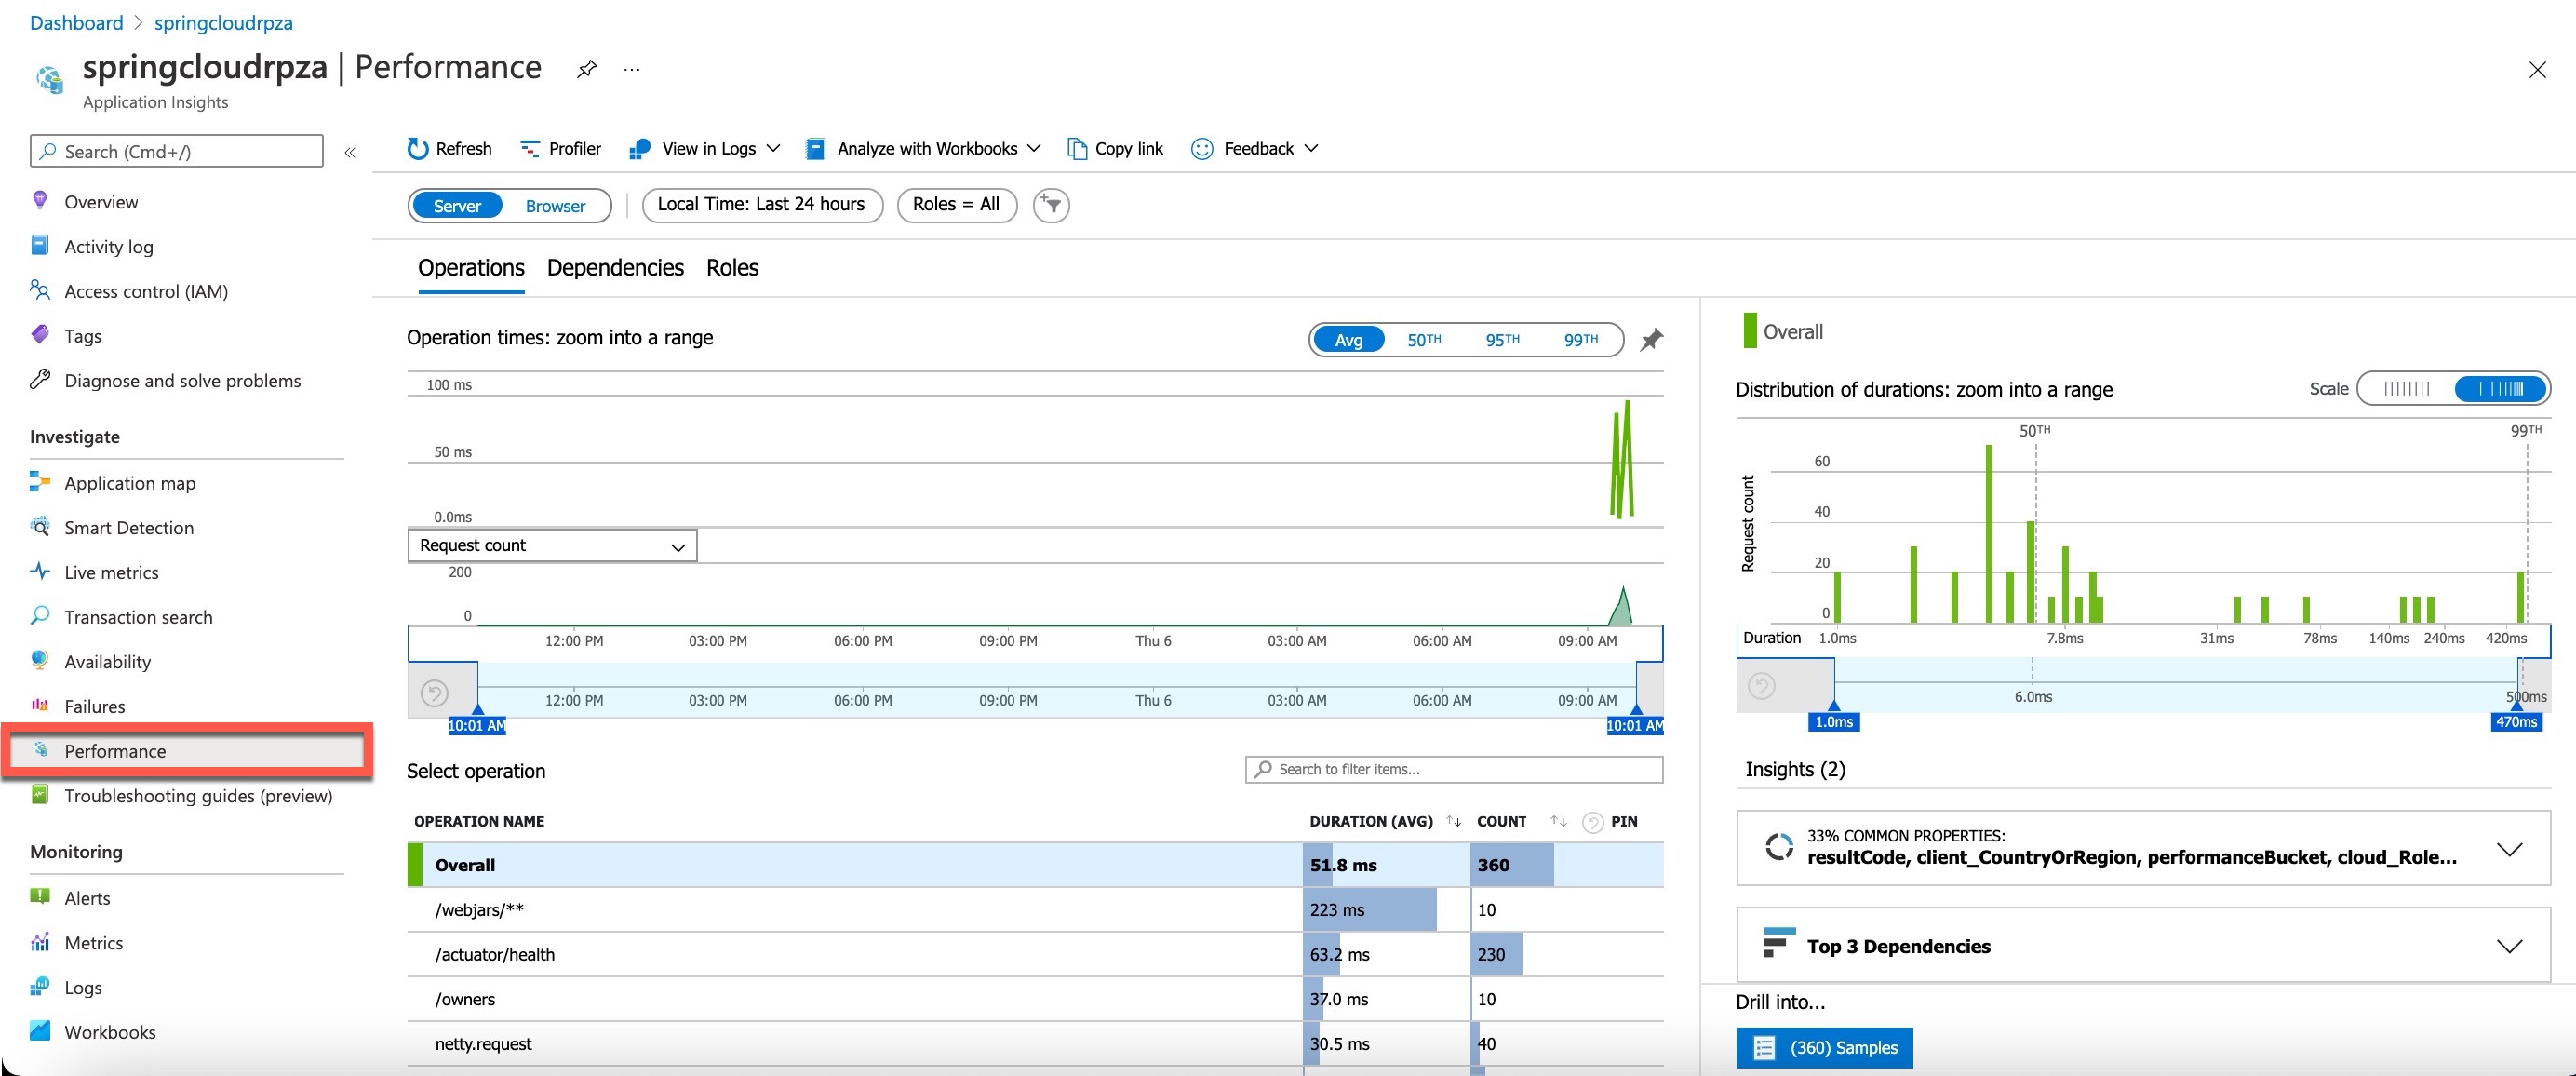
On the left, navigate to Performance, where you can see response times and request counts for operations exposed by your applications.
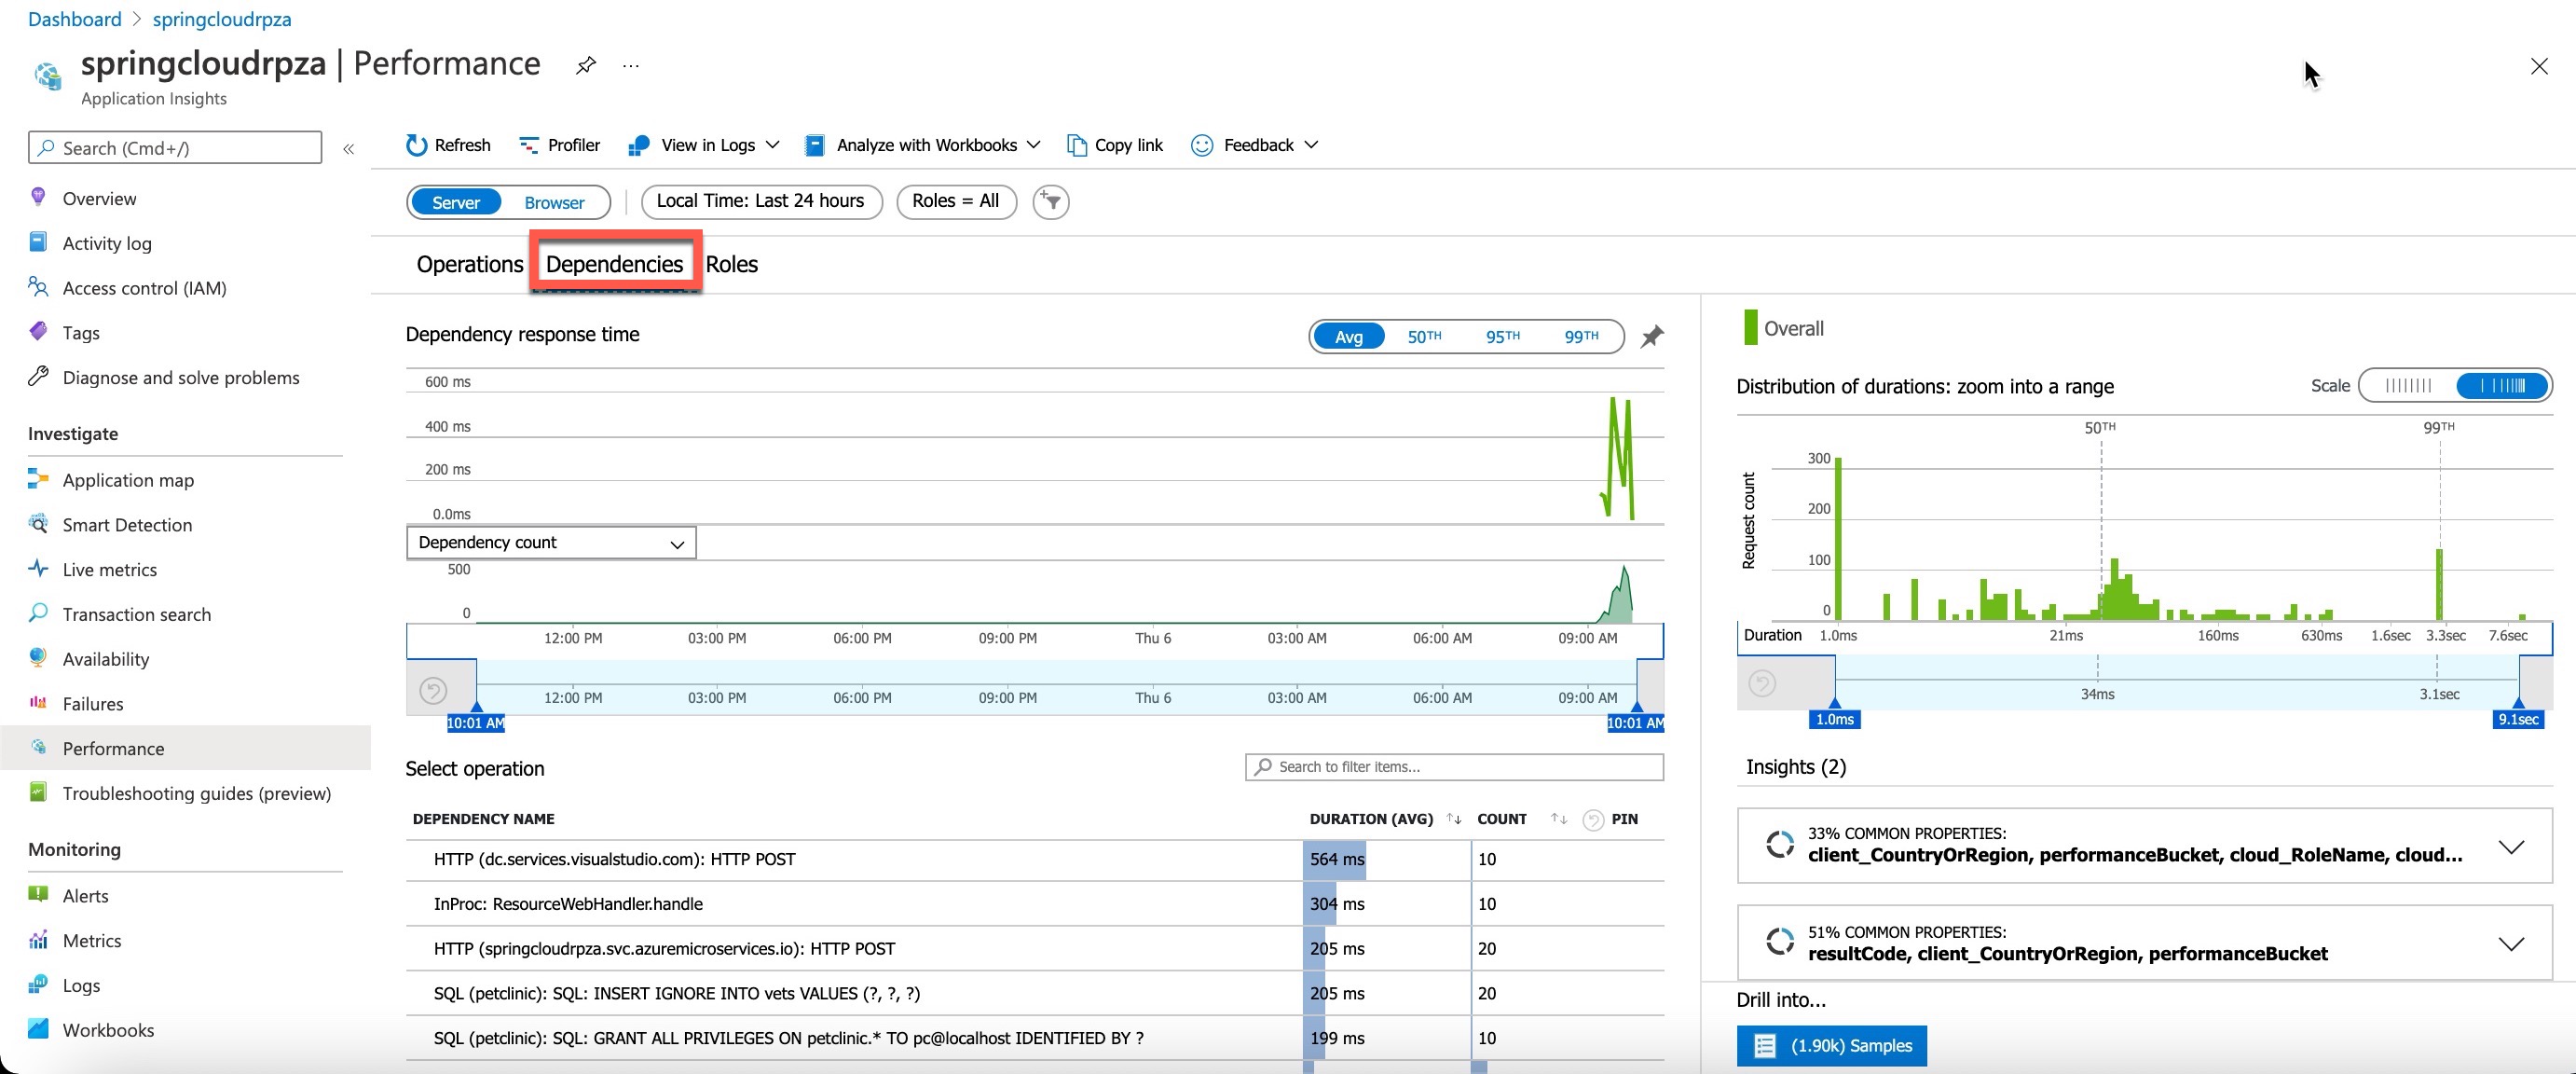
Next, on the right, navigate to Dependencies, where you can see all your dependencies and their response times and request counts.
You can see the performance number for dependencies, particularly SQL calls:
Select a SQL statement in the Select operation tab to see the transaction in context:
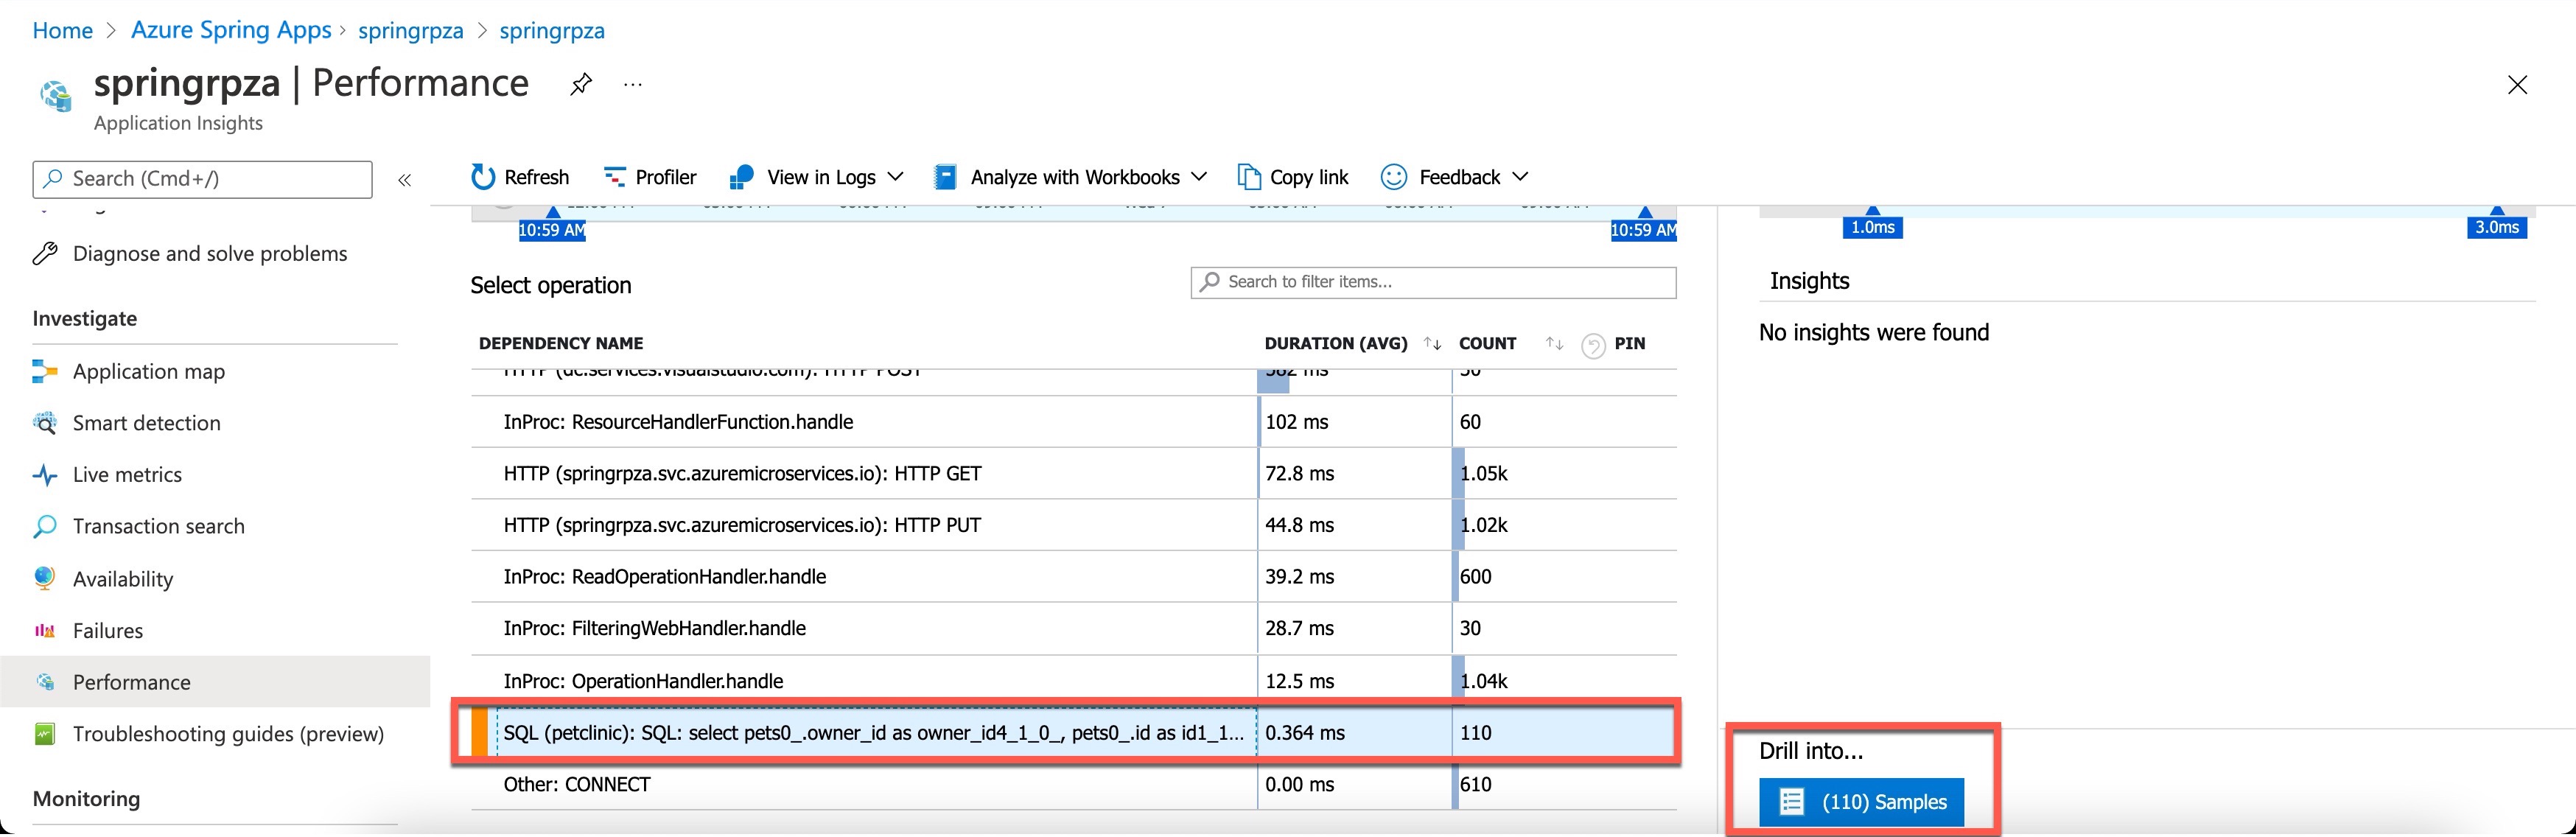
Next, on the right tab, select Drill into, and on the far right tab, select a SQL sample to open the transaction detail window:
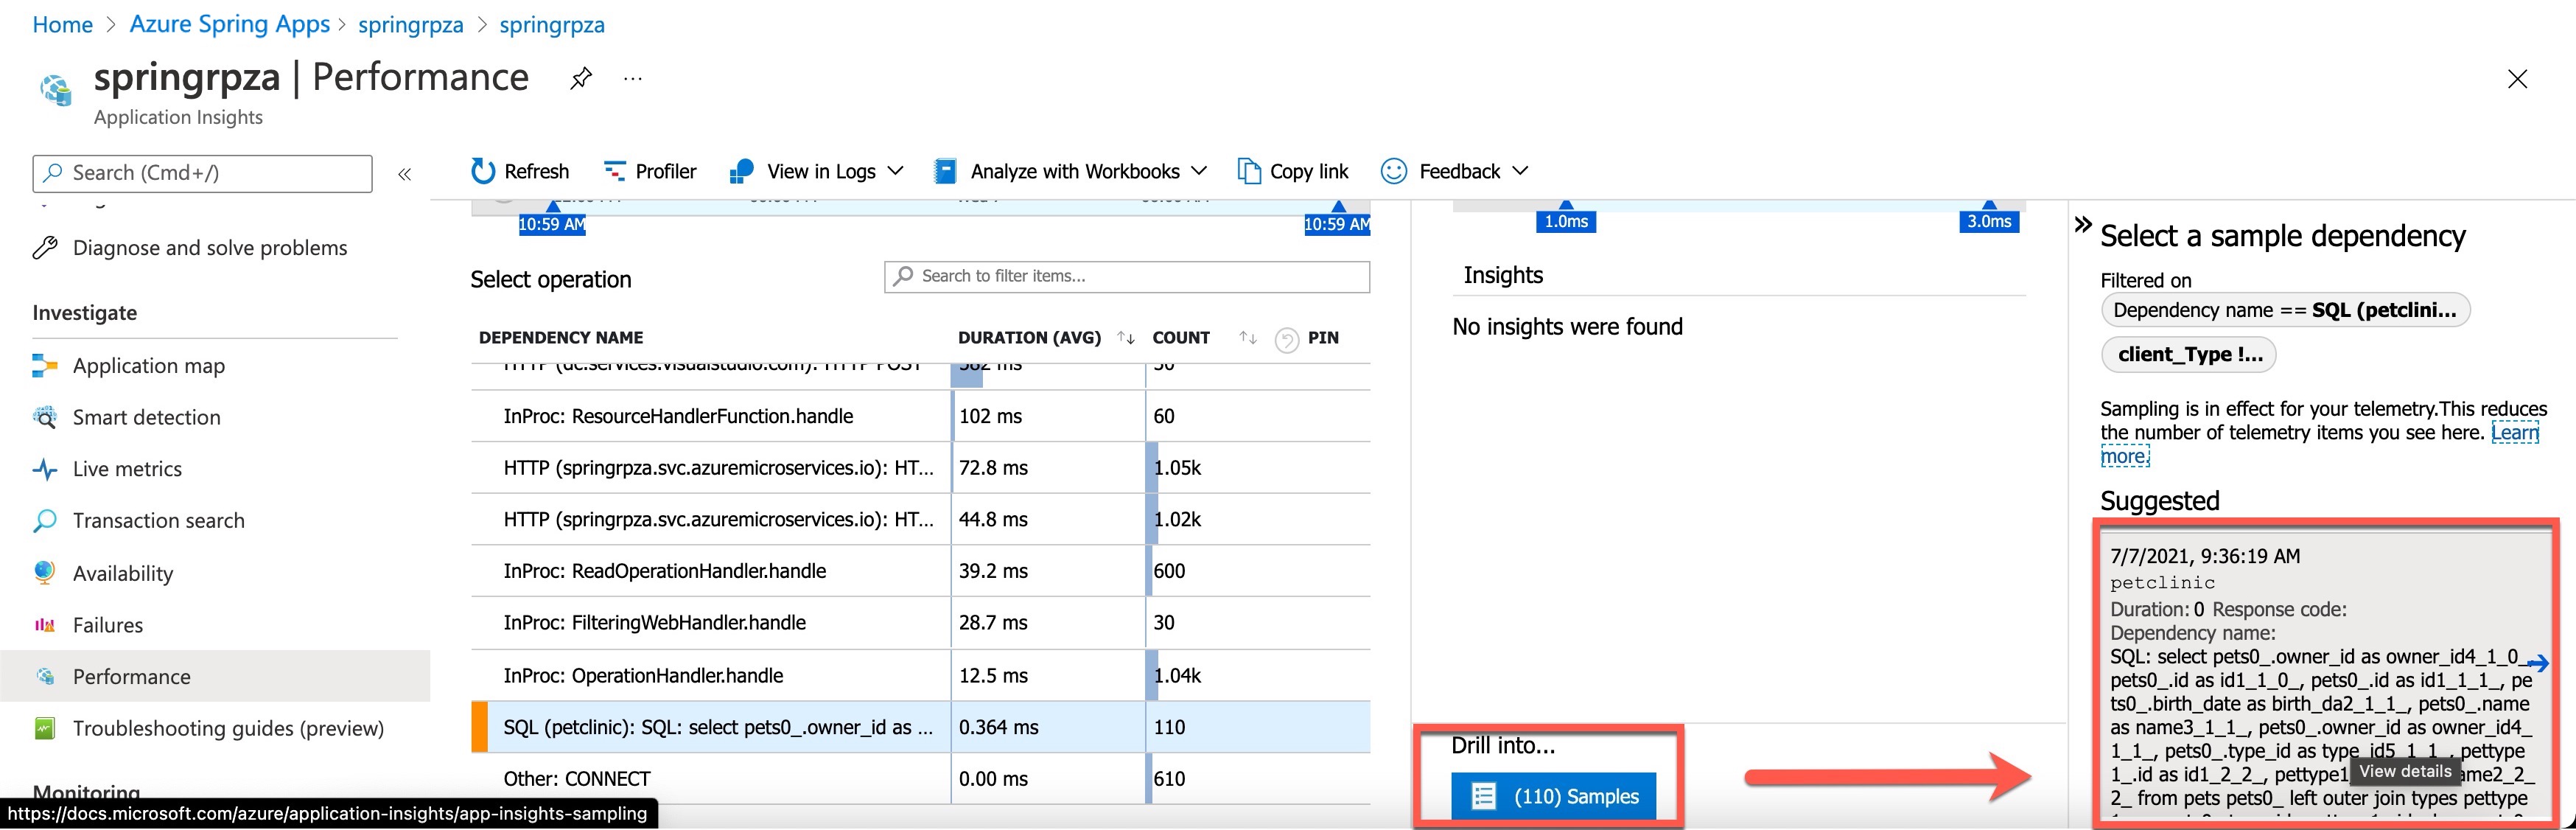
Finally, in the End-to-end transaction details view, view the sample SQL statement transaction by selecting the SQL statement:


Failures/Exceptions
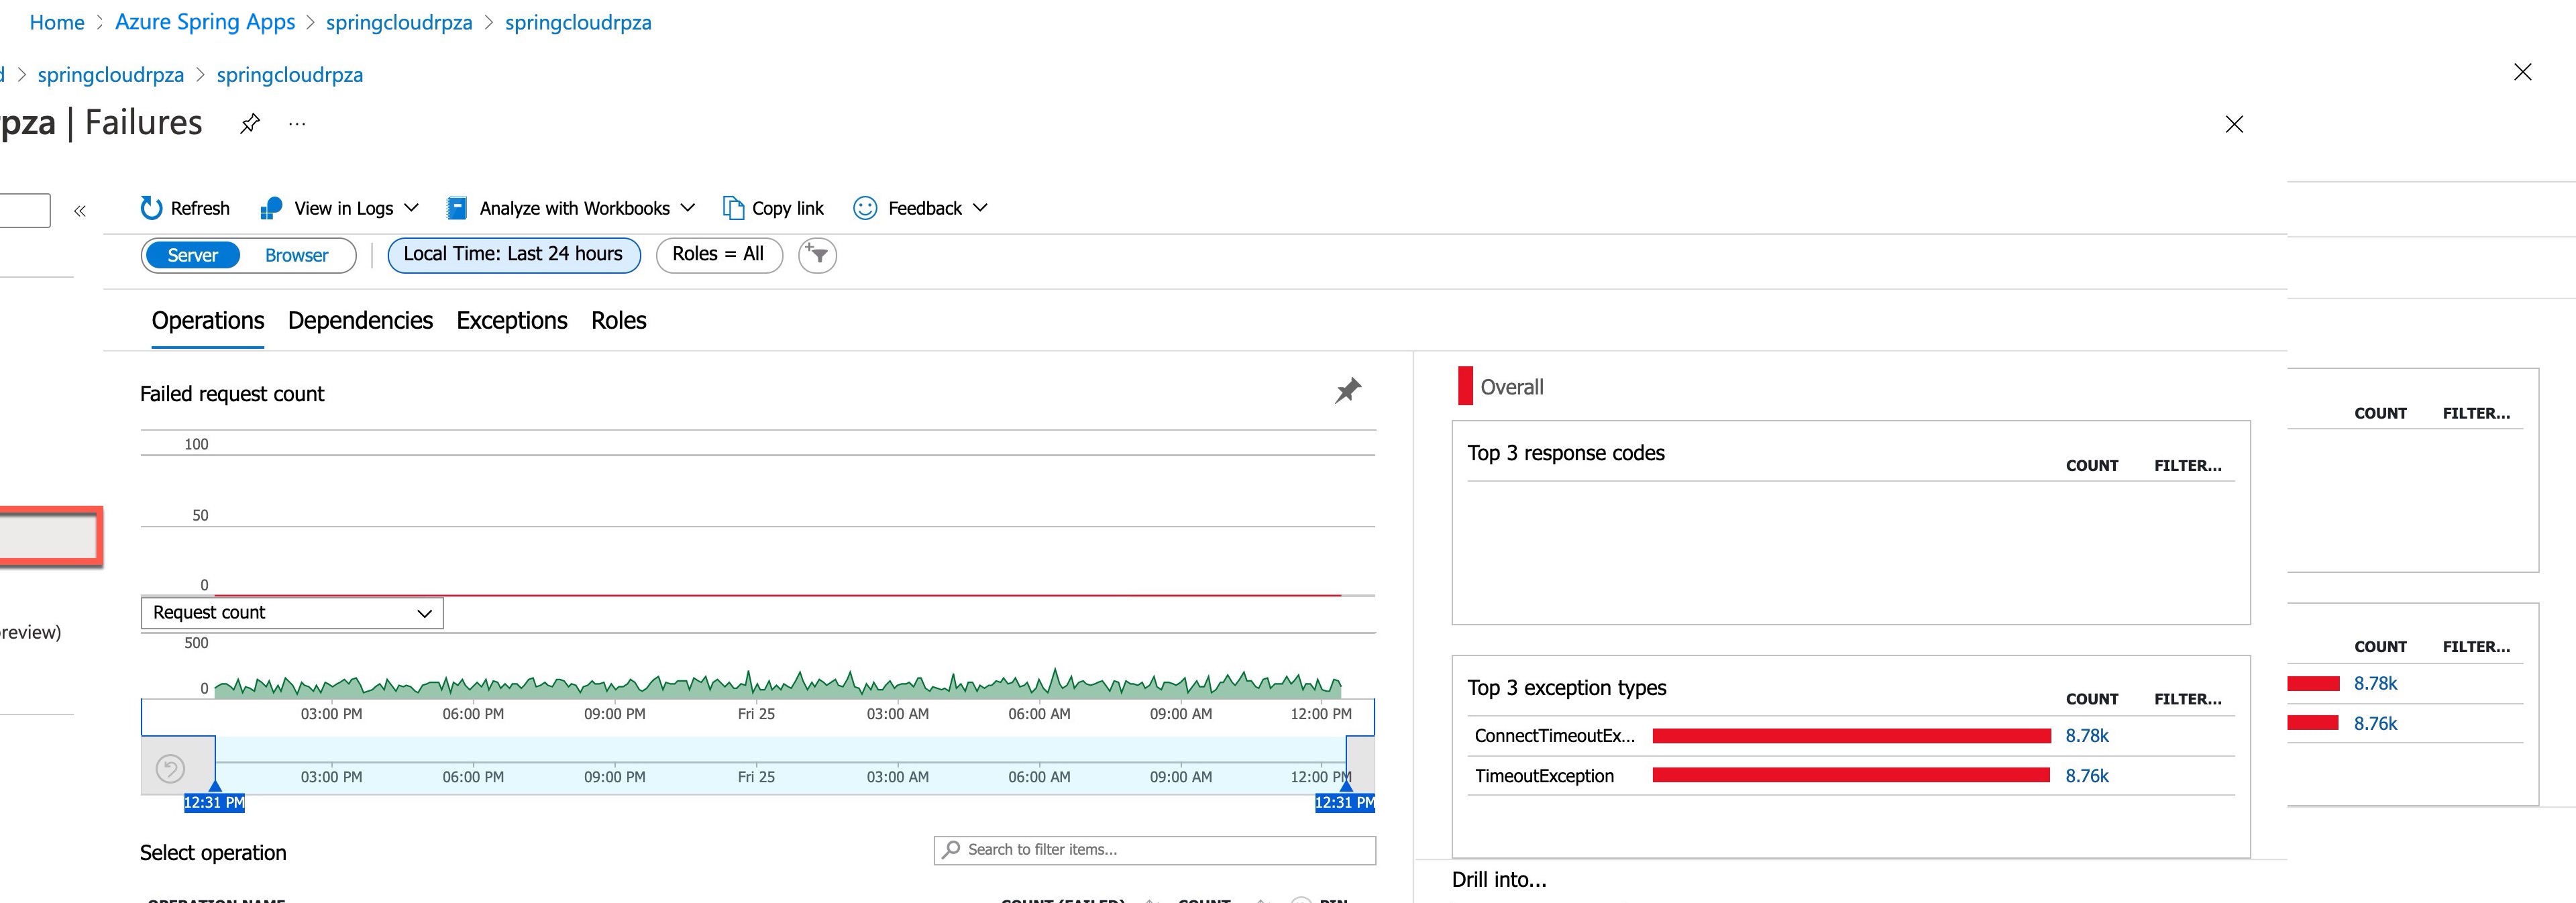
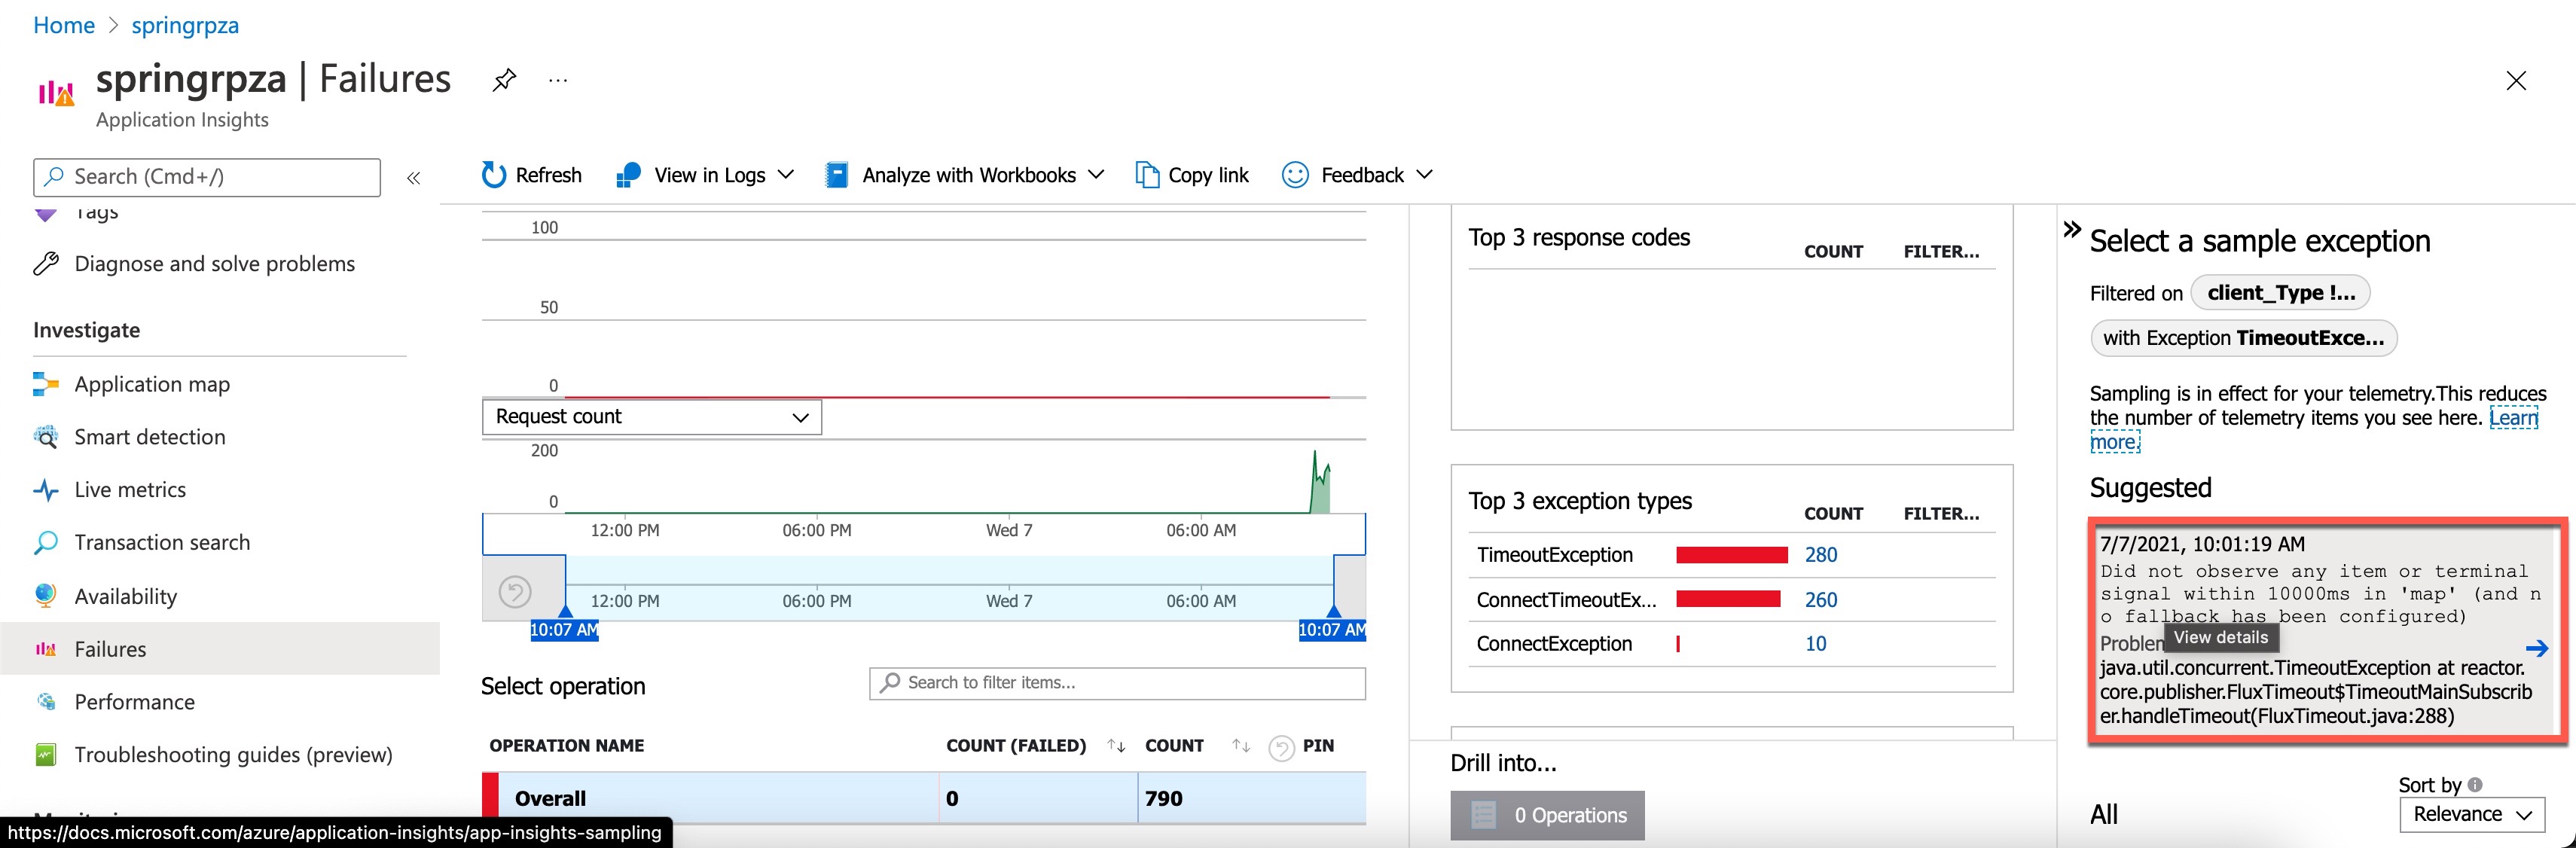
Select Failures in the Application Insights resource menu, which is located in the Investigate section. In this view, you'll see top three failure response codes, top three exception types, and top three failing dependency types.
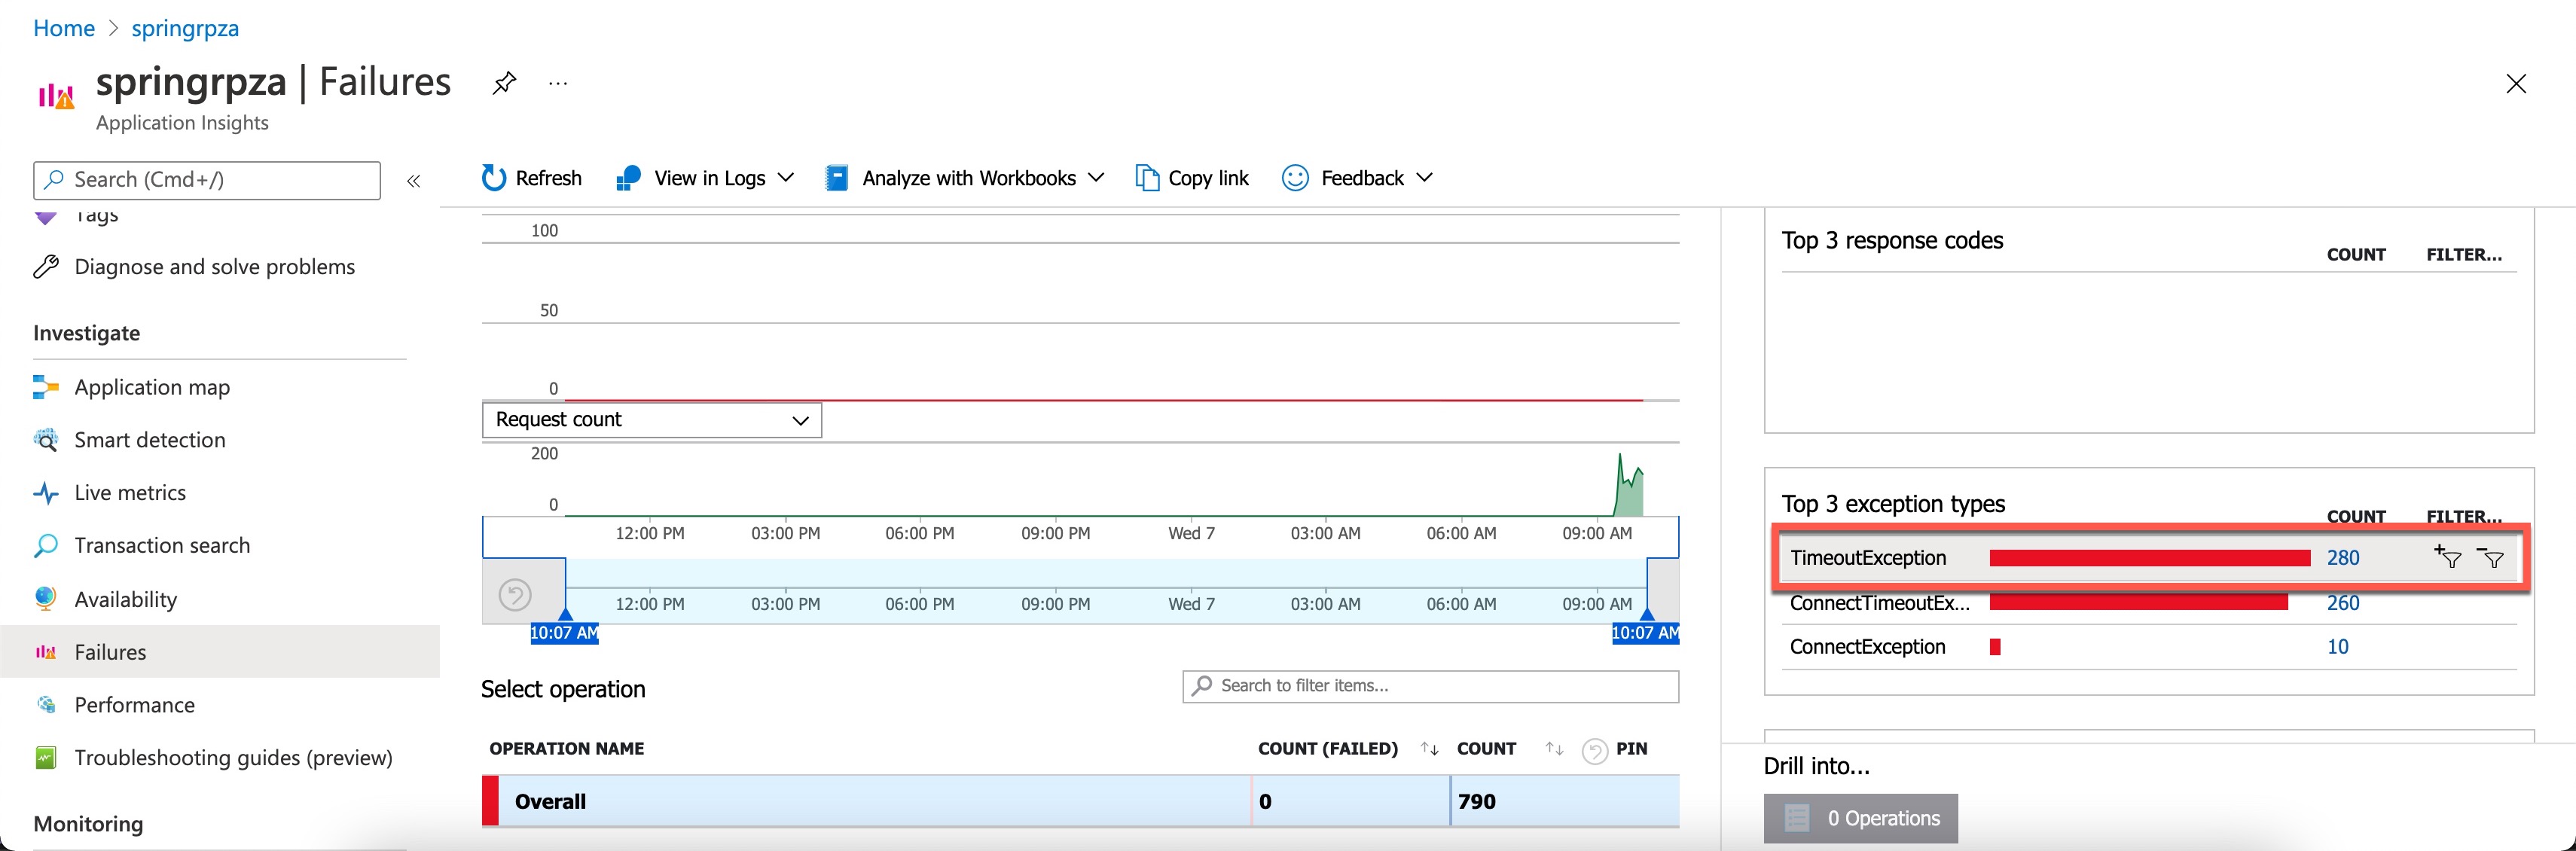
On the right-hand side, select an exception in the Top 3 exception types for meaningful insights and actionable stack trace:
Next, on the right tab, select the Suggested exception sample to open the transaction detail window:
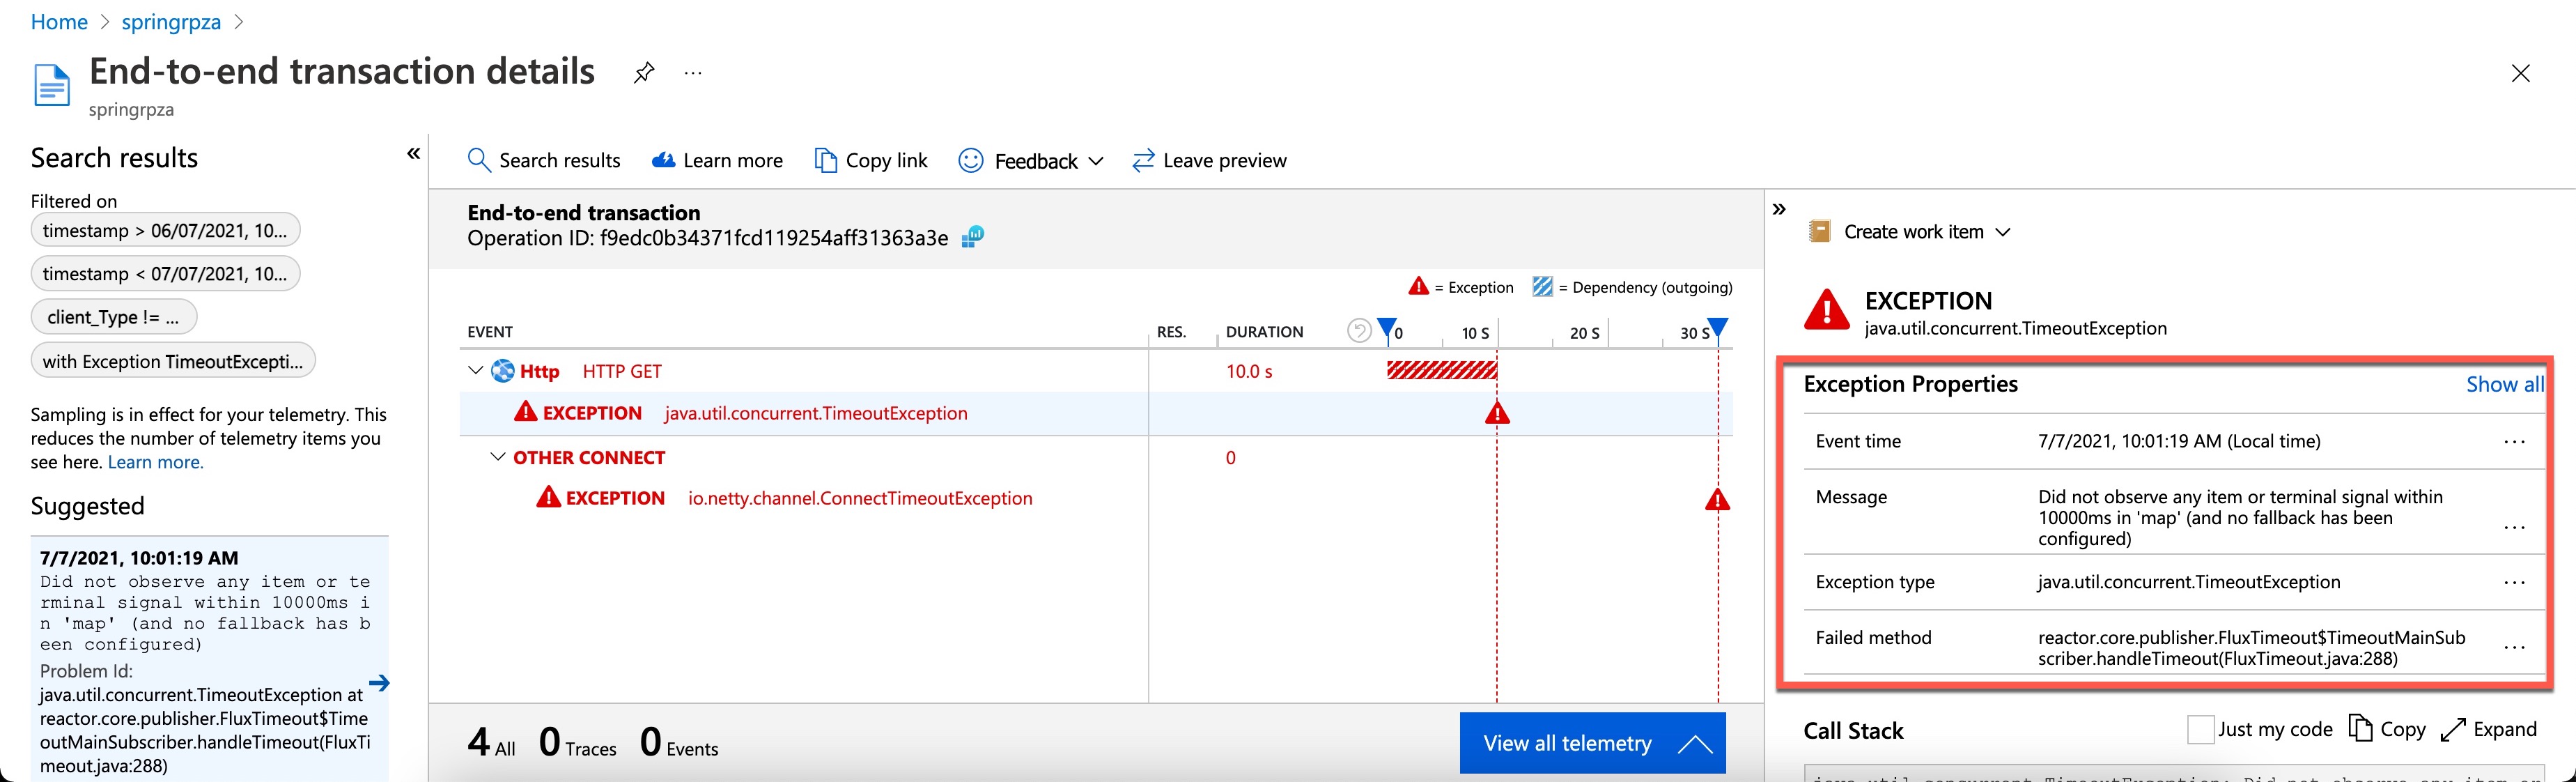
Next, view the exception properties in the End-to-end transaction details window:
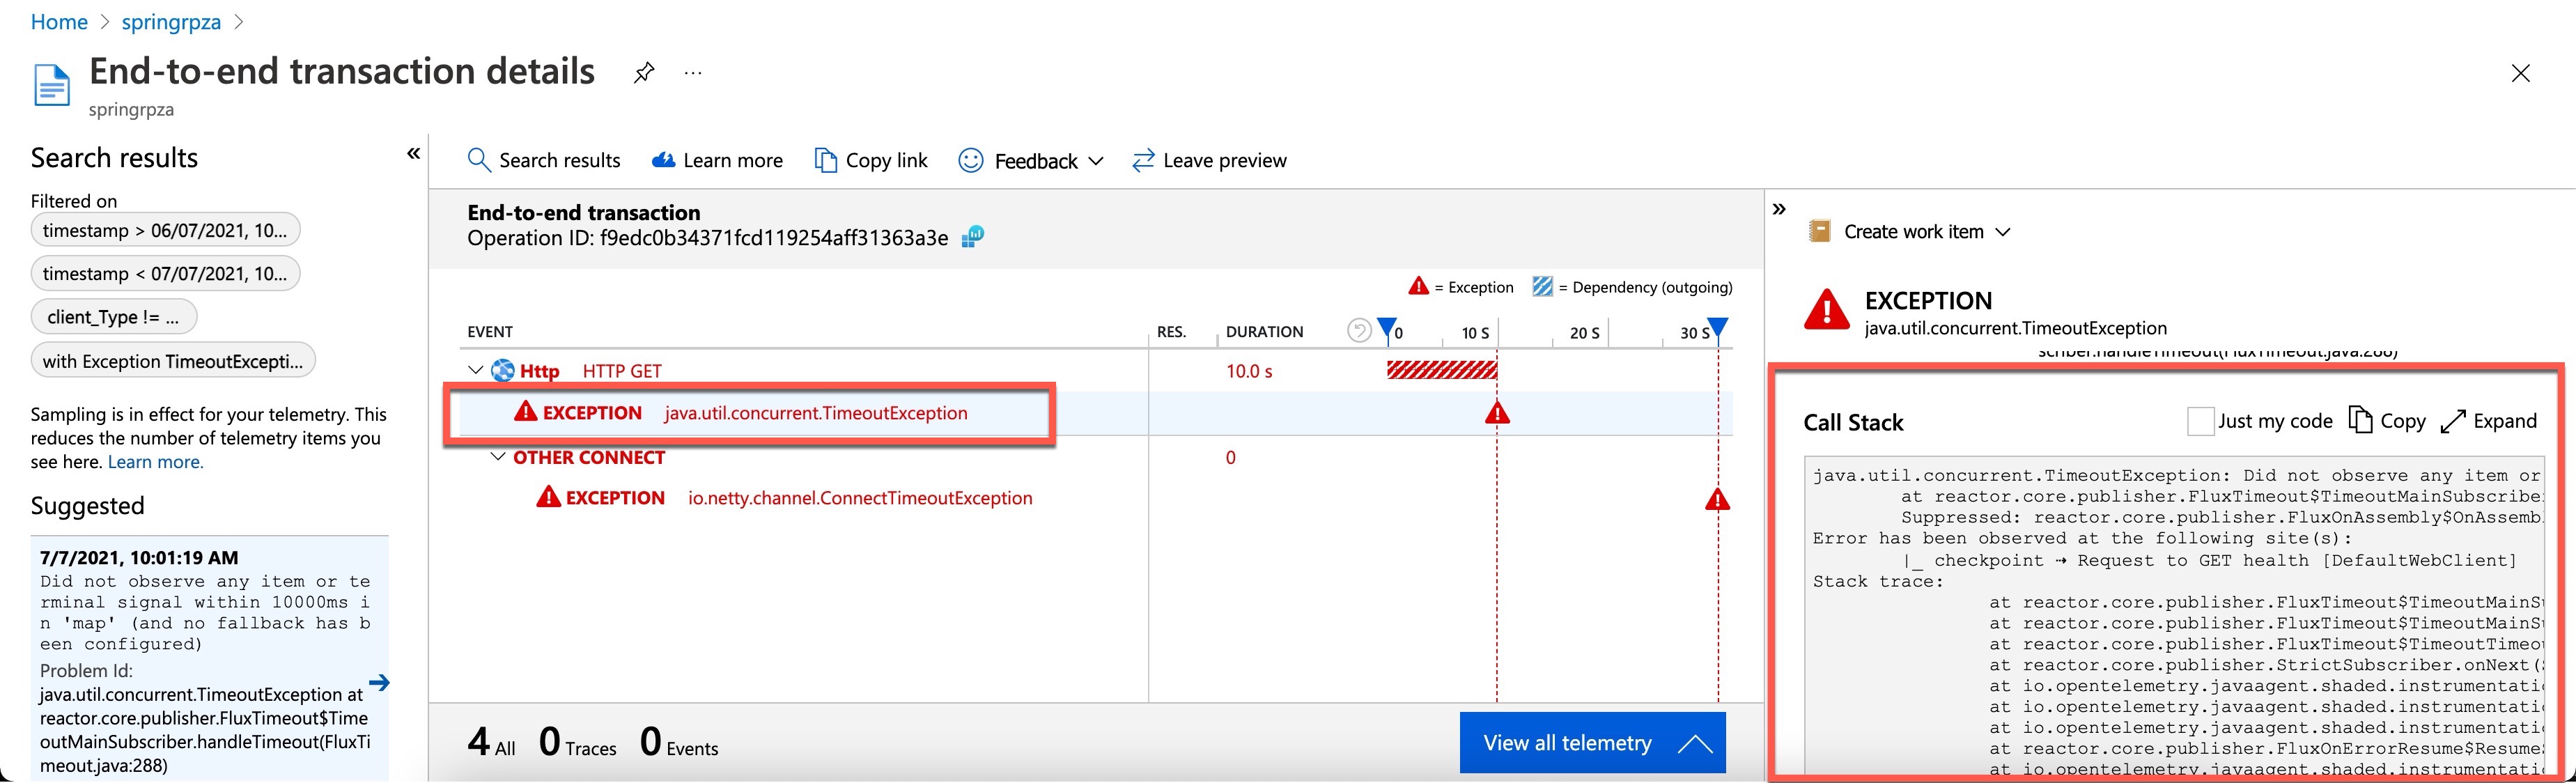
Finally, in the middle of the screen, in the End-to-end transaction tab, select an exception to view its details and stacktrace:


Metrics
Spring Boot registers many core metrics: JVM, CPU, Tomcat, Logback, and so on. You can see metrics contributed by Spring Boot apps, Spring Apps modules, and dependencies.
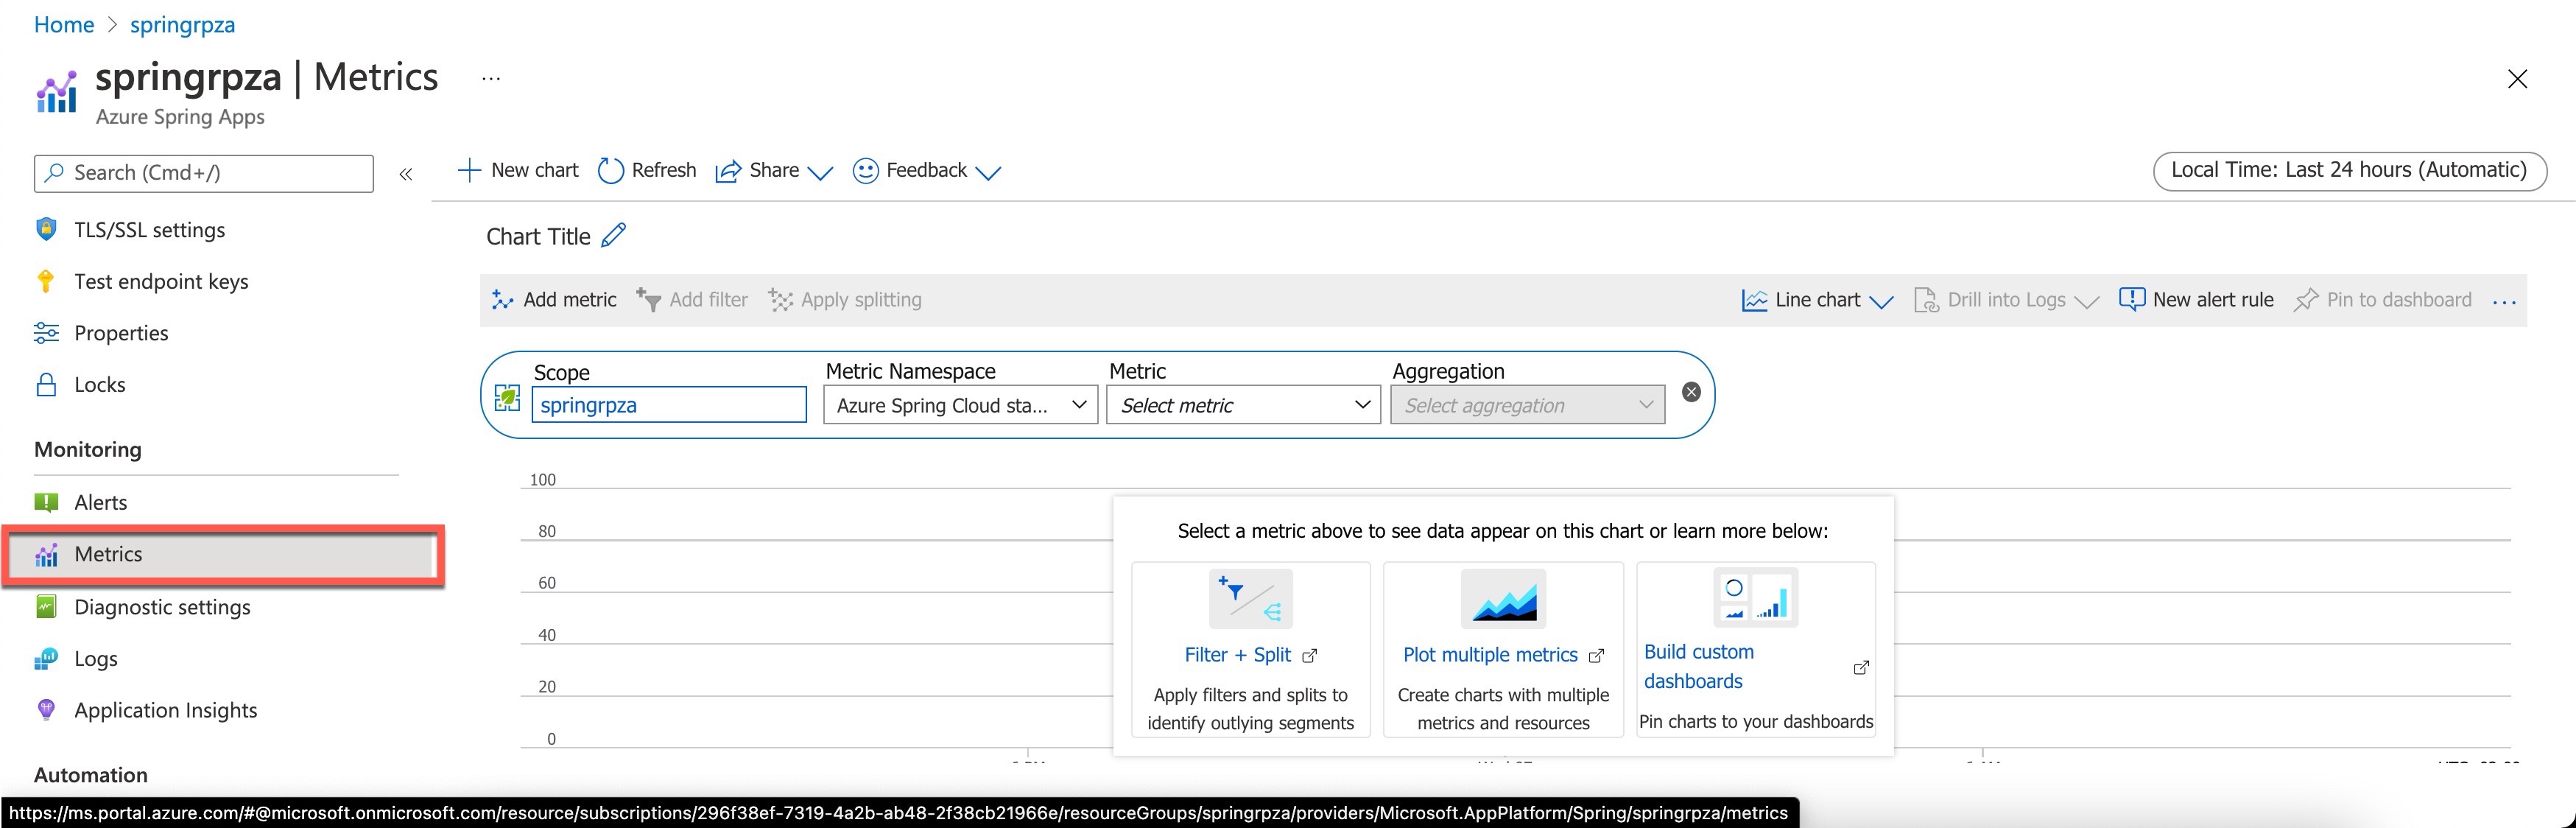
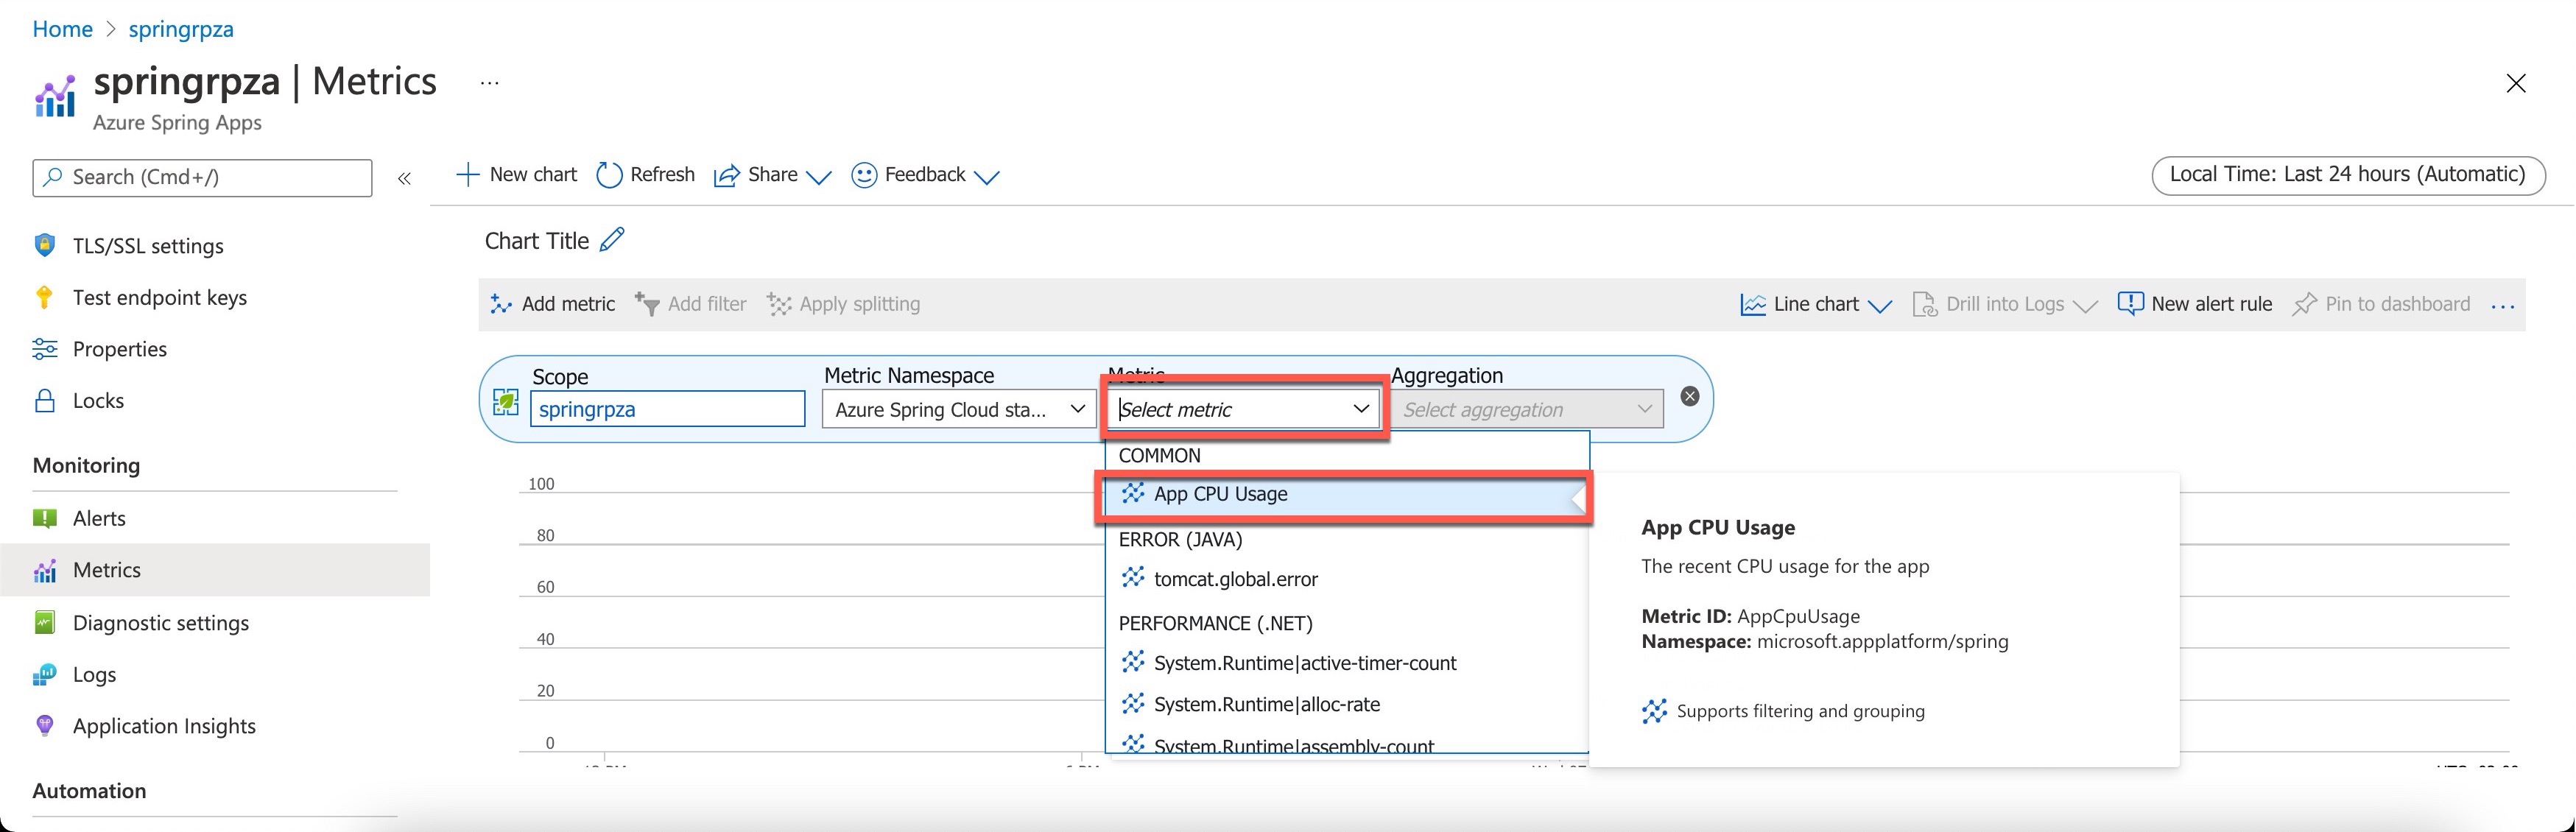
To create a standard metric chart, under the Monitoring section, open the Metrics tab and follow these steps:
Ensure your Azure Spring Apps is selected under Scope and Azure Spring Apps under Metric Namespace. Both will already be populated if you opened the metrics explorer from the resource's menu.
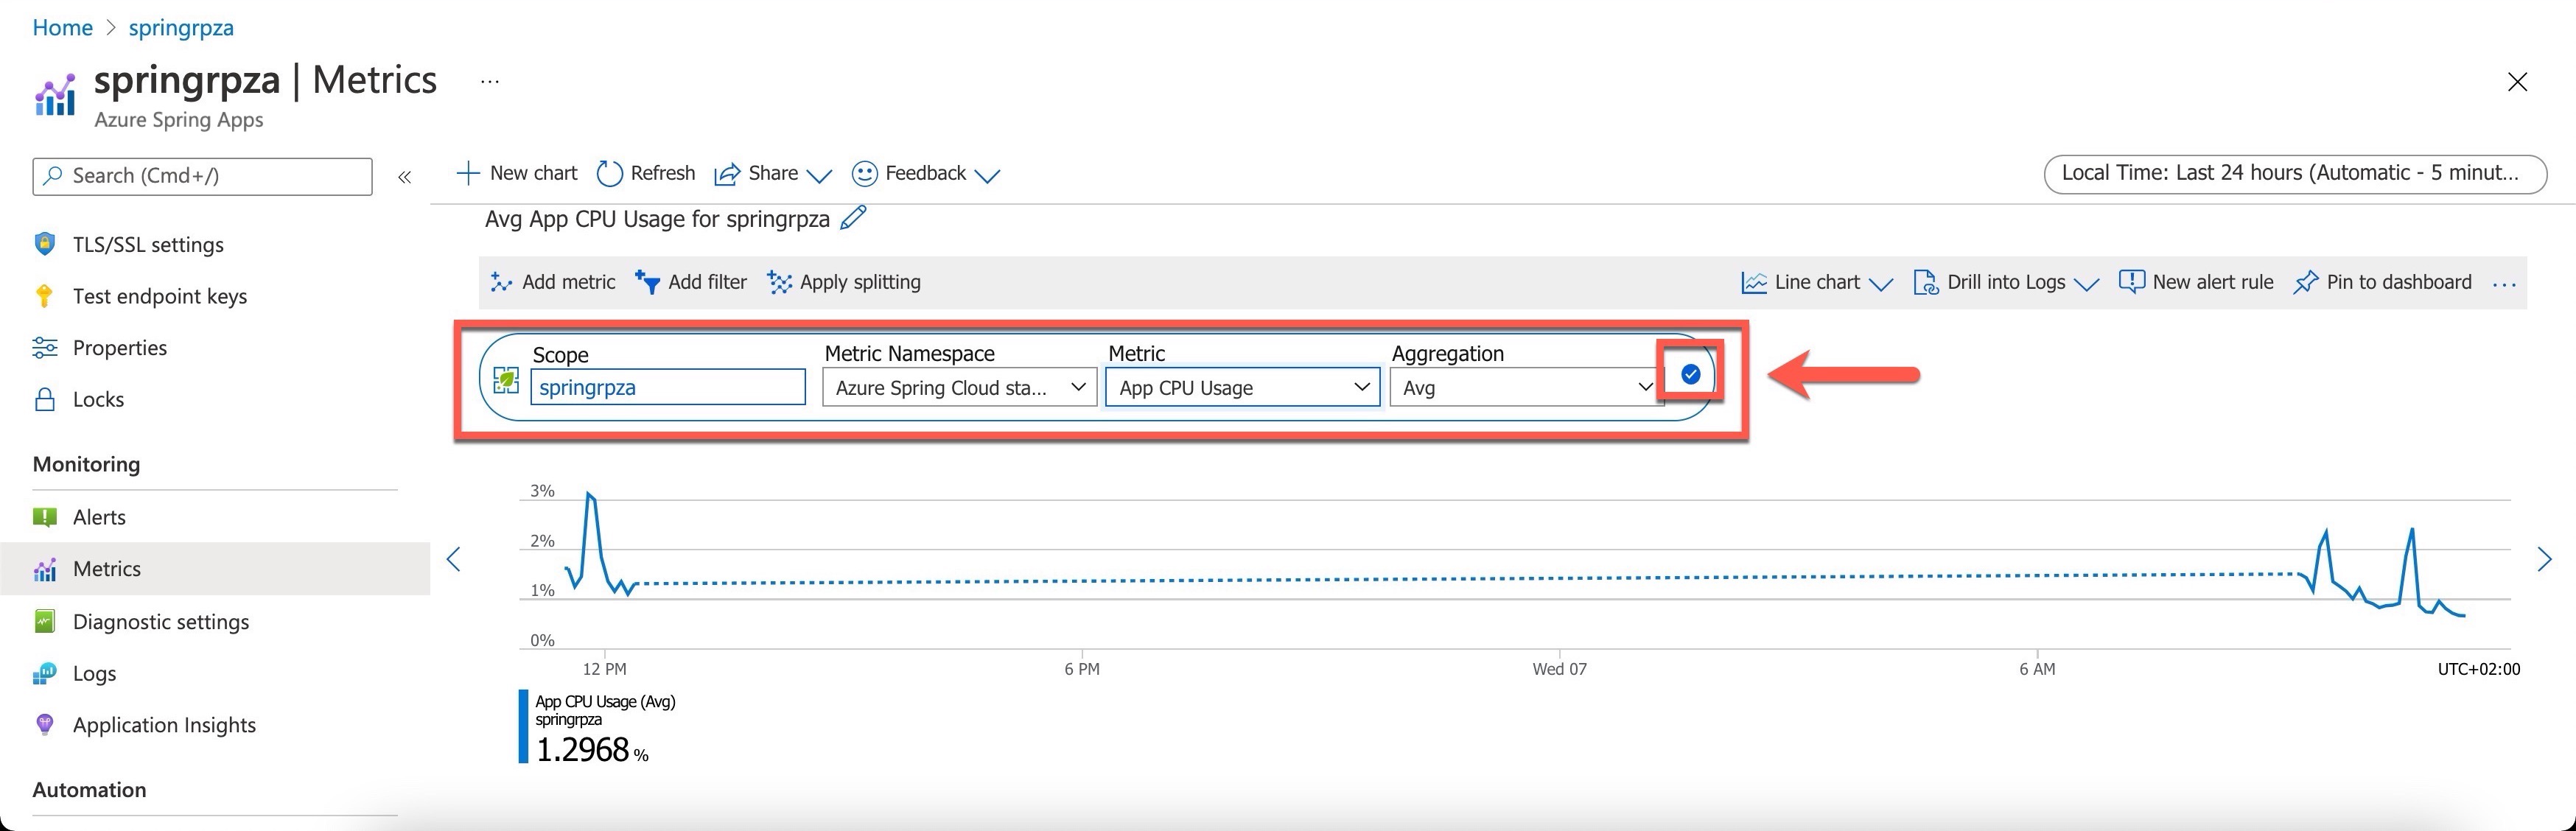
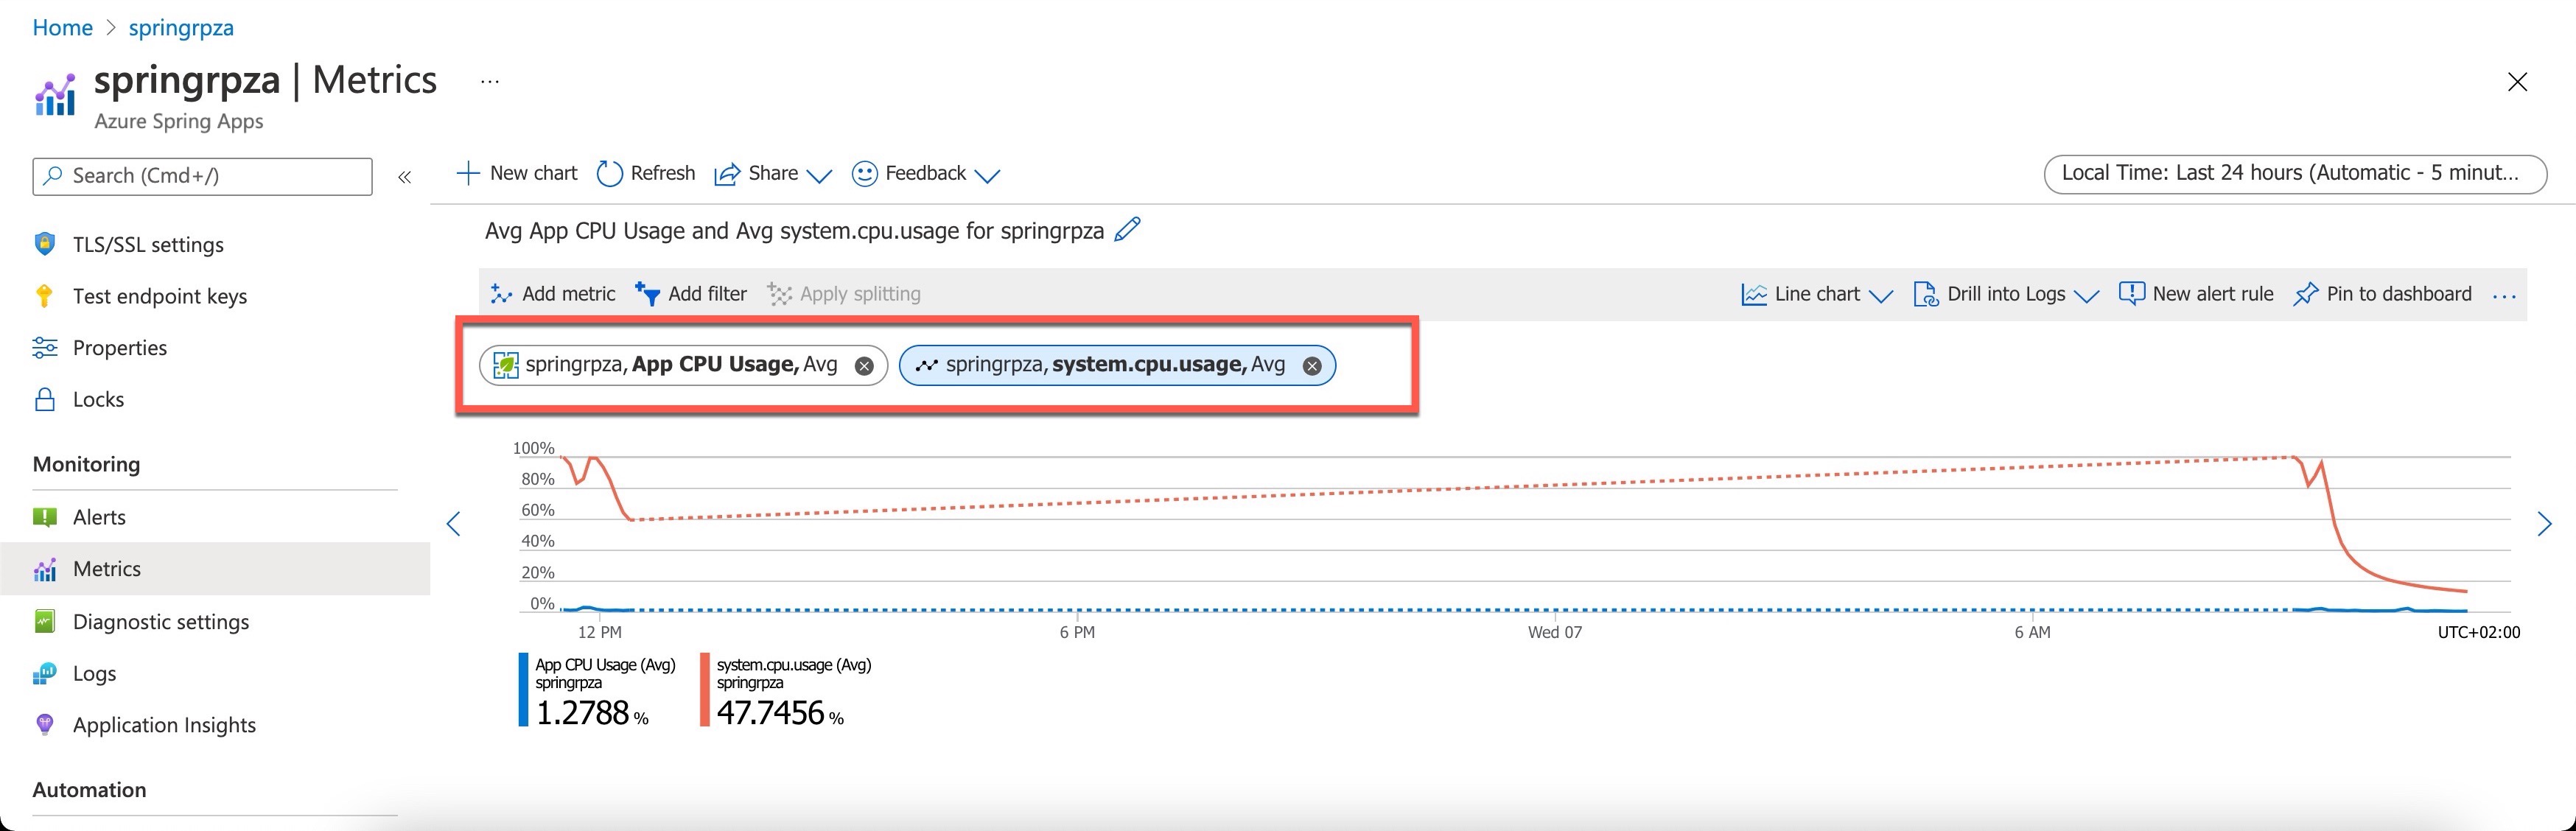
Next, under Metrics, select App CPU Usage and select Avg under Aggregation:
Save the first metric by selecting the Tick icon on the right-hand metric bar.
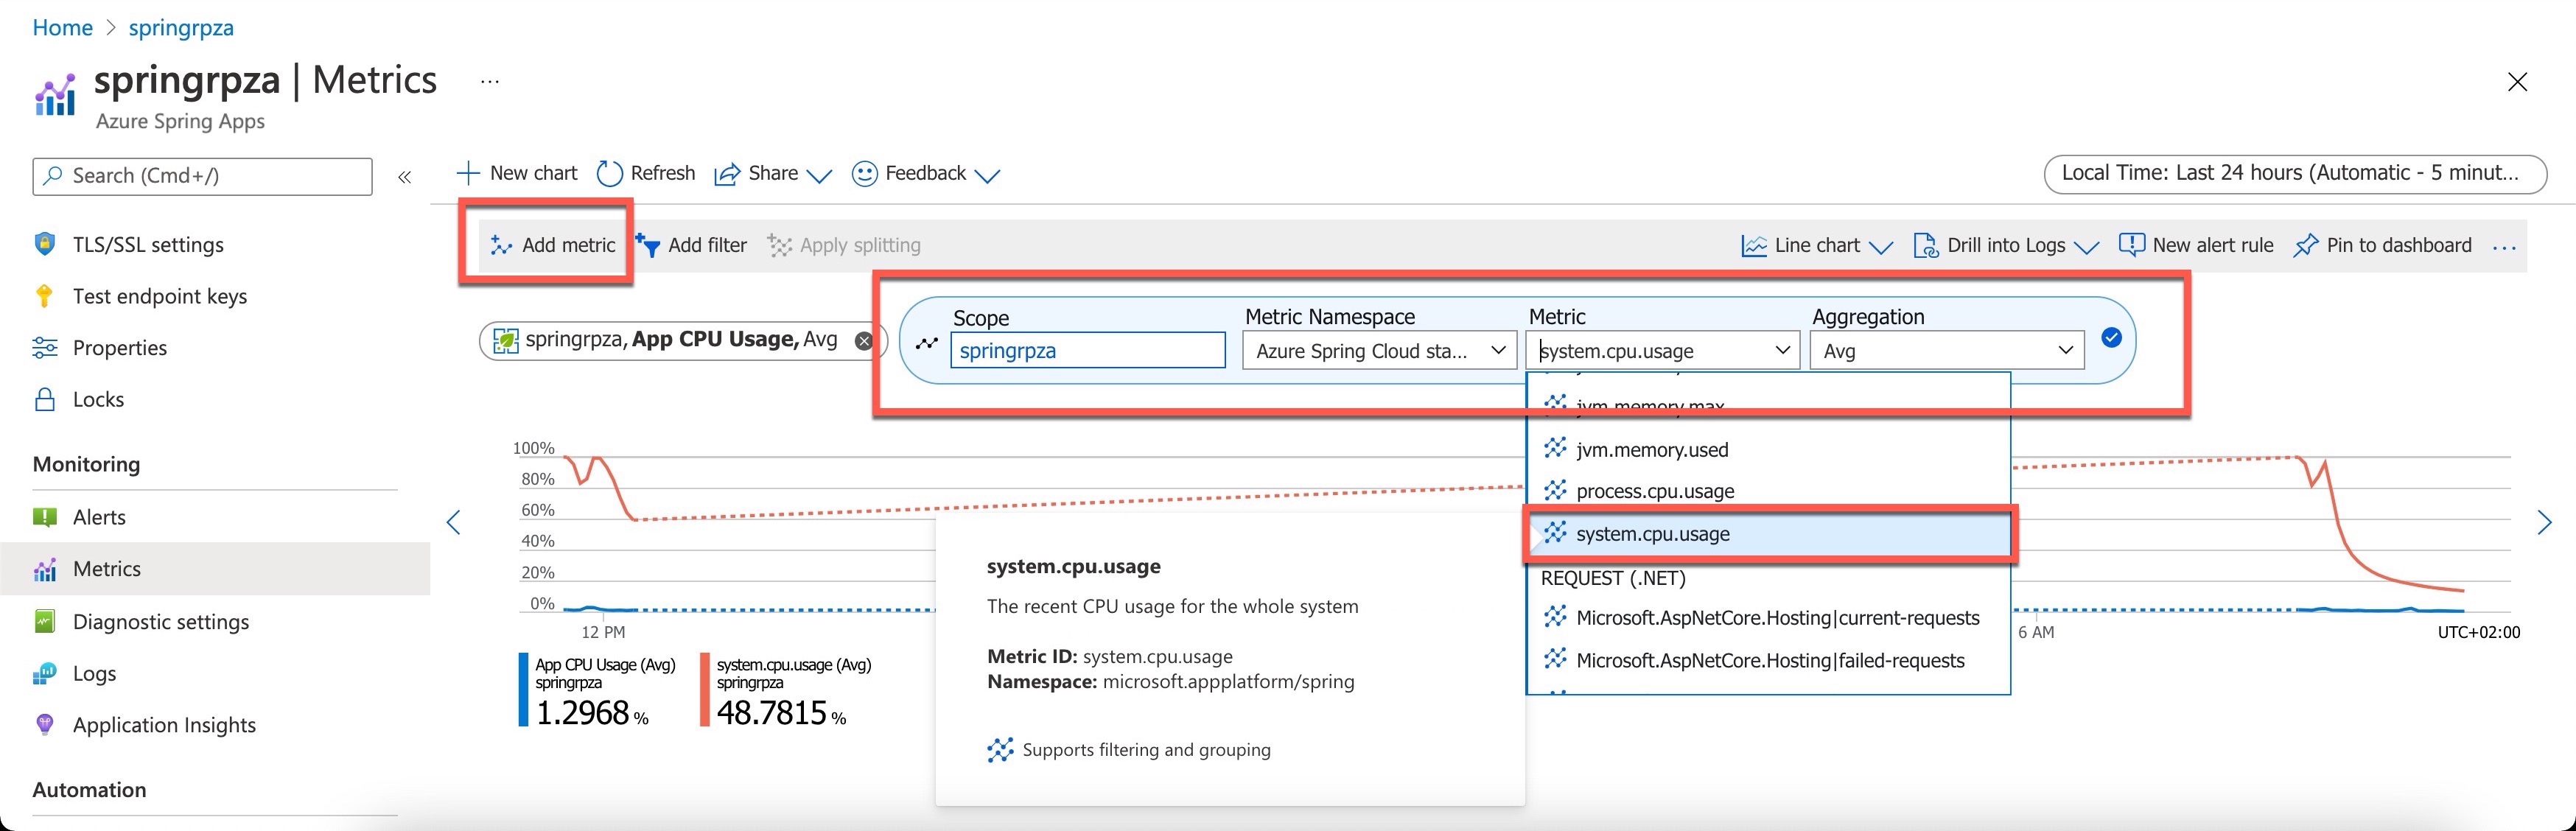
Next, add another metric by selecting the Add metric action on the top left-hand toolbar and add system.cpu.usage under Metric and Avg under Aggregation.
Next, save the second metric by selecting the Tick icon on the right-hand metric bar.
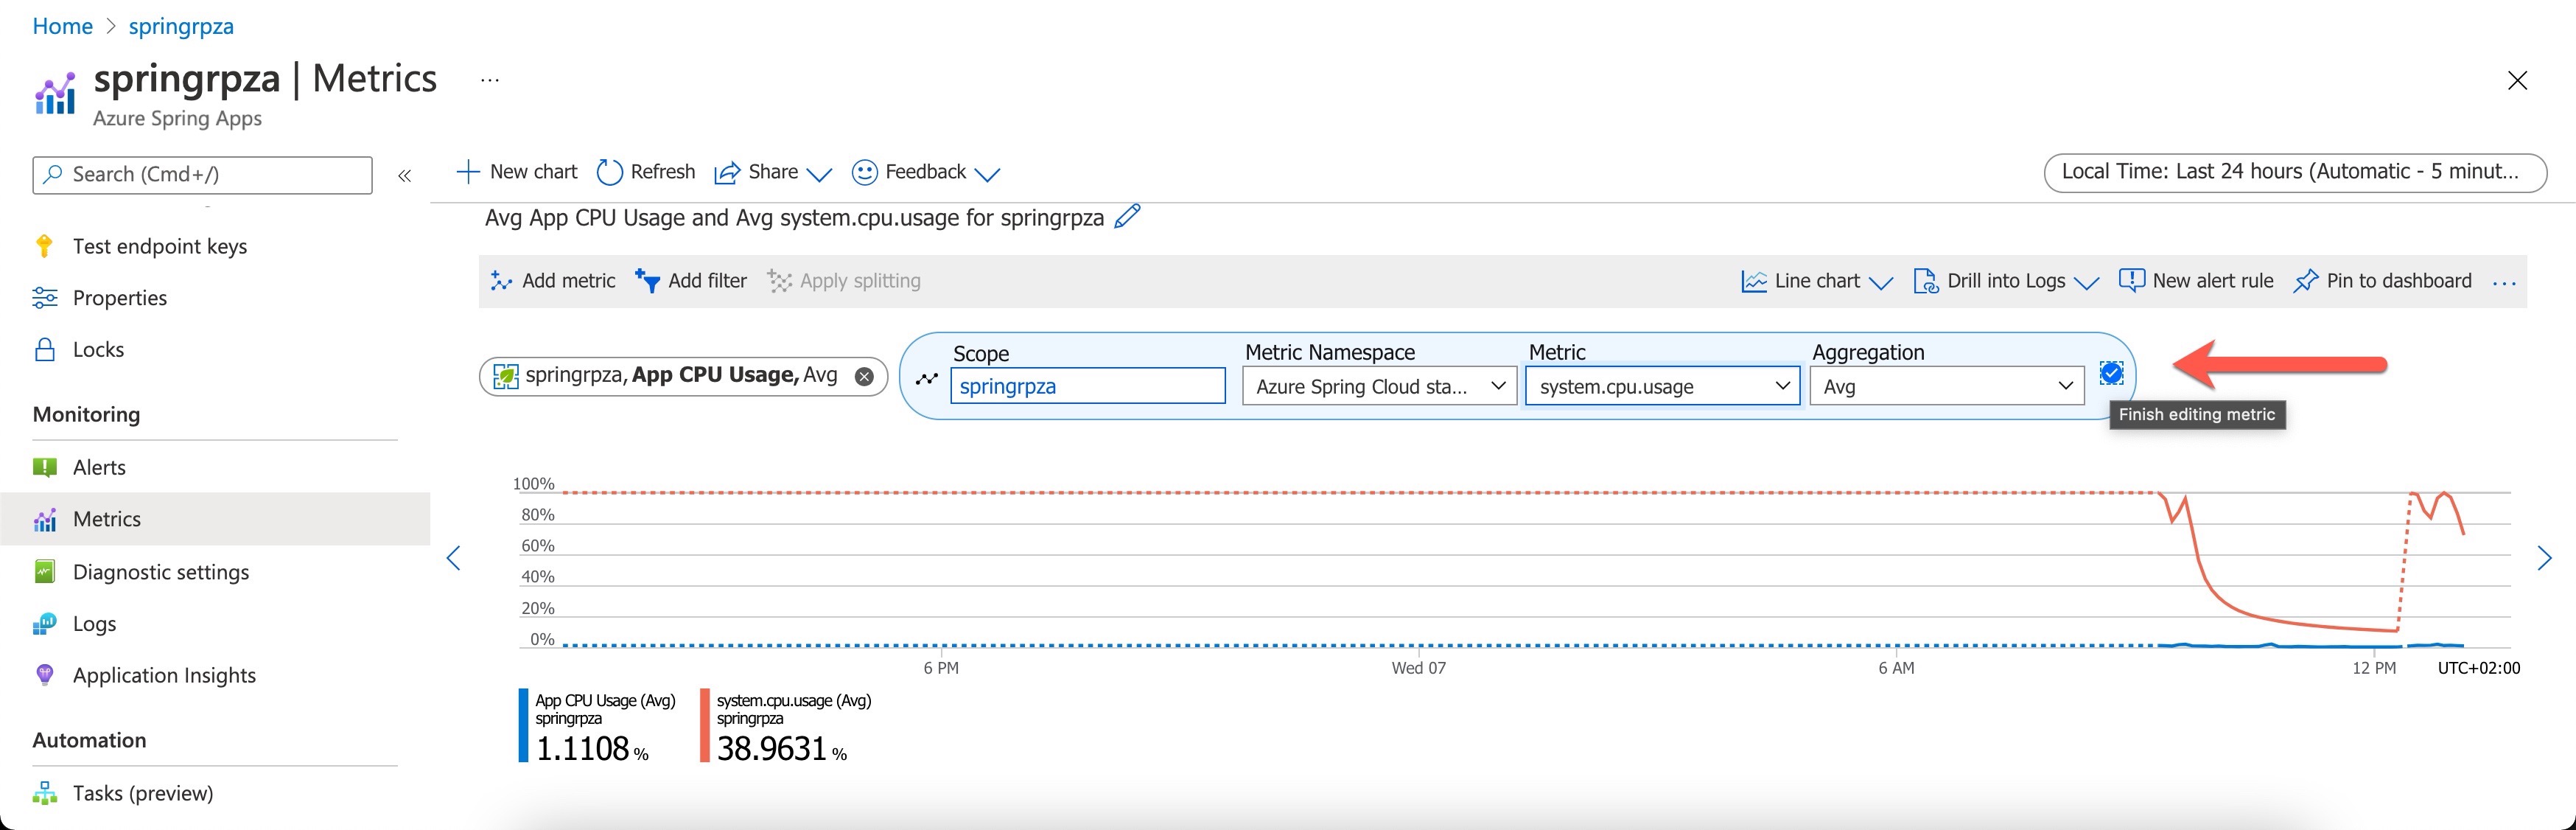
Finally, inspect your metrics graph, showing both the App and System CPU metrics.


Custom Metrics
As you deploy resources and applications in Azure, you'll want to start collecting telemetry to gain insights into their performance and health. Azure makes some metrics available to you out of the box. These metrics are called standard or platform. However, they're limited in nature. You might want to collect some custom performance indicators or business-specific metrics to provide deeper insights.
Similarly to standard metric chart, to create a custom metric chart, open the Metrics tab under the Monitoring section and follow these steps:
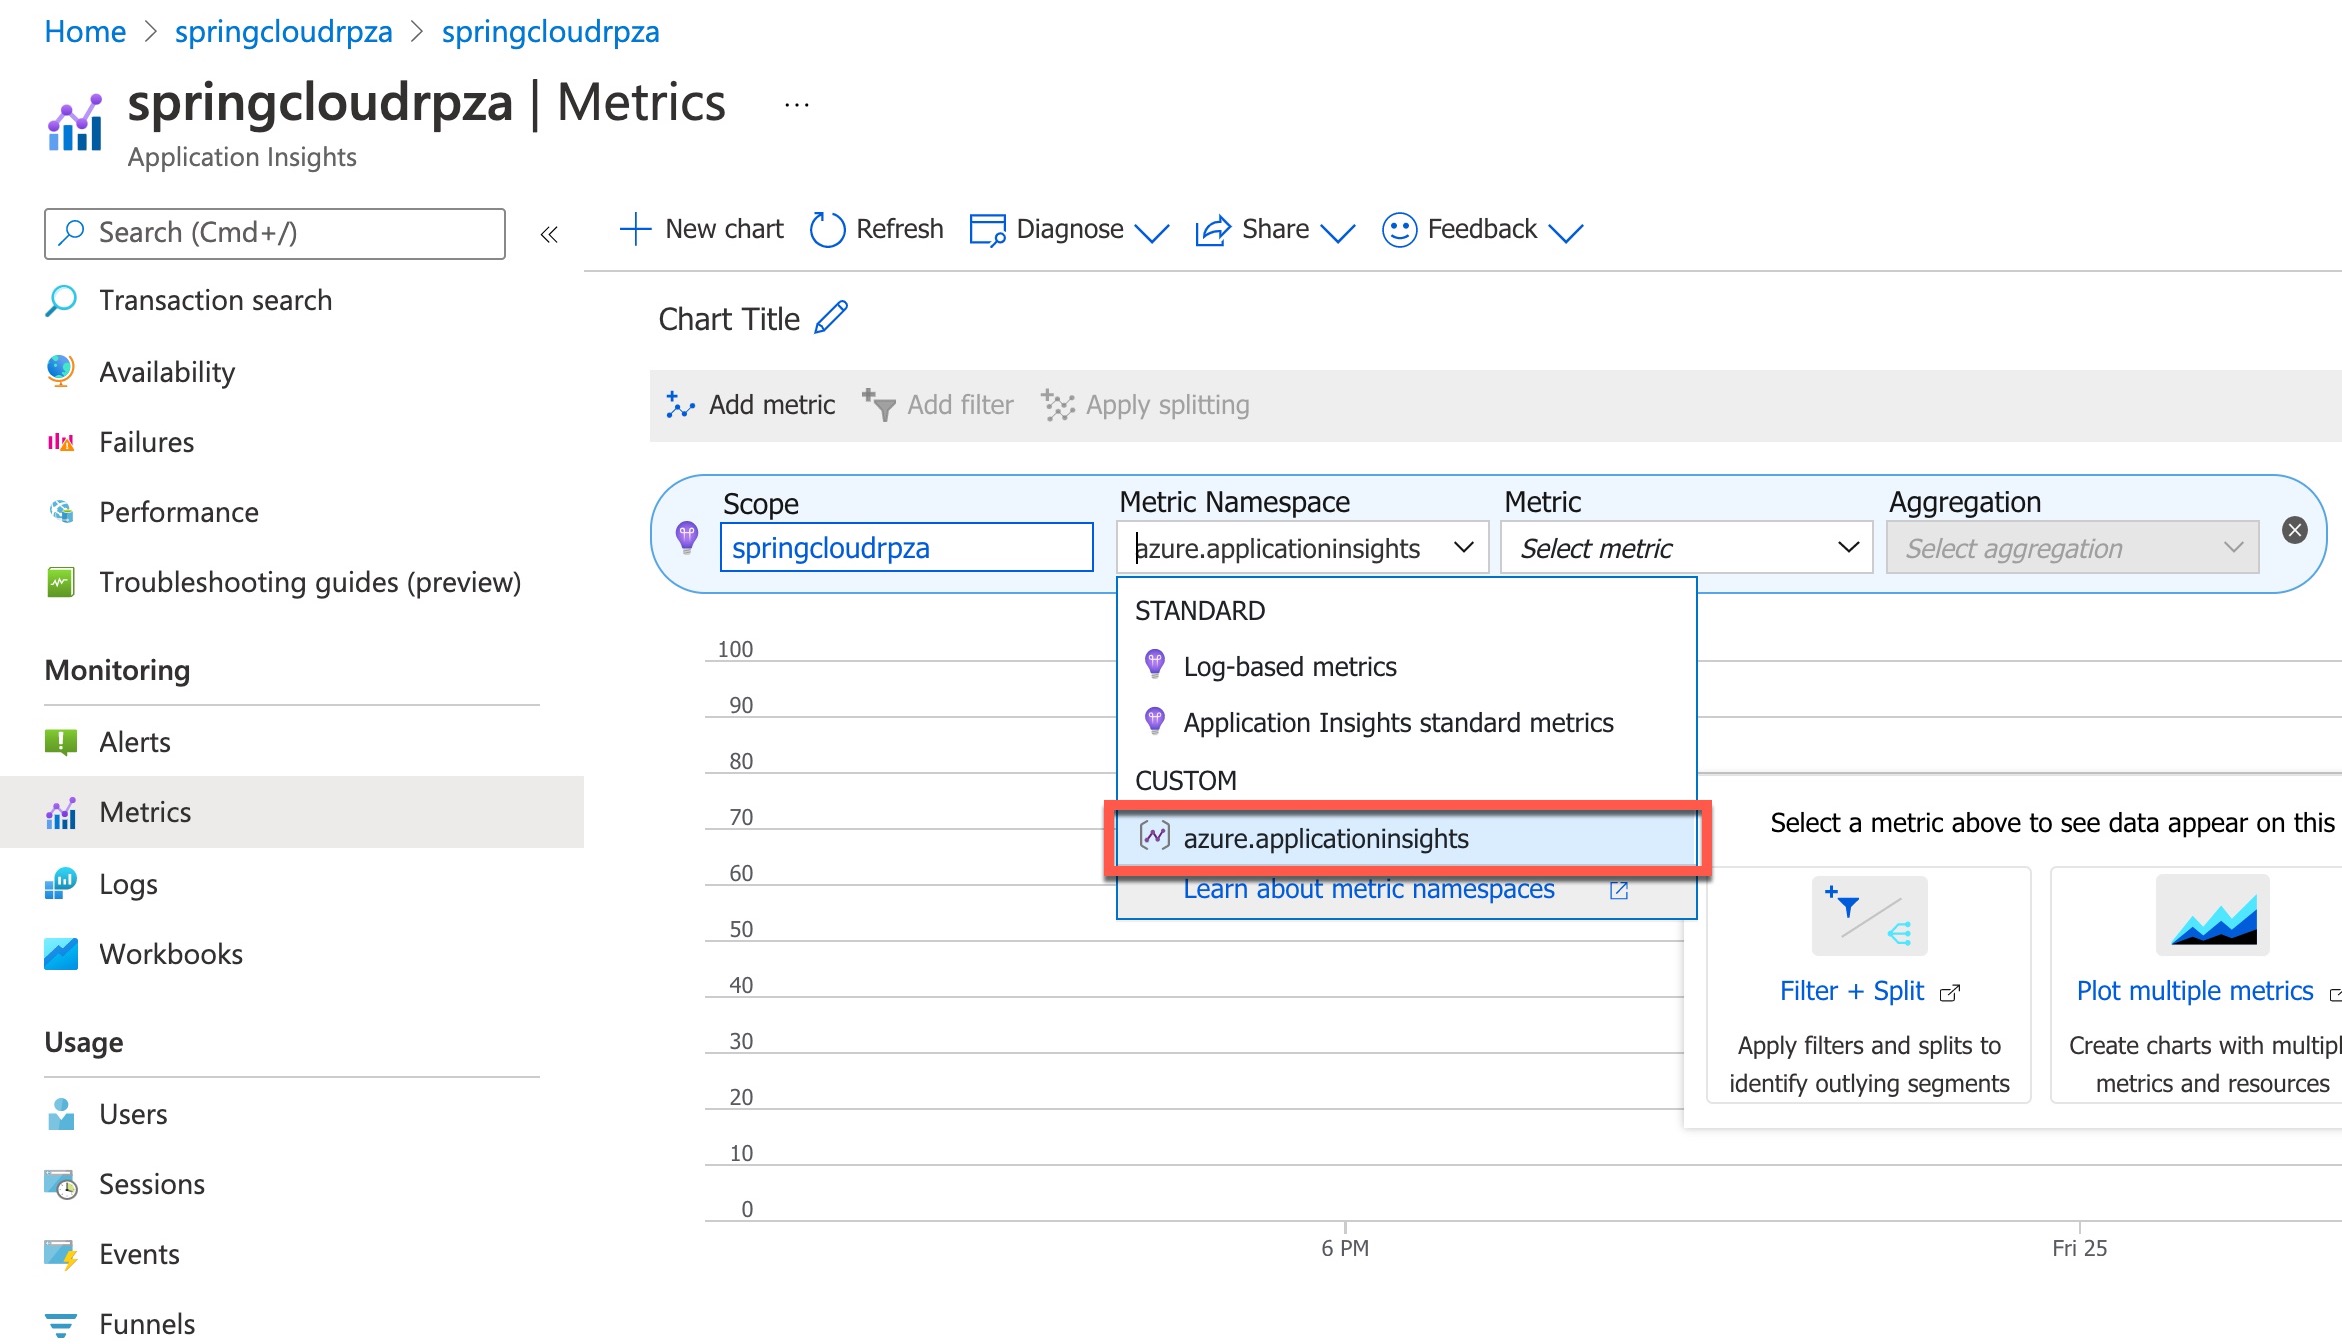
Ensure your Azure Spring Apps is selected in the resource scope picker. It will already be populated if you opened metrics explorer from the resource's menu.
Next, under Metric Namespace, select the azure.applicationinsights namespace. The namespace is just a way to organize metrics so that you can easily find them.
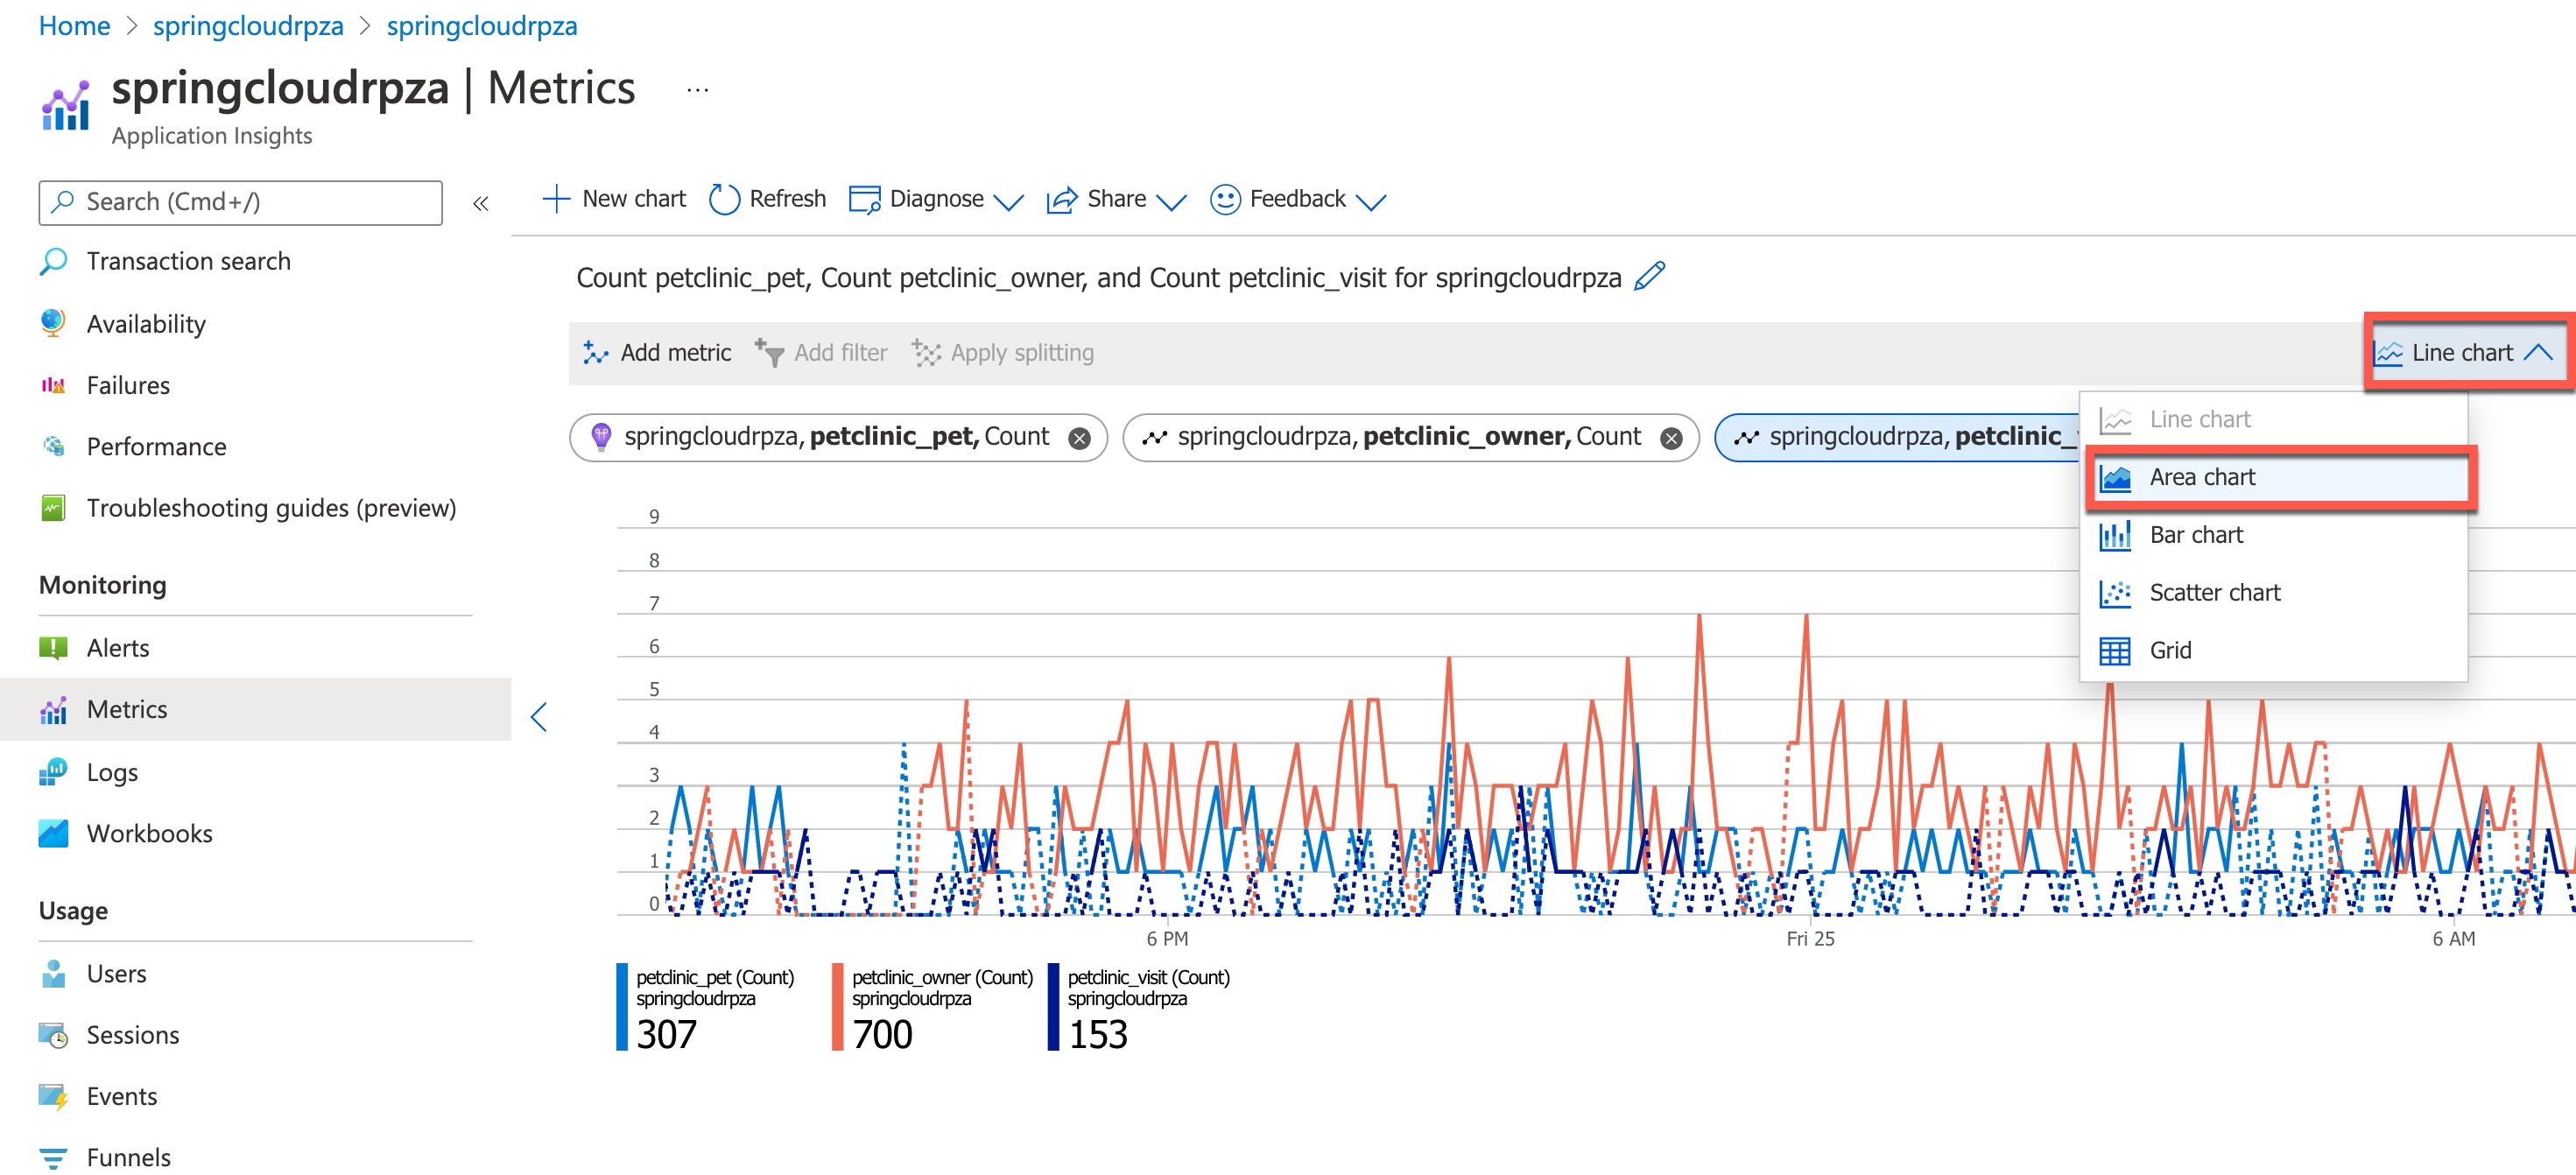
Next, under Metrics, add the following custom metrics and aggregation:
Metric
petclinic_pet, Aggregation:count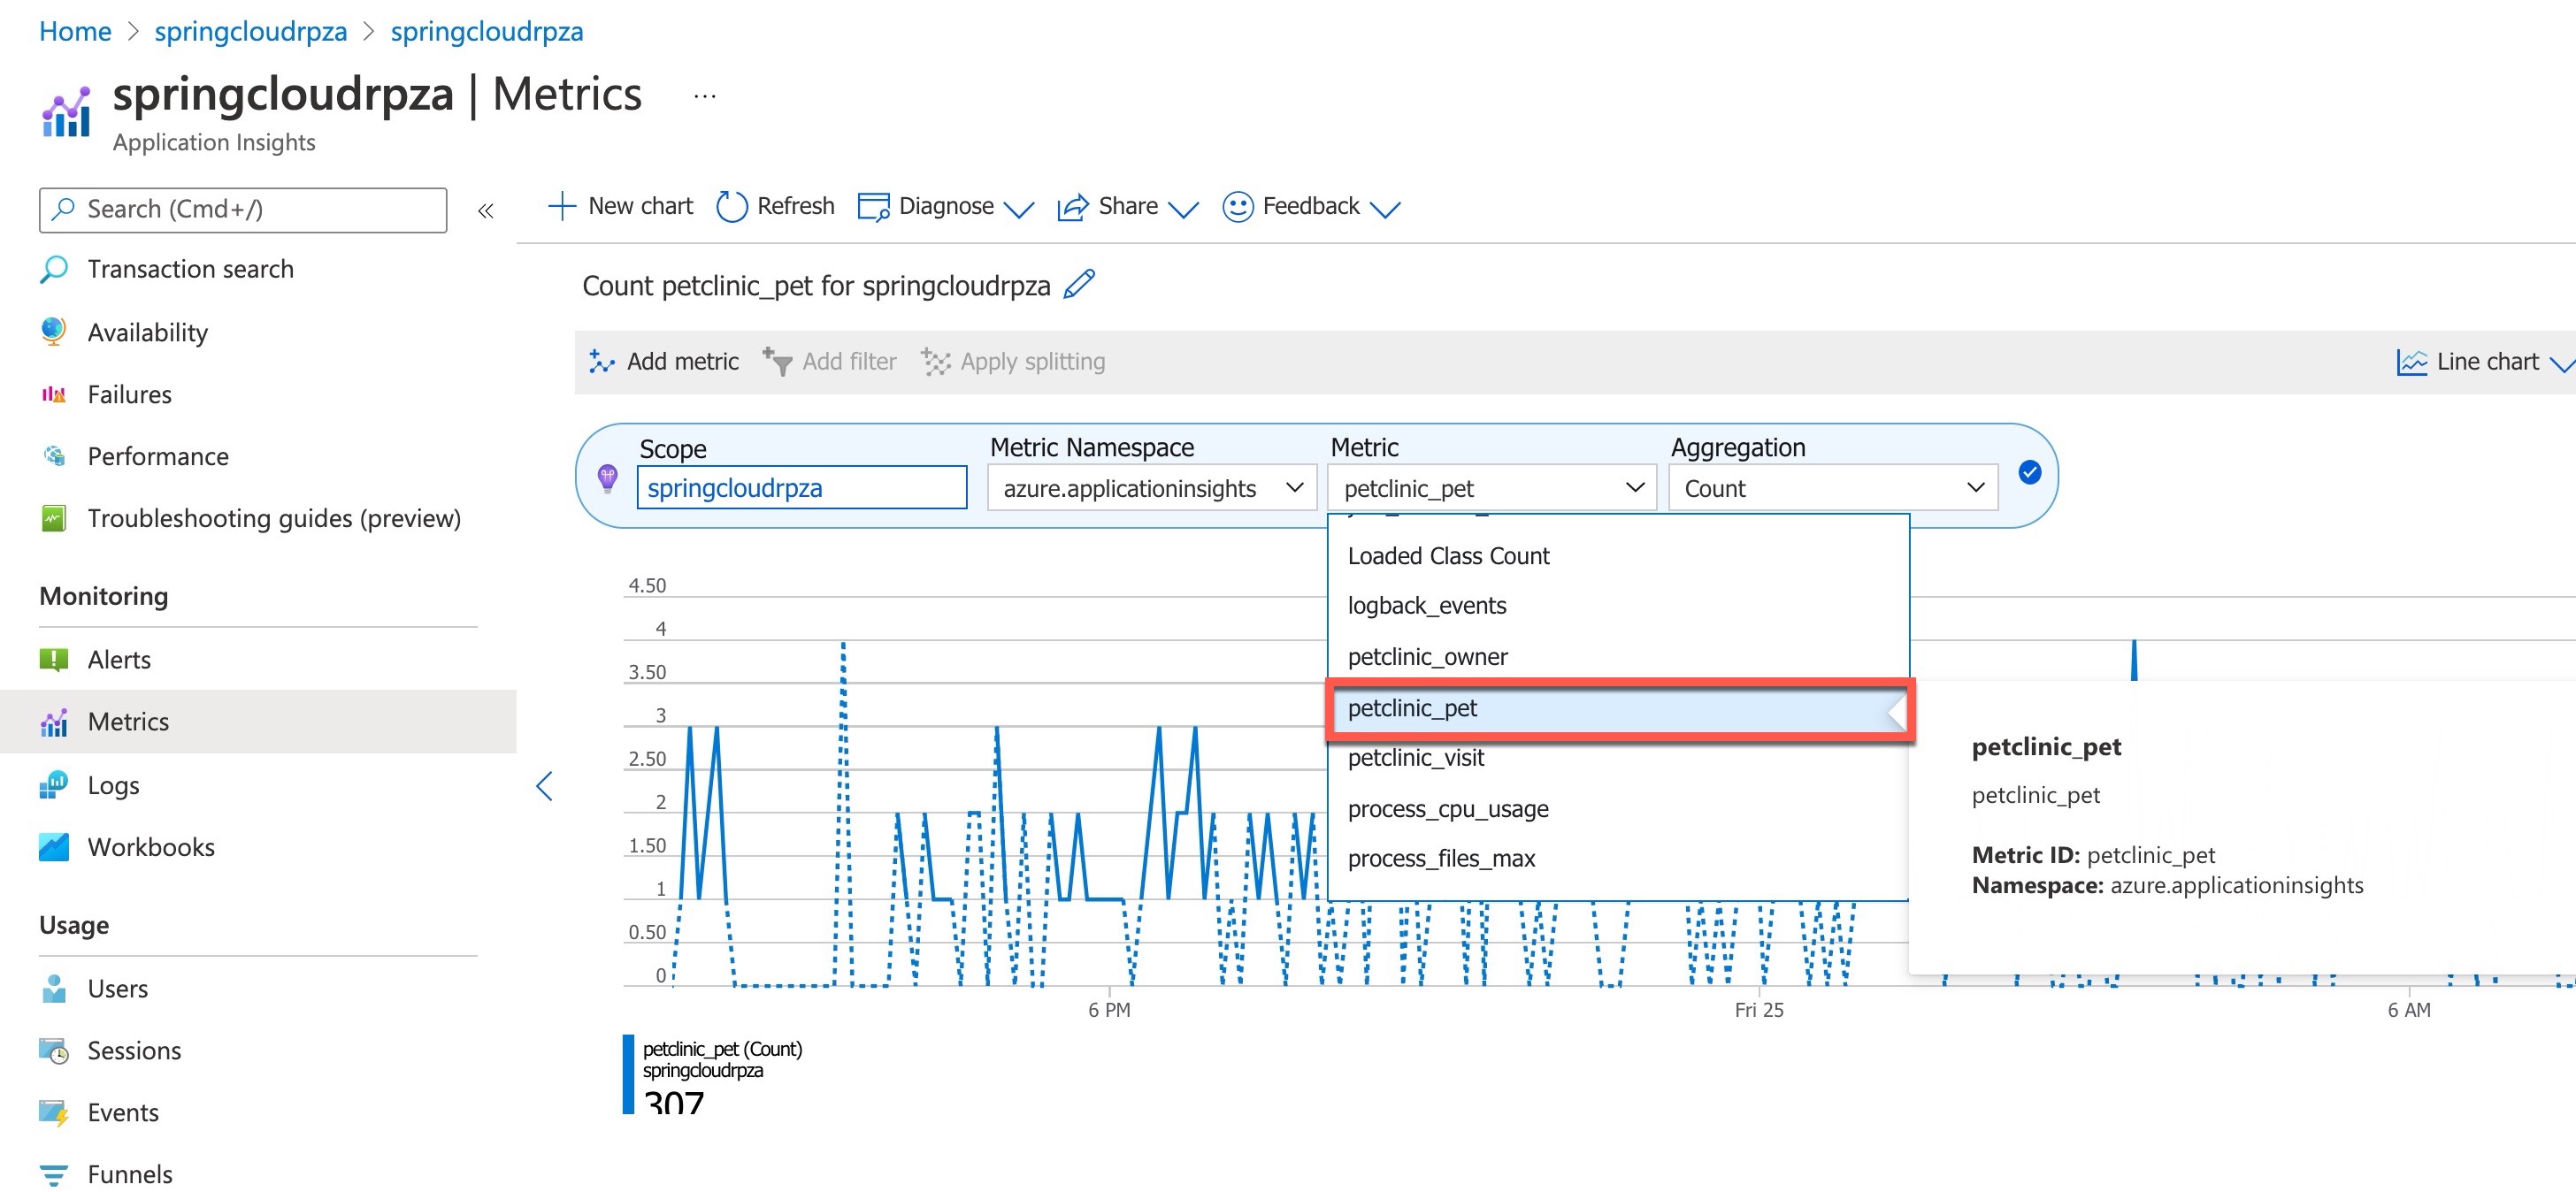
Metric
petclinic_owner, Aggregation:countMetric
petclinic_visit, Aggregation:count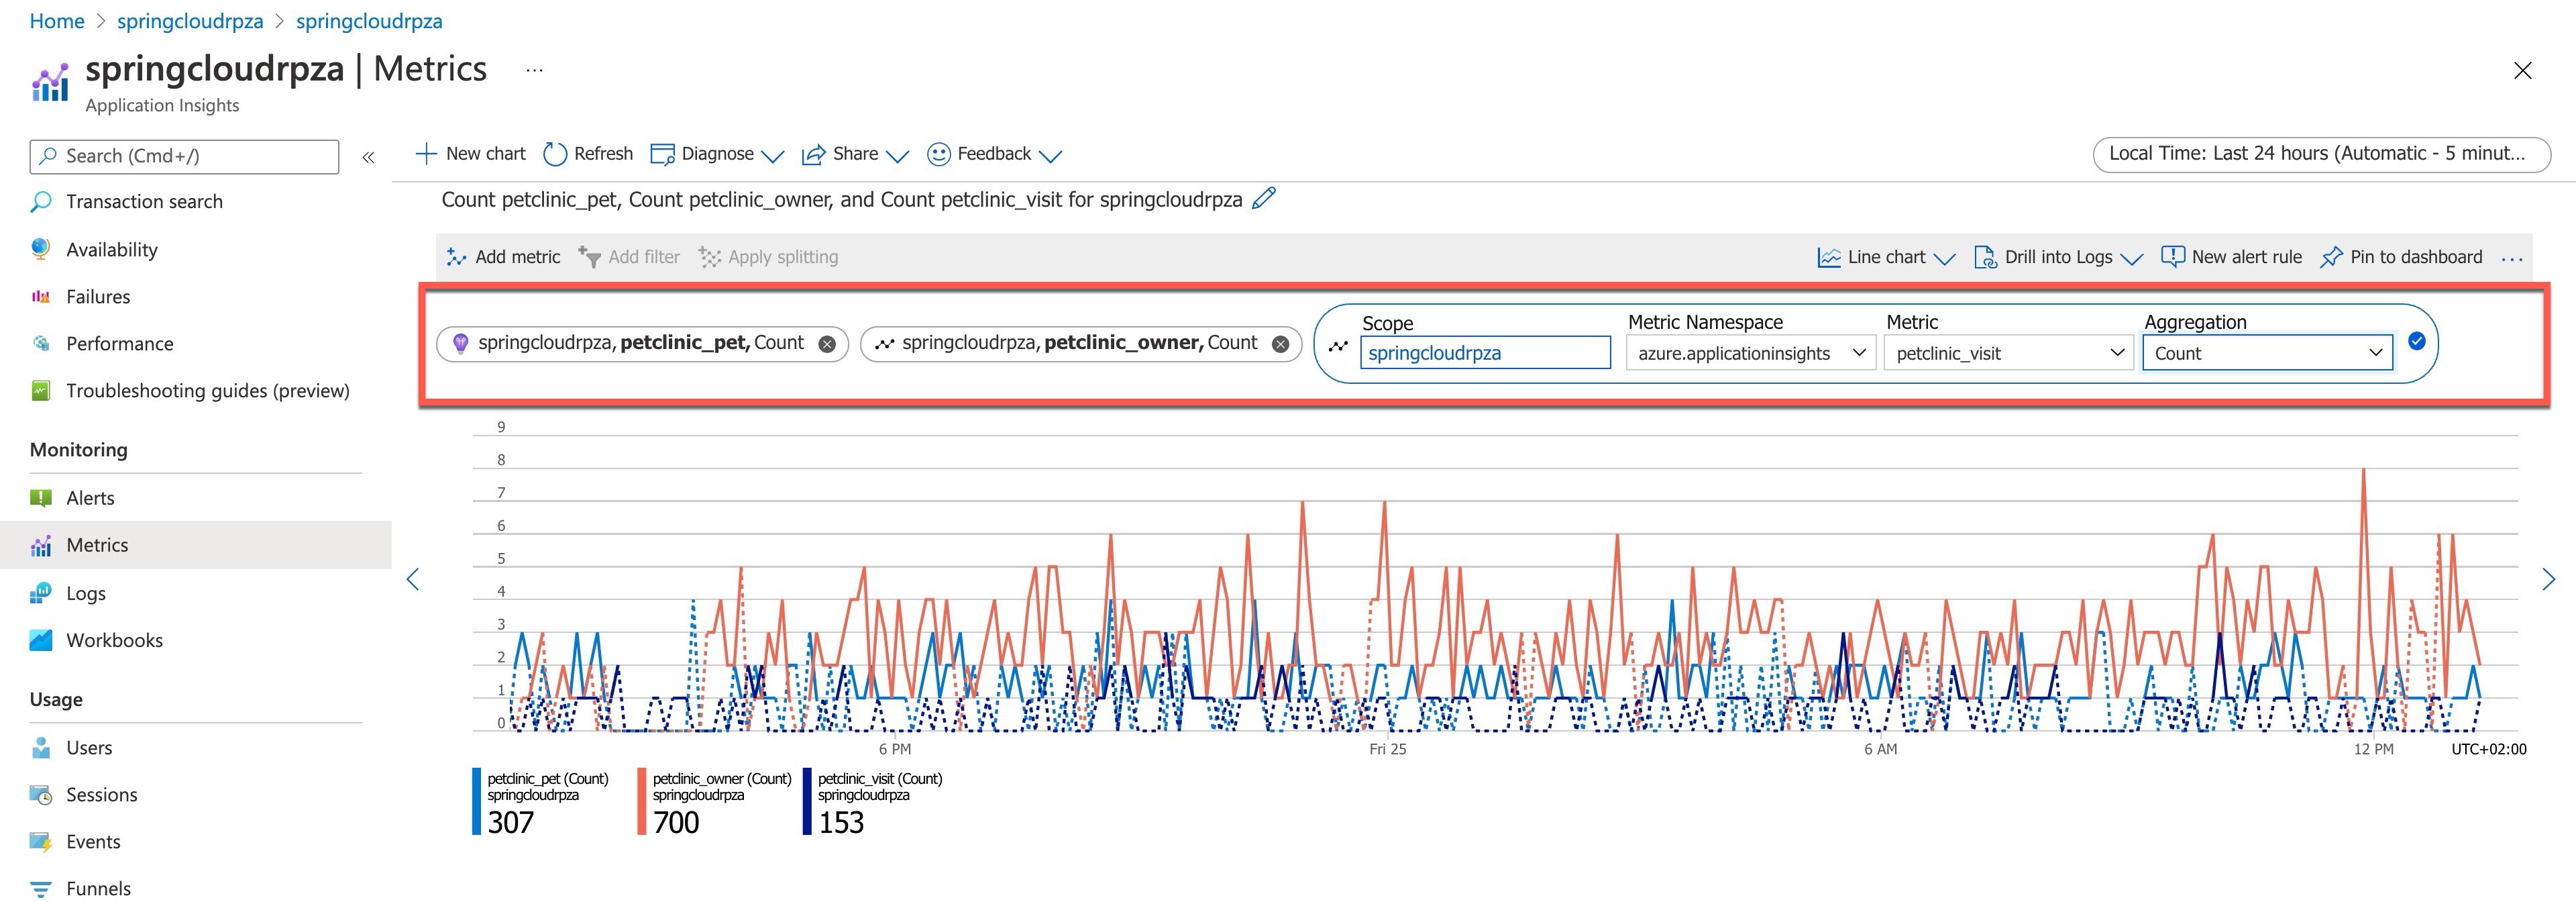
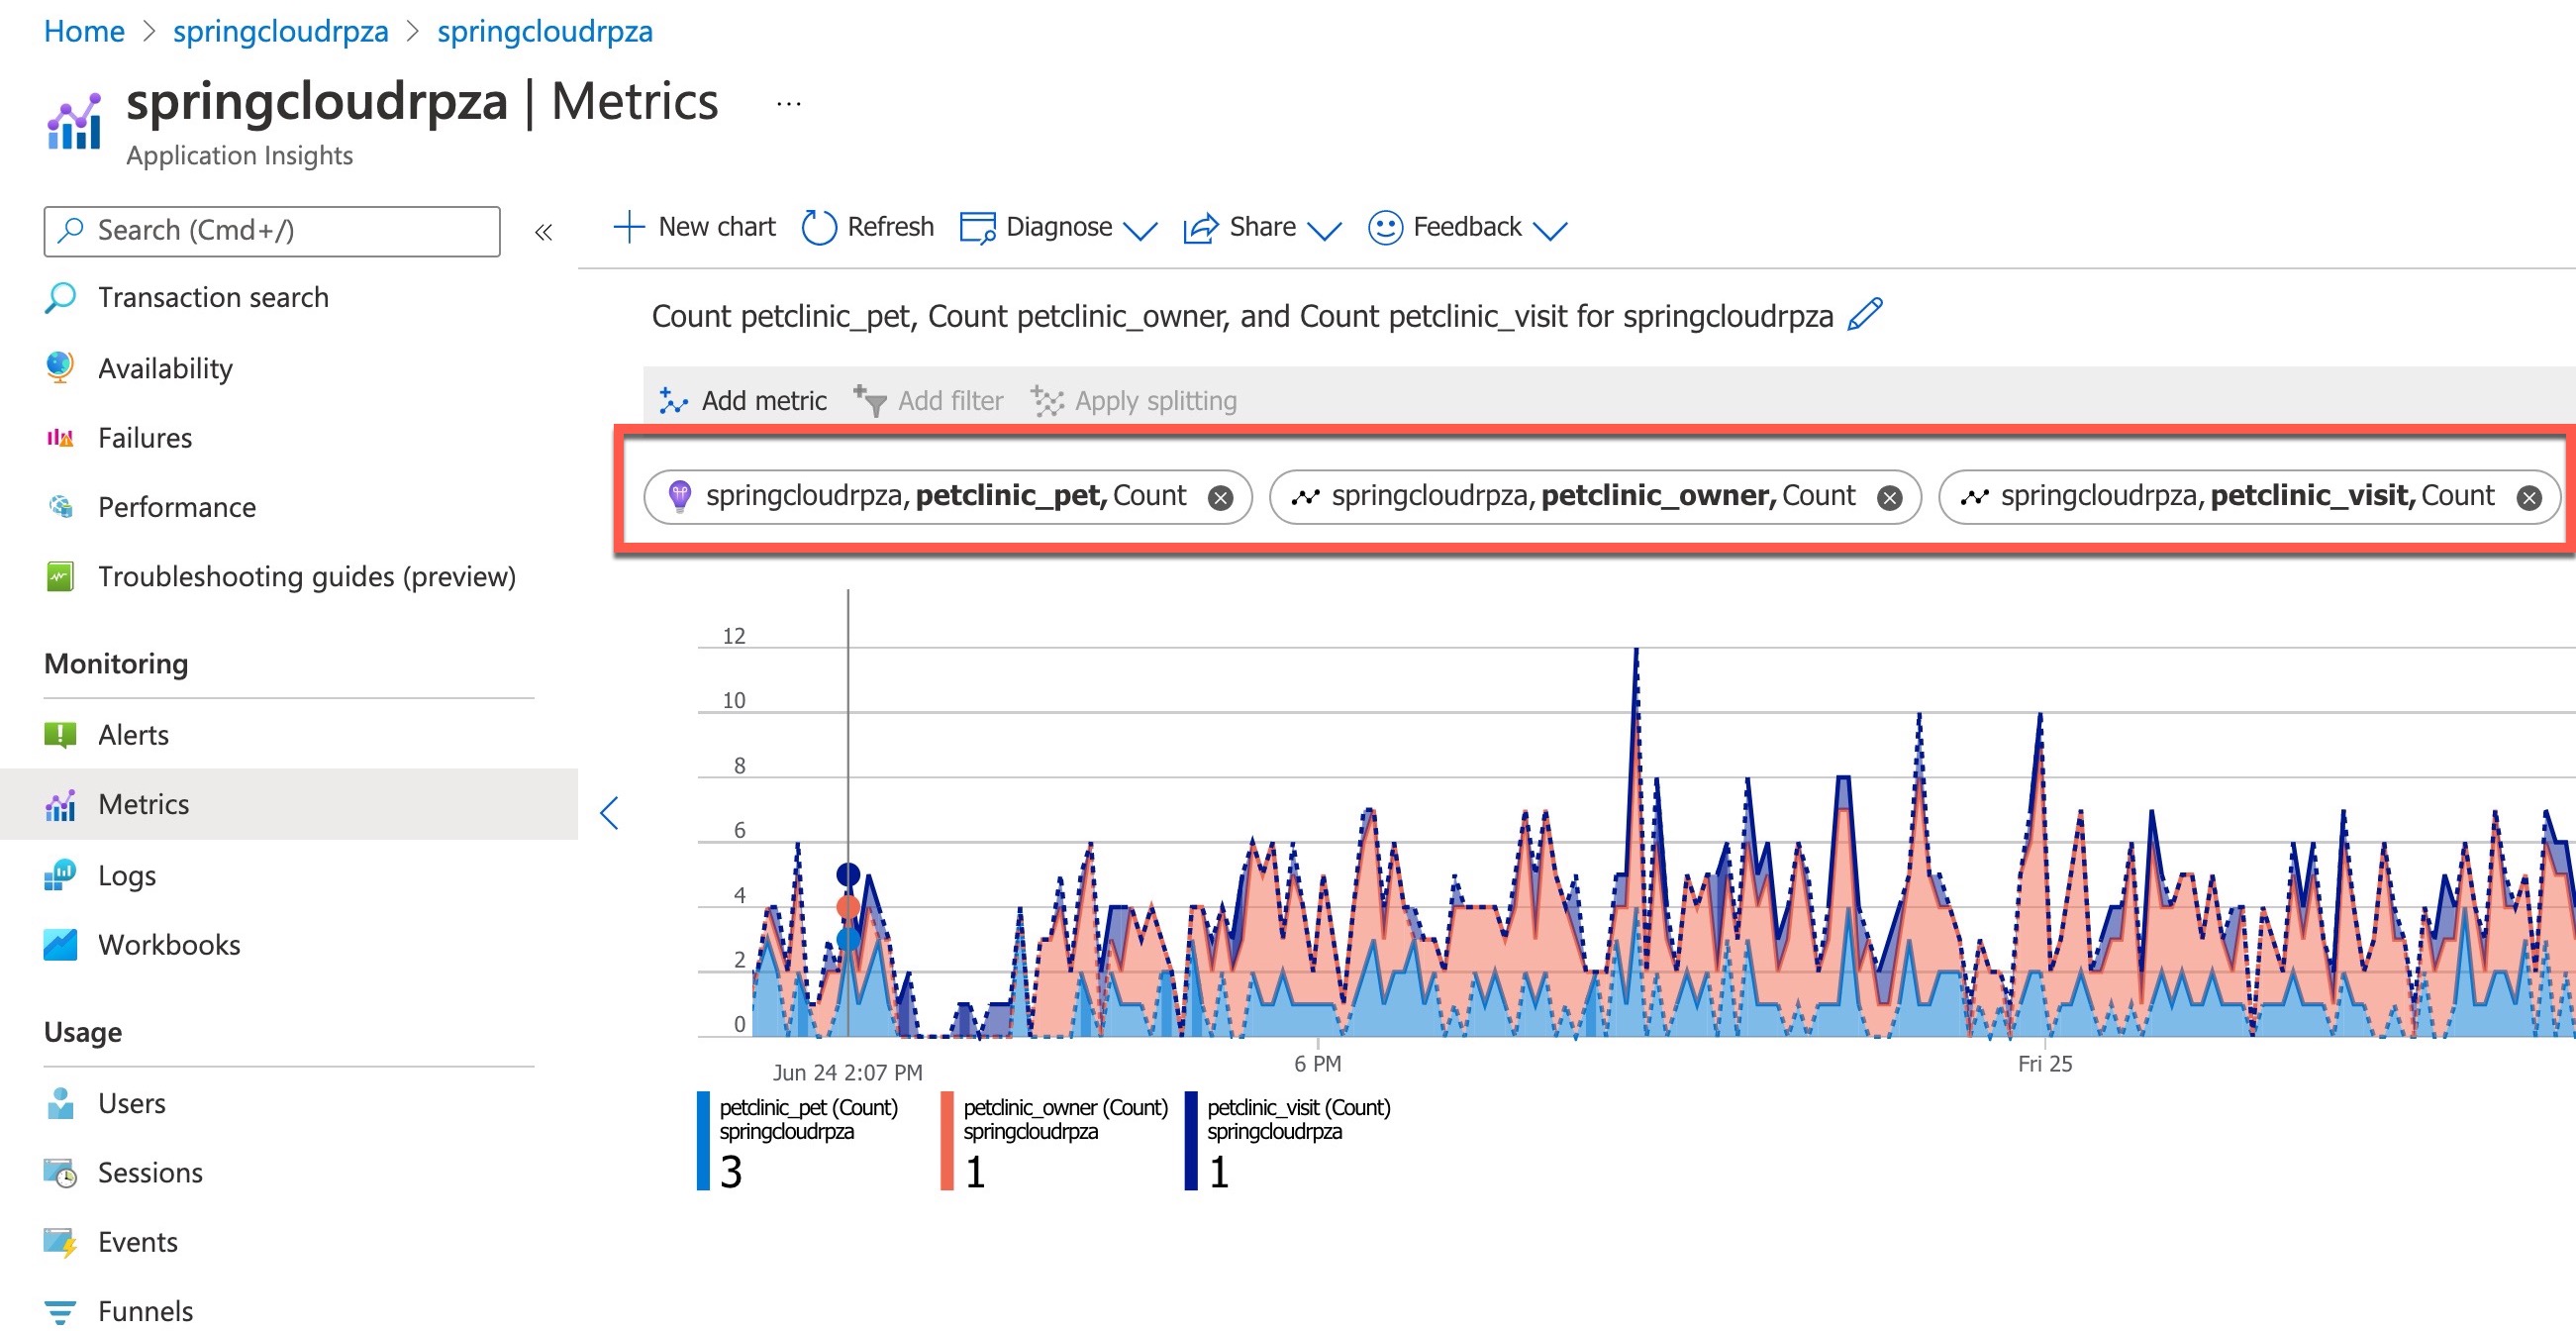
Next, on the top right-hand side, change the graph type to Area Chart.
Your final graph will show the counts in the last 24 hours for each of the pet, vet, and owner microservices:


Live Metrics
When you deploy a new version of your web app, you want to know immediately its effect on performance. Have response times improved or worsened, or is it showing failures? When you watch Live Metrics Stream in Application Insights while your deployment is happening, you’ll see the effect immediately. If there are problems, you could back out the deployment before too many users are affected.
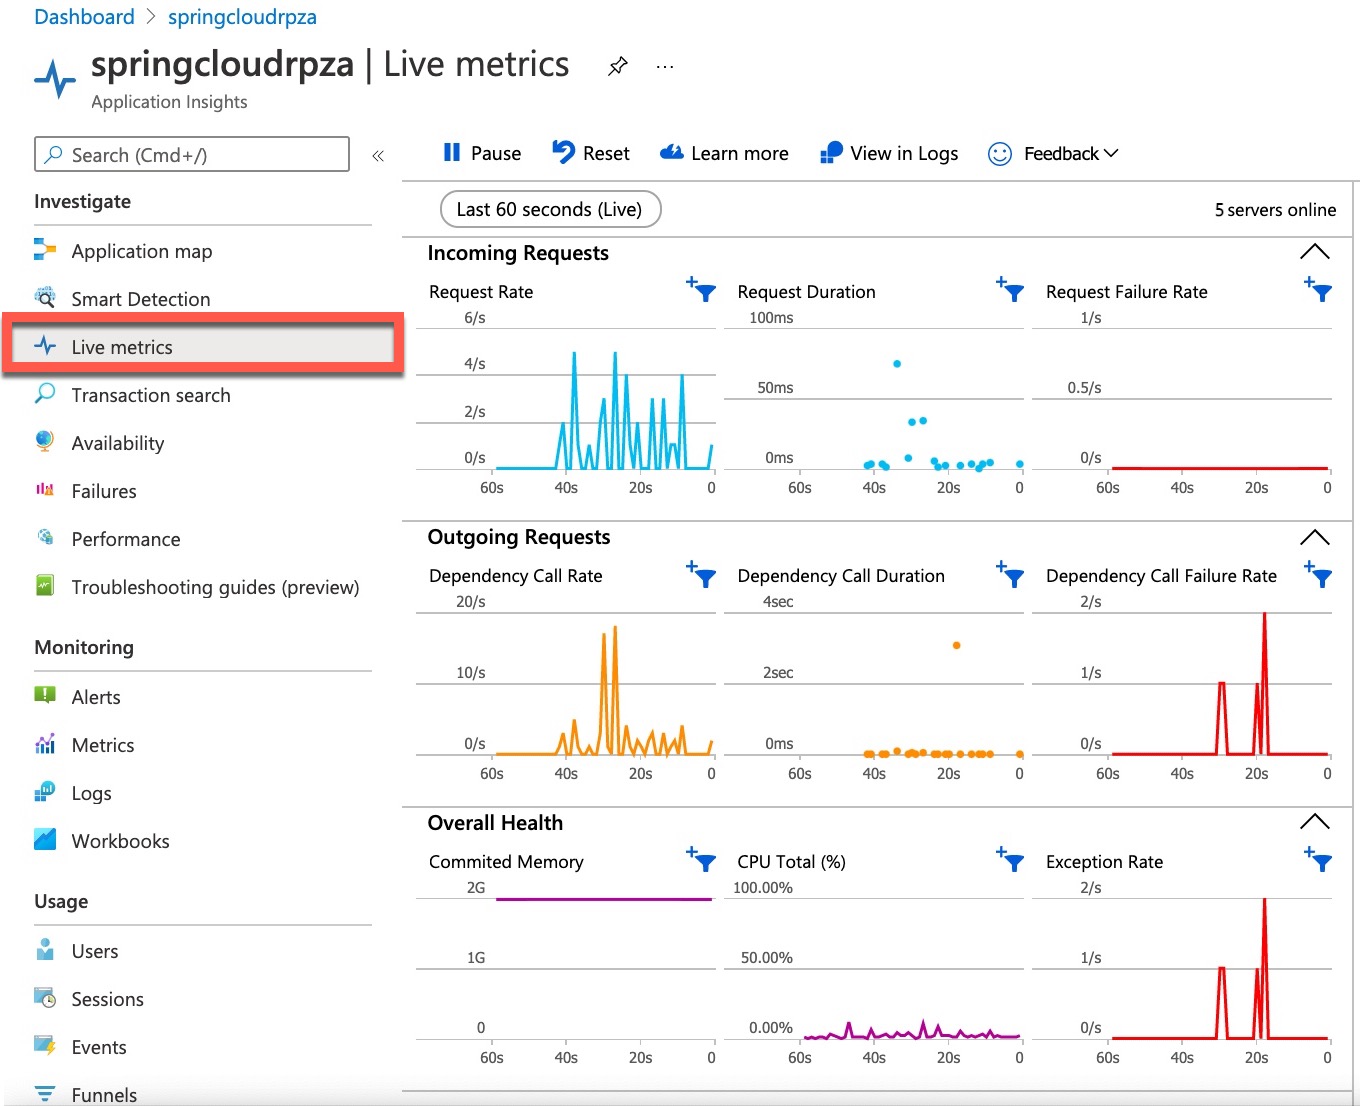
Live Metrics Stream allows you to probe the beating heart of your live applications. You can select and filter metrics and performance counters to watch in real time without any disturbance to your service. You can also inspect stack traces from sample failed requests and exceptions.
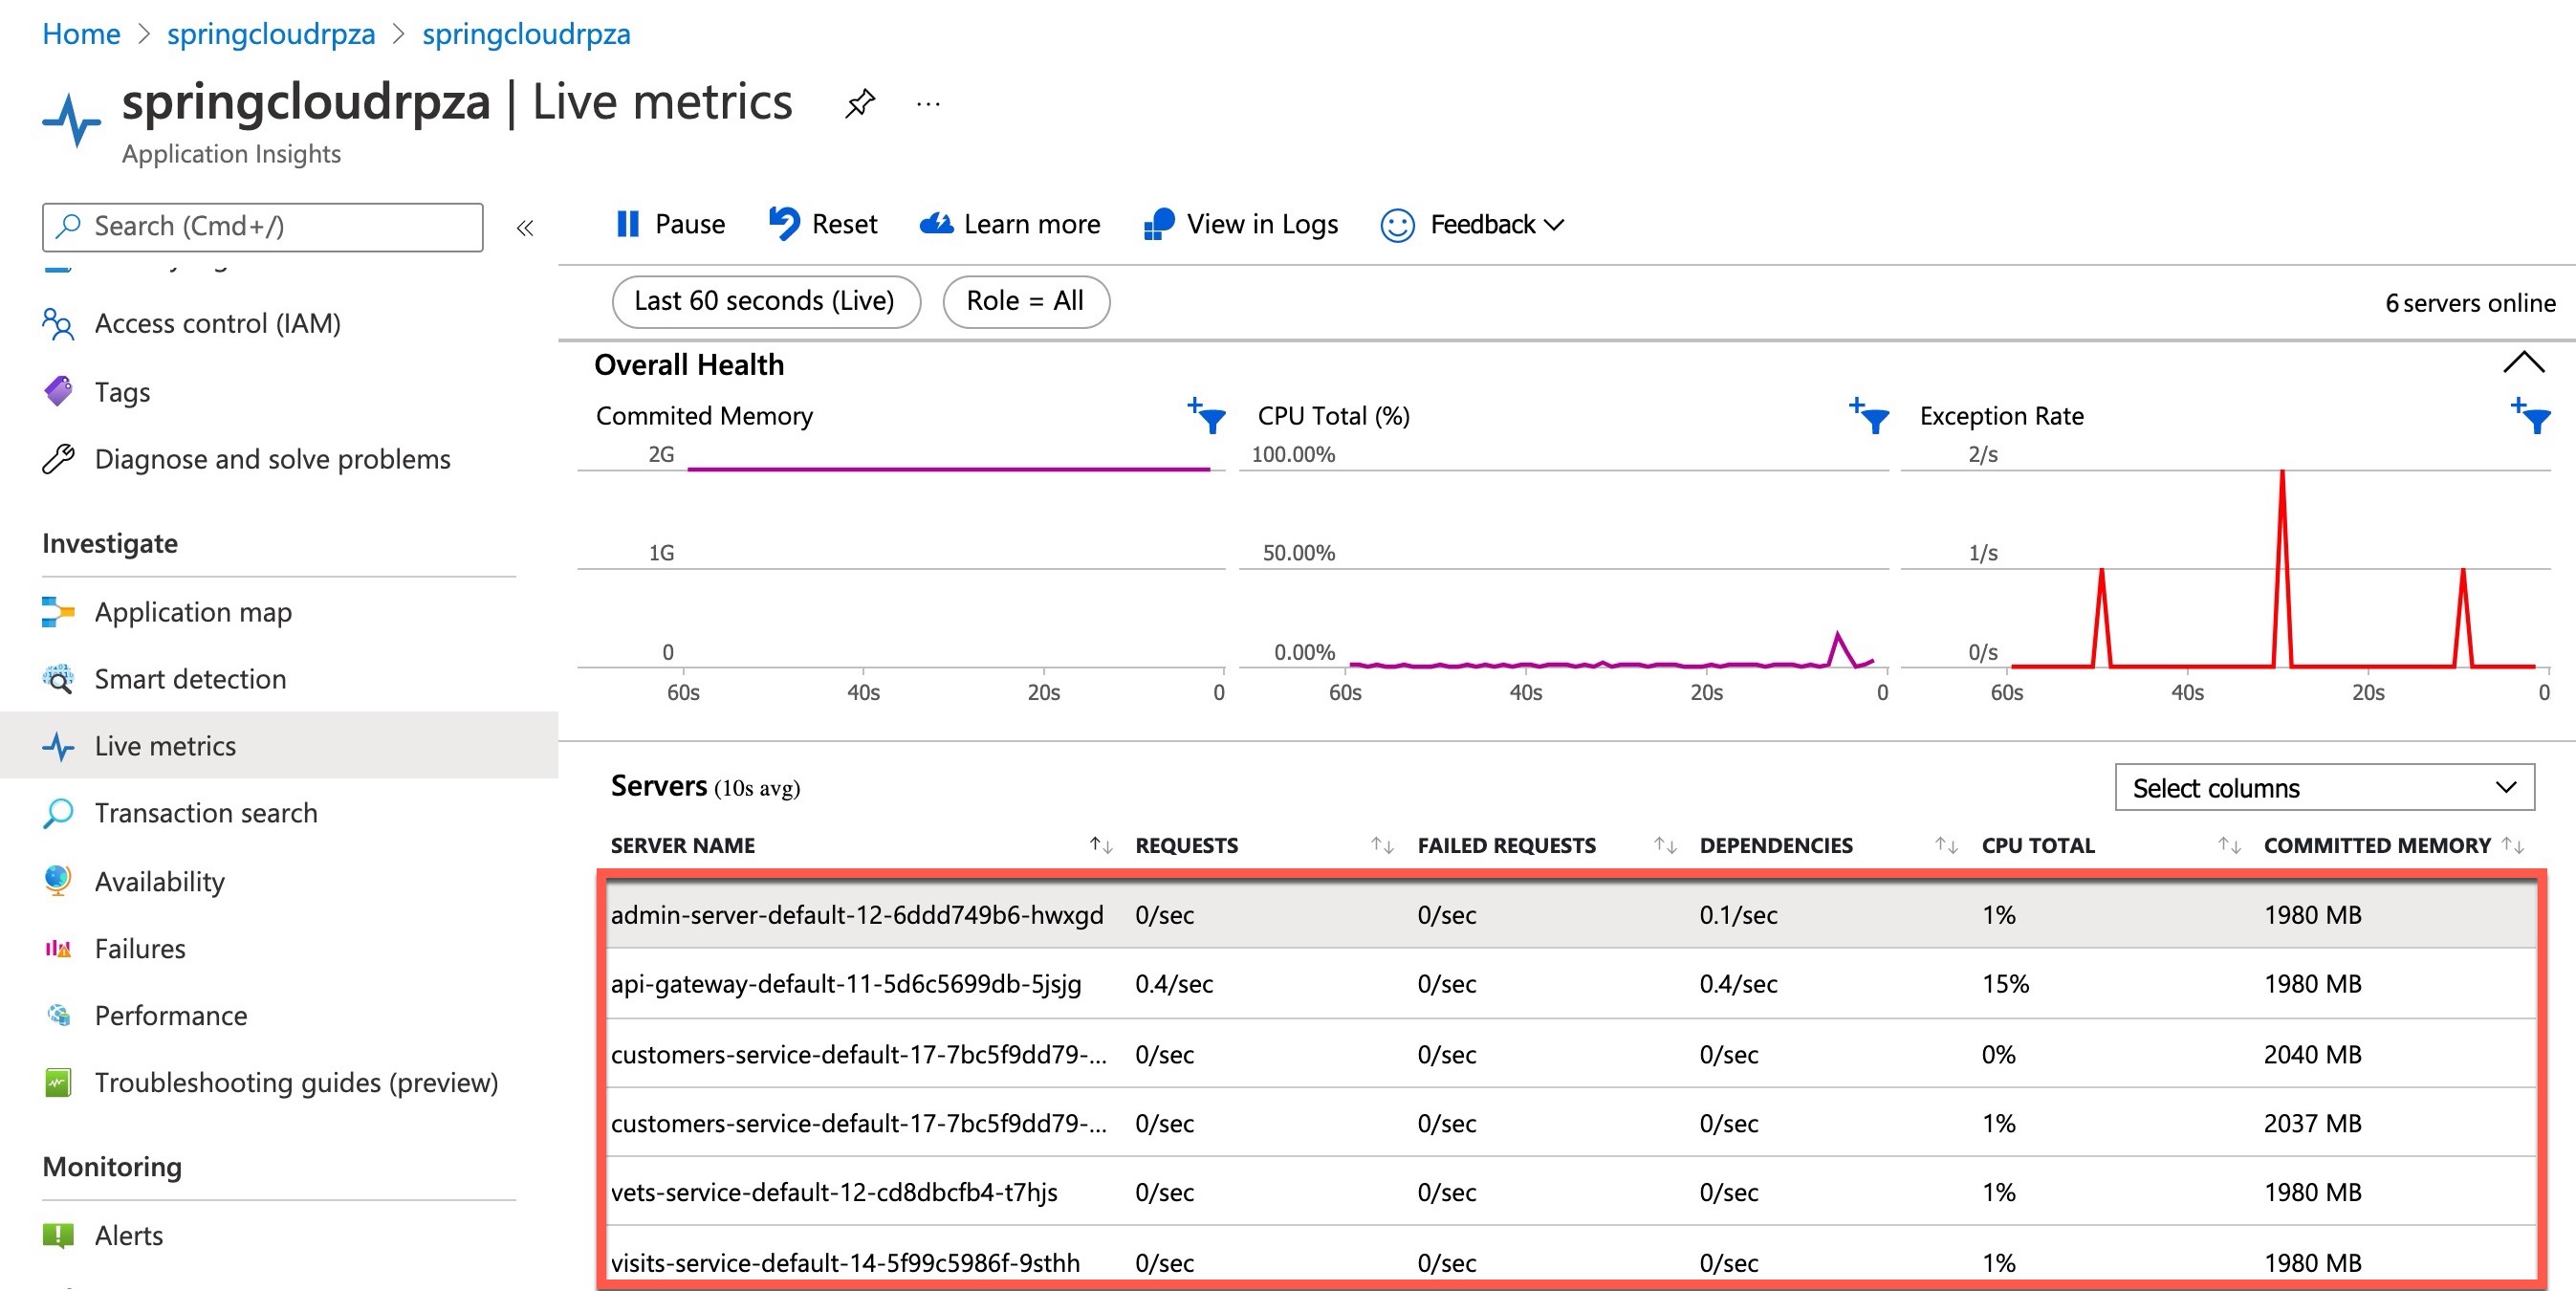
On the left, under Investigate, navigate to Live metrics, where you can see live metrics practically in real time (within only one second):
Scroll down the metrics to see the metrics for each microservice: