Manage incidents
Microsoft Defender XDR provides a cross-domain threat correlation and purpose-driven portal to investigate threats. Incidents are based on related alerts created when a malicious event or activity is seen on your network. Individual alerts provide valuable clues about an on-going attack. However, attacks typically employ various vectors and techniques to carry out a breach. Piecing individual clues together can be challenging and time-consuming.
This short video gives an overview of incidents in Microsoft Defender XDR.
An incident is a collection of correlated alerts that make up the story of an attack. Microsoft Defender XDR automatically aggregates malicious and suspicious events that are found in different device, user, and mailbox entities in the network. Grouping related alerts into an incident gives security defenders a comprehensive view of an attack.
For instance, security defenders can see where the attack started, what tactics were used, and how far the attack has gone into the network. Security defenders can also see the scope of the attack. Like how many devices, users, and mailboxes were impacted, how severe the impact was, and other details about affected entities.
If enabled, Microsoft Defender XDR can automatically investigate and resolve the individual alerts through automation and artificial intelligence. Security defenders can also perform more remediation steps to resolve the attack straight from the incidents view.
Incidents from the last 30 days are shown in the incident queue. From here, security defenders can see which incidents should be prioritized based on risk level and other factors.
Security defenders can also rename incidents, assign them to individual analysts, classify, and add tags to incidents for a better and more customized incident management experience.
Prioritize incidents
Microsoft Defender XDR applies correlation analytics and aggregates all related alerts and investigations from different products into one incident. Microsoft Defender XDR also triggers unique alerts on activities that can only be identified as malicious given the end-to-end visibility that Microsoft Defender XDR has across the entire estate and suite of products. This view gives your security operations analyst the broader attack story, which helps them better understand and deal with complex threats across the organization.
The Incidents queue shows a collection of flagged incidents from across devices, users, and mailboxes. It helps you sort through incidents to prioritize and create an informed cybersecurity response decision.
By default, the queue in the Microsoft Defender portal displays incidents seen in the last 30 days. The most recent incident is at the top of the list so that you can see it first.
The incident queue exposes customizable columns that give you visibility into different characteristics of the incident or the contained entities. This deeper layer of information helps you make an informed decision regarding the prioritization of incidents to handle.
For more clarity at a glance, automatic incident naming generates incident names based on alert attributes such as the number of endpoints affected, users affected, detection sources, or categories. The automatic naming allows you to quickly understand the scope of the incident.
Available filters
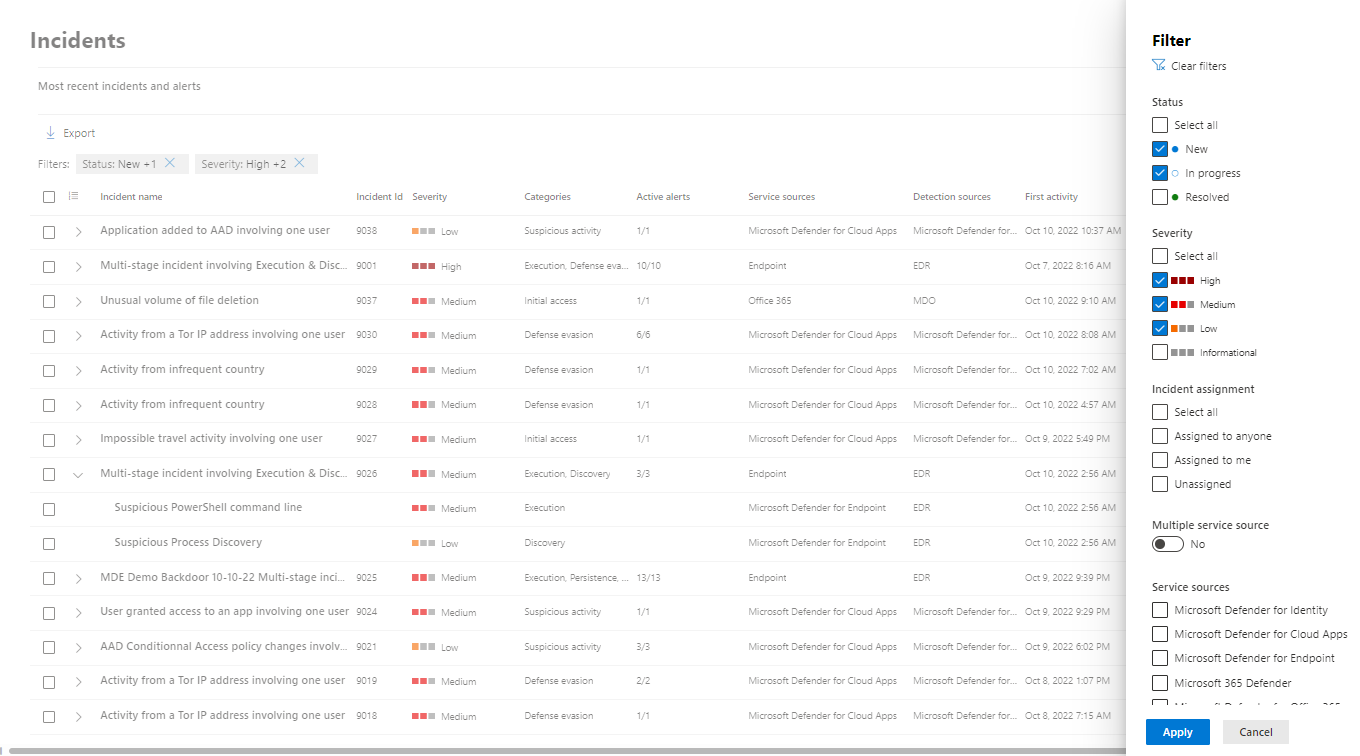
Status
You can choose to limit the list of incidents shown based on their status to see which ones are active or resolved.
Severity
The severity of an incident is indicative of the impact it can have on your assets. The higher the severity, the bigger the impact and typically requires the most immediate attention.
Incident assignment
You can choose to show alerts that are assigned to you or the alerts handled by automation.
Multiple service source
Select No (default), or yes to enable.
Service sources
Filter to only see incidents that contain alerts from different sources. Sources include: Microsoft Defender for Endpoint, Microsoft Cloud App Security, Microsoft Defender for Identity, Microsoft Defender for Office 365.
Tags
Filter on assigned tags. Any assigned Tags will appear once you select the Type tag name field.
Multiple category
You can choose to see only incidents that have mapped to multiple categories and can thus potentially cause more damage.
Categories
Choose categories to focus on specific tactics, techniques, or attack components seen.
Entities
Filter on entity name or ID.
Data sensitivity
Some attacks focus on targeting to exfiltrate sensitive or valuable data. By applying a filter to see if sensitive data is involved in the incident, you can quickly determine if sensitive information has been compromised. And if a compromise is found you can prioritize a response to those incidents. This filtering ability is only applicable if Microsoft Purview Information Protection is turned on.
Device group
Filter by defined device groups.
OS platform
Limit the incident queue view by operating system.
Classification
Filter incidents based on the set classifications of the related alerts. The values include true alerts, false alerts, or not set.
Automated Investigation state
Filter incidents by the status of the automated investigation.
Associated Threat
Selecting the Type associated threat field will allow you to enter threat information, and bring up previous search criteria.
Preview incidents
The portal pages provide preview information for most list-related data.
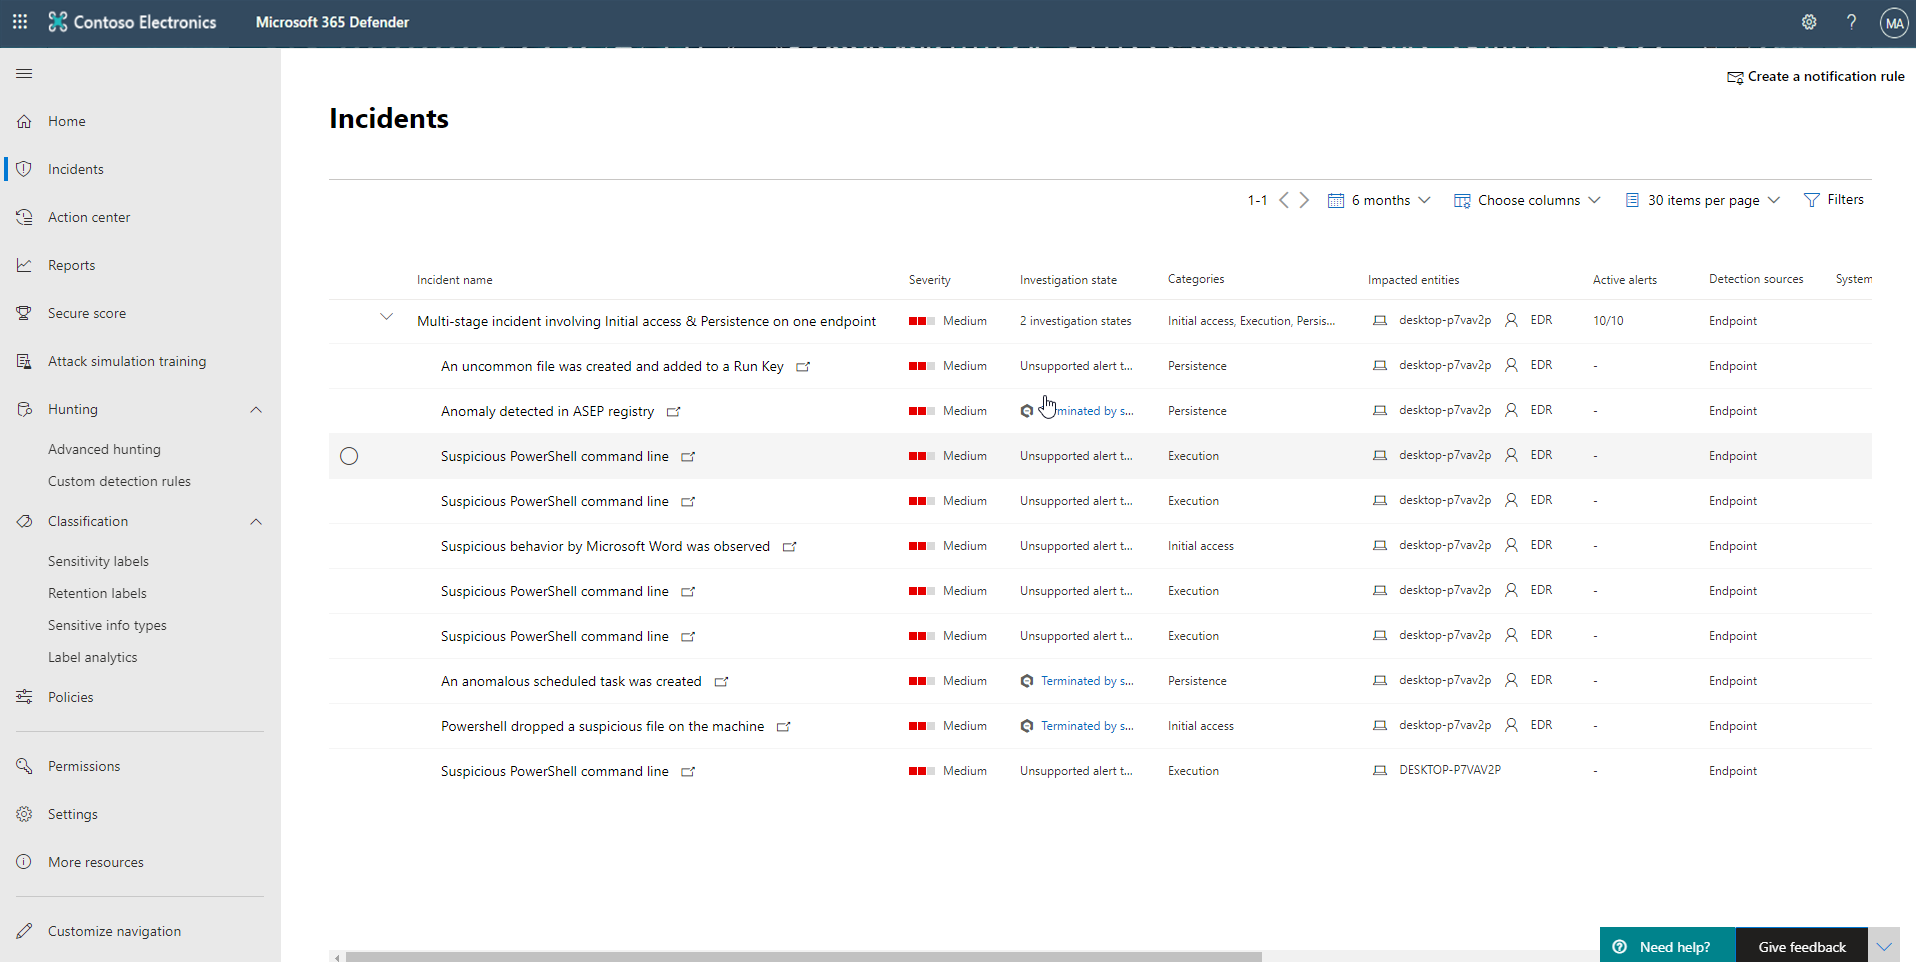
In this screenshot, the three highlighted areas are the circle, the greater than symbol, and the actual link.
Circle
Selecting the circle will open a details window on the right side of the page with a preview of the line item with an option to open the full page of information.
Greater than symbol
If there are related records that can be displayed, selecting the greater than sign will display the records below the current record.
Link
The link will navigate you to the full page for the line item.
Manage incidents
Managing incidents is critical in ensuring that threats are contained and addressed. In Microsoft Defender XDR, you have access to managing incidents on devices, users, and mailboxes. You can manage incidents by selecting an incident from the Incidents queue.
You can edit the name of an incident, resolve it, set its classification and determination. You can also assign the incident to yourself, add incident tags and comments.
In cases where you would like to move alerts from one incident to another, during an investigation, you can also do so from the Alerts tab. Using the Alerts tab allows you to create a larger or smaller incident that includes all relevant alerts.
Edit incident name
Incidents are automatically assigned a name based on alert attributes such as the number of endpoints affected, users affected, detection sources, or categories. Naming based on alert attributes allows you to quickly understand the scope of the incident. You can modify the incident name to better align with your preferred naming convention.
Assign incidents
If an incident hasn't yet been assigned, you can select Assign to me to assign the incident to yourself. Doing so assumes ownership of not just the incident but also all the alerts associated with it.
Set status and classification
Incident status
You can categorize incidents (as Active, or Resolved) by changing their status as your investigation progresses. This ability to update status helps you organize and manage how your team can respond to incidents.
For example, your SOC analyst can review the urgent Active incidents for the day and decide to assign them to themselves for investigation.
Alternatively, your SOC analyst might set the incident as Resolved if the incident has been remediated. Resolving an incident will automatically close all open alerts that are part of the incident.
Classification and determination
You can choose not to set a classification or decide to specify whether an incident is true alert or false alert. Doing so helps the team see patterns and learn from them.
Add comments
You can add comments and view historical events about an incident to see previous changes made to it.
Whenever a change or comment is made to an alert, it's recorded in the Comments and history section.
Added comments instantly appear on the pane.
Add incident tags
You can add custom tags to an incident, for example, to flag a group of incidents with common characteristics. You can later filter the incidents queue for all incidents that contain a specific tag.


