Insight and automation with projects
Now let's talk about how Projects can provide you with insights and how to make life a bit easier with automation.
Insights with Projects
In this section, you learn about:
- Insights and how they can be useful.
- Current charts and historical charts.
- Creating and customizing charts.
Insights and how they can be useful
Insights with Projects enables you to view, create, and customize charts that use items added to your Project as source data. When you create a chart, you set the filters, chart type, and information displayed. The chart is available to anyone who can view the Project. You can generate two types of charts: current charts and historical charts. Let's dive into the differences between the two.
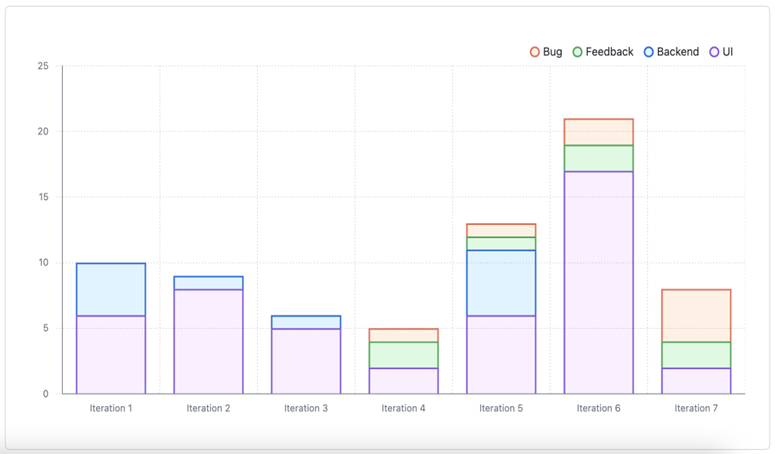
Current charts
You can create current charts to visualize your Project items. For example, you can create charts to show the number of items assigned to each individual, or the number of issues assigned to each upcoming iteration.
You can use filters to manipulate the data used to build your chart. For example, you can create a chart showing how much upcoming work you have, but limit those results to particular labels or assignees.
Historical charts
Historical charts are available with GitHub Team and GitHub Enterprise Cloud for organizations. Historical charts are time-based charts that allow you to view your Project's trends and progress. You can view the number of items over time grouped by status and other fields. The default Burn up chart shows item status over time, allowing you to visualize progress and spot patterns.
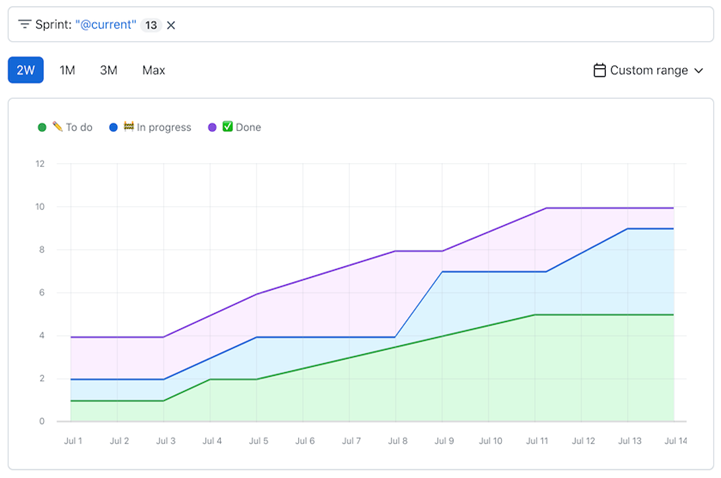
Screenshot example of a historic stacked area line graph showing the number of hours spent on to dos, in progress, and completed tasks during the month of July.
Create and customize charts
Follow these steps to create a new chart:
- Navigate to your Project.
- In the top-right, select the line graph button. When you hover over the button, the Insights label appears.
- In the menu on the left, select New chart.
- Filter by keyword or field to change the data used to build the chart.
- To the right of the filter text box, select Save.
Now that you created a new chart, let's customize your new chart to fit your needs.
- In the menu on the left, select the chart you'd like to configure.
- On the right side of the page, select Configure, and a panel opens.
- Select the Layout dropdown to change the type of chart you want to use.
- Select the X-axis dropdown and choose the field you want to use.
- Optionally, select Group by to group items on your X-axis. Choose the field you want to use or None to disable grouping.
Automation with Projects
Let GitHub do some of the work for you by automating your Project. There are three different ways you can do so:
- Built-in automated workflows
- GraphQL API
- GitHub Actions with workflows
The easiest way to automate your Project is built-in workflows. GraphQL and Actions give more control over customizing automation. In the following sections, you learn how to utilize Project's built-in automation and briefly go over GraphQL API and GitHub Actions automation.
Configure built-in workflows
Built-in workflows help you stay aware of all your work. Your Project takes newly created issues or pull requests and automatically puts them into your Project with a Todo status. Here's how to enable:
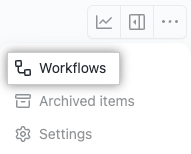
In the top-right corner of your Project, select the three dots menu and choose Workflows.
In the left column, under Default workflows, select Item added to project.
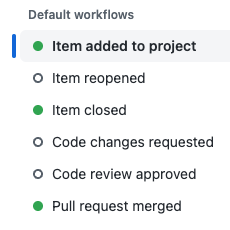
Screenshot of the menu to enable workflows once an action occurs. Options include Item added to Project, Item reopened, Item closed, Code changes requested, Code review approved, Pull request merged with Item added to Project highlighted.
Select the Edit button to make changes to the workflow.
In the When an item is added to the project section, ensure that both issues and pull requests are selected.
In the Set Value section, select Status:Todo.
Select Save and turn on workflow.
Congratulations, you automated your Project!
GitHub Actions with workflows
GitHub Actions enables the most customization for your Project's automation. You can use GitHub Actions to automate your project management tasks by creating workflows. Each workflow contains a series of tasks that are performed automatically every time the workflow runs. An example workflow triggers upon issue creation that adds a label, leaves a comment, and moves the issue to a project board.
An issue creation triggers a workflow that adds a label, leaves a comment, and moves the issue to a project board.
Learn more about automating workflows for your Project in the article Automating Projects using Actions at the end of this module.
GraphQL API
If you're using GraphQL in GitHub, you can utilize an API to help automate your Project. For more information on using GraphQL API, see the article, Using the API to Manage Projects at the end of this module.