Optimize performance of an Azure AI Search solution
Your search solutions performance can be affected by the size and complexity of your indexes. You also need to know how to write efficient queries to search it and choose the right service tier.
Here, you'll explore all these dimensions and see steps you can take to improve the performance of your search solution.
Measure your current search performance
You can't optimize when you don't know how well your search service performs. Create a baseline performance benchmark so you can validate the improvements you make, but you can also check for any degradation in performance over time.
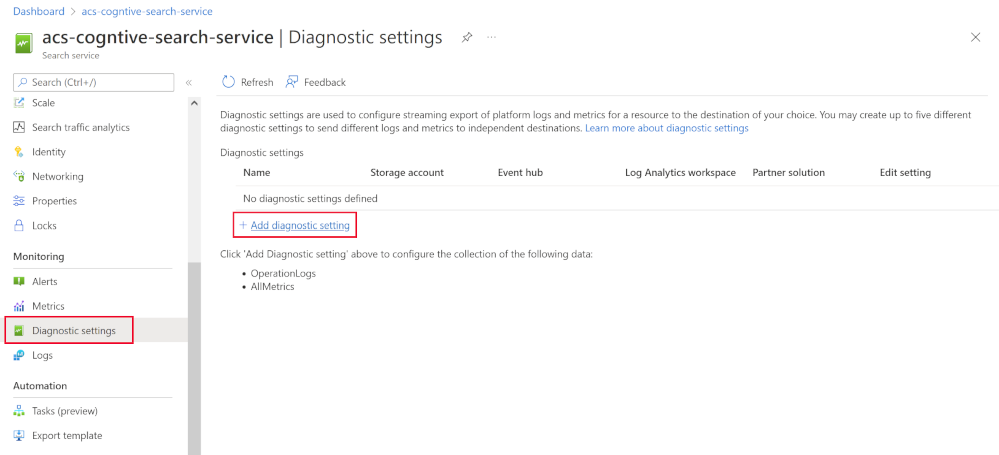
To start with, enable diagnostic logging using Log Analytics:
- In the Azure portal, select Diagnostic settings.
- Select + Add diagnostic settings.
- Give your diagnostic setting a name.
- Select allLogs and AllMetrics.
- Select Send to Log Analytics workspace.
- Choose, or create, your Log Analytics workspace.
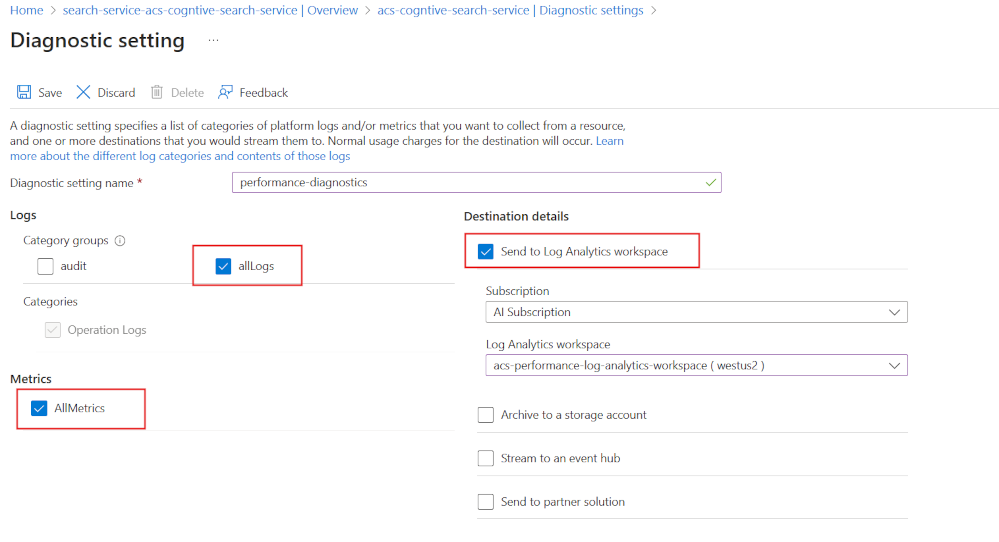
It's important to capture this diagnostic information at the search service level. As there are several places where your end-users or apps can see performance issues.
If you can prove that your search service is performing well, you can eliminate it from the possible factors if you're having performance issues.
Check if your search service is throttled
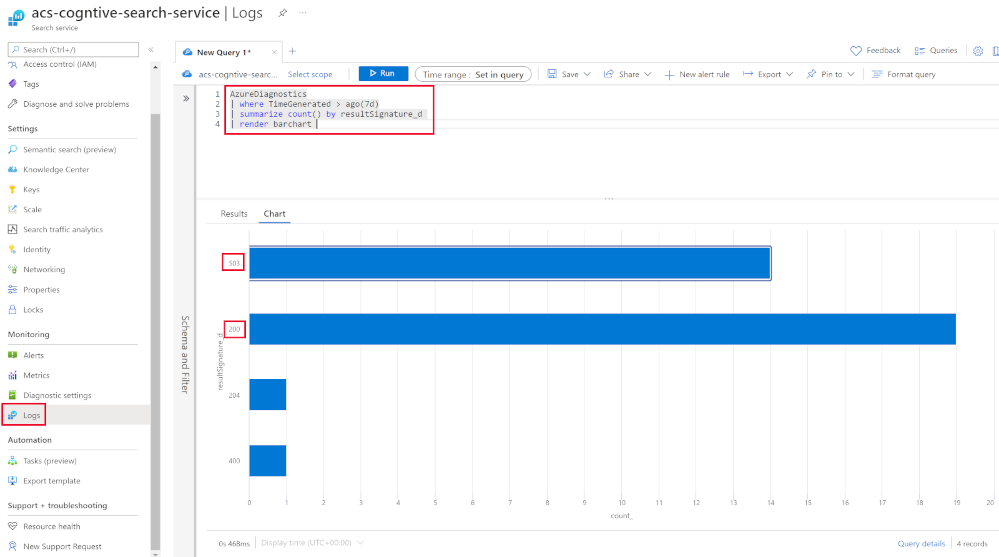
Azure AI Search searches and indexes can be throttled. If your users or apps are having their searches throttled, it's captured in Log Analytics with a 503 HTTP response. If your indexes are being throttled, they'll show up as 207 HTTP responses.
This query you can run against your search service logs shows you if your search service is being throttled.
In the Azure portal, under Monitoring, select Logs. In the New Query 1 tab, you would use this query:
AzureDiagnostics
| where TimeGenerated > ago(7d)
| summarize count() by resultSignature_d
| render barchart
You'd run the command to see a bar chart of your search services HTTP responses. In the above, you can see there have been several 503 responses.
Check the performance of individual queries
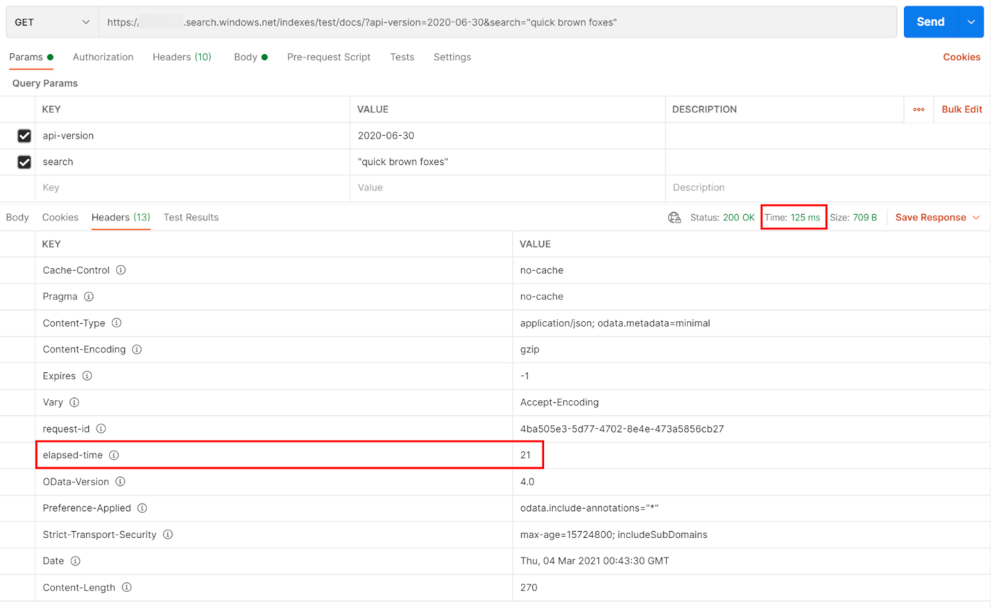
The best way to test individual query performance is with a client tool like Postman. You can use any tool that will show you the headers in the response to a query. Azure AI Search will always return an 'elapsed-time' value for how long it took the service to complete the query.
If you want to know how long it would take to send and then receive the response from the client, subtract the elapsed time from the total round trip. In the above, that would be 125 ms - 21 ms giving you 104 ms.
Optimize your index size and schema
How your search queries perform is directly connected to the size and complexity of your indexes. The smaller and more optimized your indexes, the fast Azure AI Search can respond to queries. Here are some tips that can help if you've found that you've performance issues on individual queries.
If you don't pay attention, indexes can grow over time. You should review that all the documents in your index are still relevant and need to be searchable.
If you can't remove any documents, can you reduce the complexity of the schema? Do you still need the same fields to be searchable? Do you still need all the skillsets you started the index with?
Consider reviewing all the attributes you've enabled on each field. For example, adding support for filters, facets, and sorting can quadruple the storage needed to support your index.
Note
Having too many attributes on a field limits its capabilities. For example, in a field that's facetable, filterable, and searchable, you can only store 16 KB. Whereas a searchable field can hold up to 16 MB of text.
If your index has been optimized but the performance still isn't where it needs to be, you can choose to scale up or scale out your search service.
Improve the performance of your queries
If you know how the search service works, you can tune your queries to drastically improve performance. Use this checklist for writing better queries:
- Only specify the fields you need to search using the searchFields parameter. As more fields require extra processing.
- Return the smallest number of fields you need to render on your search results page. Returning more data takes more time.
- Try to avoid partial search terms like prefix search or regular expressions. These kinds of searches are more computationally expensive.
- Avoid using high skip values. This forces the search engine to retrieve and rank larger volumes of data.
- Limit using facetable and filterable fields to low cardinality data.
- Use search functions instead of individual values in filter criteria. For example, you can use
search.in(userid, '123,143,563,121',',')instead of$filter=userid eq 123 or userid eq 143 or userid eq 563 or userid eq 121.
If you've applied all of the above and still have individual queries that don't perform, you can scale out your index. Depending on the service tier you used to create your search solution, you can add up to 12 partitions. Partitions are the physical storage where your index resides. By default, all new search indexes are created with a single partition. If you add more partitions, the index is stored across them. For example, if your index is 200 GB and you've four partitions, each partition contains 50 GB of your index.
Adding extra partitions can help with performance as the search engine can run in parallel in each partition. The best improvements are seen for queries that return large numbers of documents and queries that use facets providing counts over large numbers of documents. This is a factor of how computationally expensive it's to score the relevancy of documents.
Use the best service tier for your search needs
You've seen that you can scale out service tiers by adding more partitions. You can scale out with replicas if you need to scale because of an increase in load. You can also scale up your search service by using a higher tier.
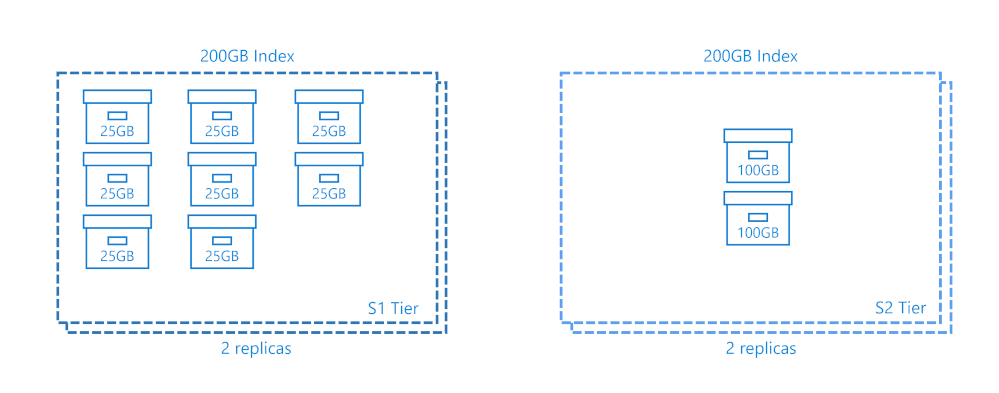
The above two search indexes are 200 GB in size. The S1 tier is using eight partitions and the S2 tier only has two. Both of them have two replicas, and both would cost approximately the same. Choosing the best tier for your search solution requires you to know the approximate total size of storage you're going to need. The largest index supported currently is 12 partitions in the L2 tier offering a total of 24 TB.
| Tier | Type | Storage | Replicas | Partitions |
|---|---|---|---|---|
| F | Free | 50 MB | 1 | 1 |
| B | Basic | 2 GB | 3 | 1 |
| S1 | Standard | 25 GB/Partition | 12 | 12 |
| S2 | Standard | 100 GB/Partition | 12 | 12 |
| S3 | Standard | 200 GB/Partition | 12 | 12 |
| S3HD | High-density | 200 GB/Partition | 12 | 3 |
| L1 | Storage Optimized | 1 TB/Partition | 12 | 12 |
| L2 | Storage Optimized | 2 TB/Partition | 12 | 12 |
Which of the above two tiers in the above example do you think performs the best? You've seen that scaling out gives performance benefits due to parallelism. However, the higher tiers also come with premium storage, more powerful compute resources and extra memory. Choosing the second option gives you more powerful infrastructure and allows for future index growth. Unfortunately which tier performs the best depends on the size and complexity of your index and the queries you write to search it. So either could be the best.
Planning for future growth in the use of your search solution means you should consider search units. A search unit (SU) is the product of replicas and partitions. That means the above S1 tier is using 16 SU and the S2 tier is only 4 SU. The costs are similar as higher tiers charge more per SU.
Think about needing to scale your search solution because of the increased load. Adding another replica to both tiers increase the S1 tier to 24 SU but the S2 tier only rises to 6 SU.
