How Microsoft Defender for IoT works
In this unit, we'll describe how Microsoft Defender for IoT works behind the scenes.
Flexible deployment
Defender for IoT supports multiple and flexible deployment solutions:
- Cloud deployments: OT sensors, deployed on physical or virtual appliances, connect to Defender for IoT in the Azure portal. Use the Azure portal to manage your sensors and sensor data and to integrate with other Microsoft services like Microsoft Sentinel.
- Air-gapped networks: Deploy Defender for IoT fully on-premises and connect to an on-premises security information and event management (SIEM) system. You can integrate with Microsoft Sentinel directly, or with a range of partner SOC tools, such as Splunk, IBM QRadar, and ServiceNow.
- Hybrid deployments: To work in a hybrid environment, you can manage your on-premises sensors locally and still connect to a cloud-based SIEM, such as Microsoft Sentinel.
Defender for IoT sensors
Defender for IoT sensors are deployed on-premises as a virtual or physical appliance. They discover and continuously monitor network devices and collect industrial control system (ICS) network traffic.
Sensors use passive—or agentless—monitoring for IoT/OT devices. The sensors connect to a SPAN port or network TAP to run deep-packet inspection on IoT/OT network traffic.
All data collection, processing, analysis, and alerting occurs directly on the sensor machine, which makes the process ideal for locations with low bandwidth or high-latency connectivity. Only the metadata is transferred to the Azure portal for management.
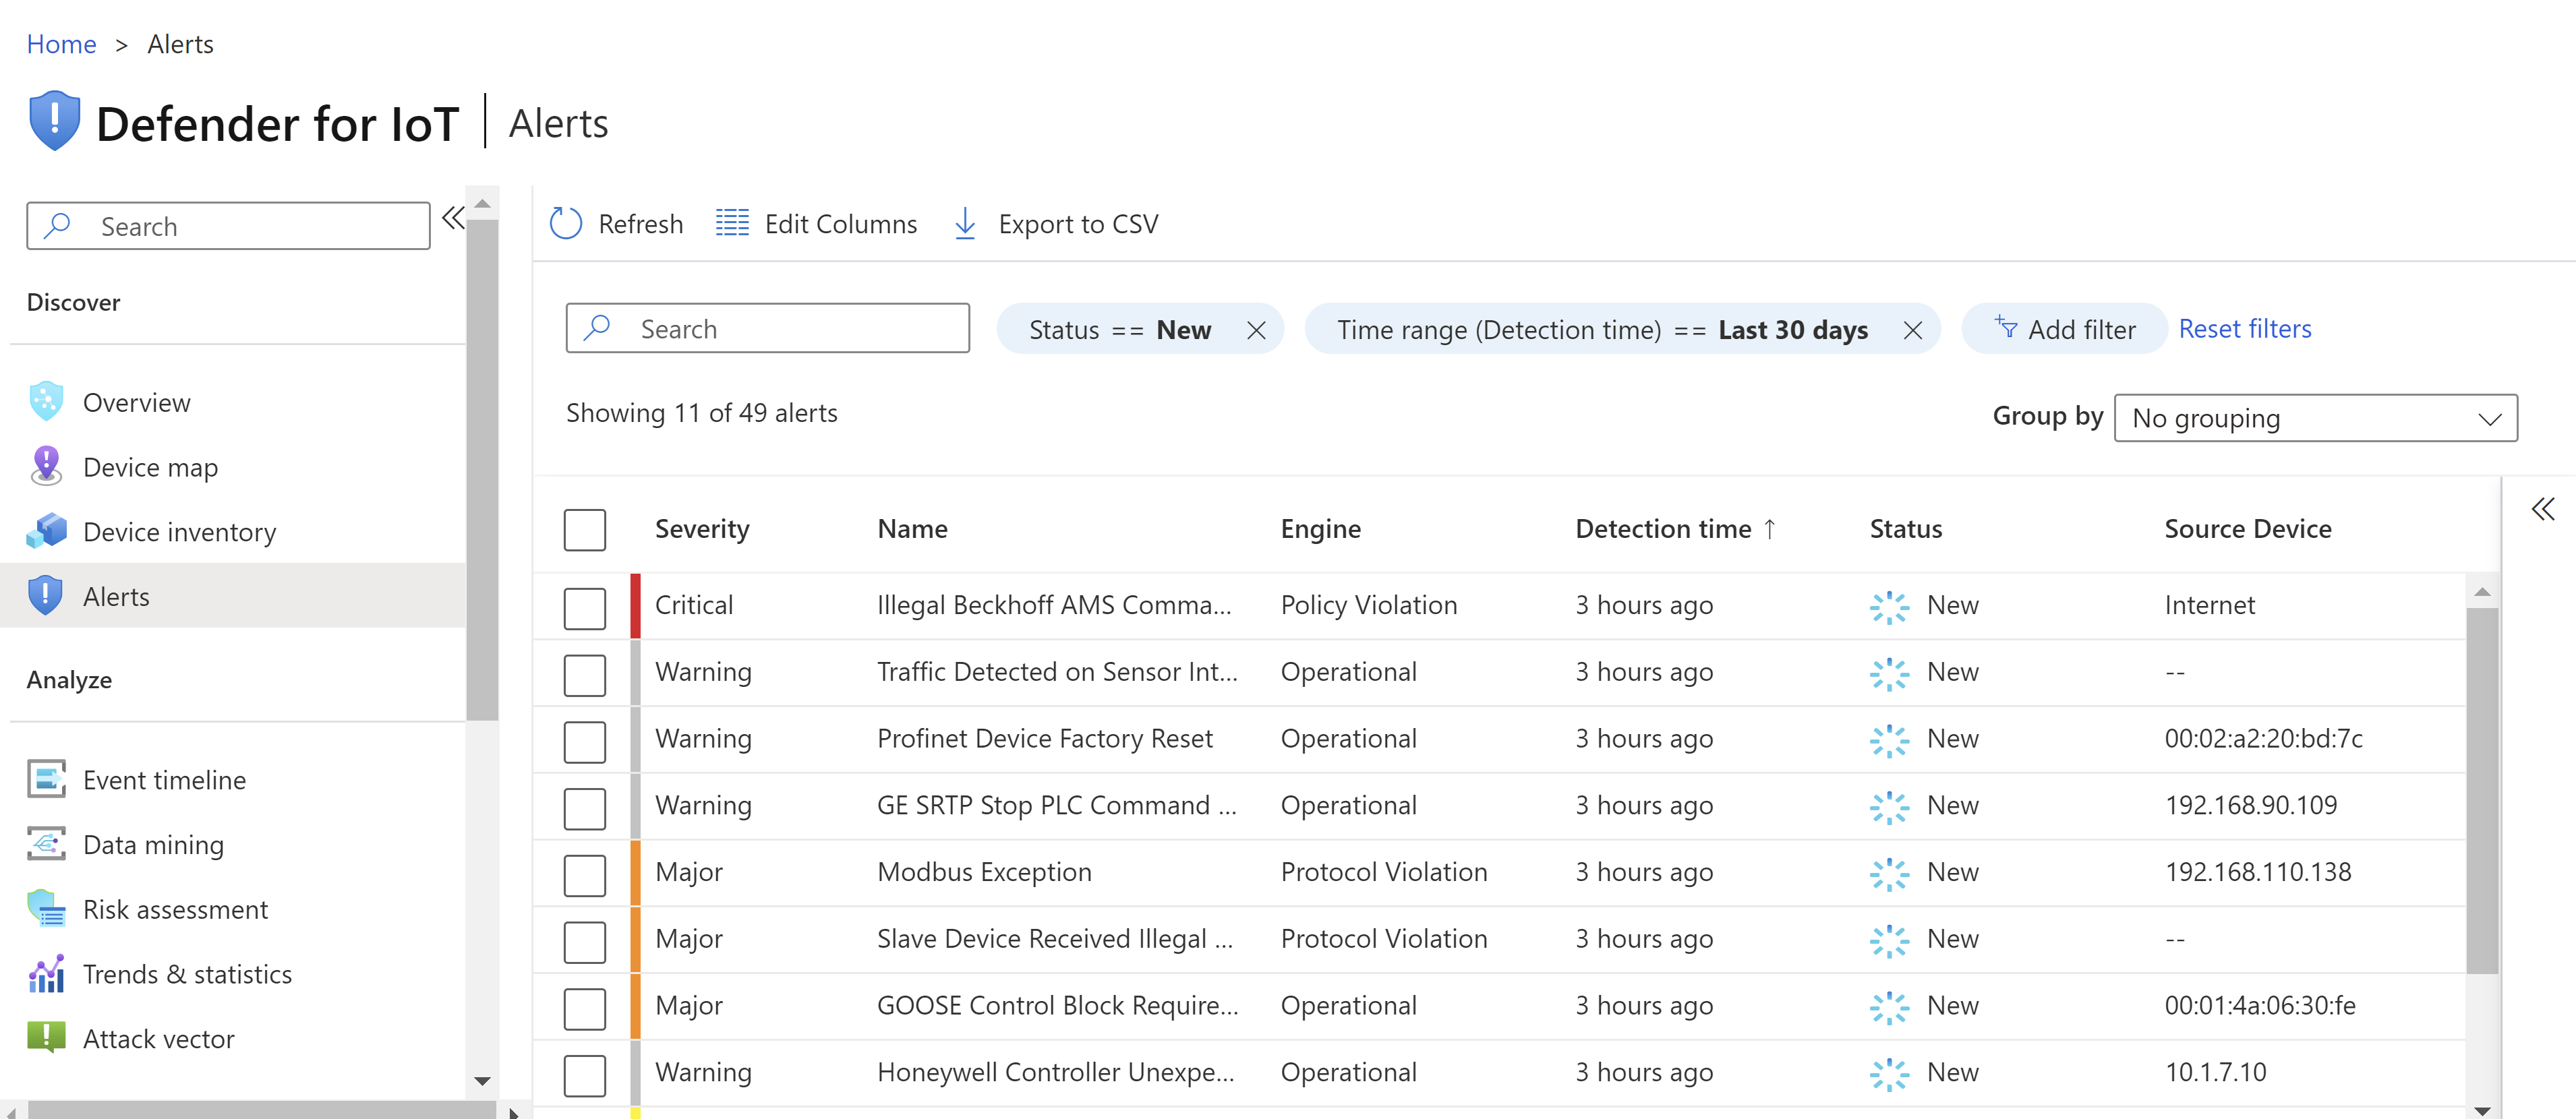
The following image shows a sample screenshot from the Alerts page on a sensor console. It shows the alerts triggered by the devices attached to this sensor.
Defender for IoT machine learning engines
Self-learning—or machine-learning—analytics engines in Defender for IoT eliminate the need for updating signatures or defining rules. Defender for IoT engines use ICS-specific behavioral analytics and data science to continuously analyze OT network traffic for:
- Anomalies.
- Malware.
- Operational problems.
- Protocol violations.
- Baseline network activity deviations.
Defender for IoT sensors also include five analytics detection engines that trigger alerts based on analysis of both real-time and prerecorded traffic:
- Policy violation detection engine: Uses machine learning to alert on deviations in baseline behavior, such as unauthorized use of specific function codes, access to specific objects, or changes to device configuration. Examples include DeltaV software version changed, firmware changes, and unauthorized PLC programming alerts.
- Protocol violation detection engine: Identifies the use of packet structures and field values that violate ICS protocol specifications. Examples include Modbus exceptions and initiation of an obsolete function code alerts.
- Malware detection engine: Identifies behaviors that indicate the presence of known industrial malware. Examples include Conficker, Black Energy, Havex, WannaCry, NotPetya, and Triton.
- Anomaly detection engine: Detects unusual machine-to-machine communications and behaviors. Examples include excessive SMB sign-in attempts or PLC scans.
- Operational incident detection engine: Detects operational issues like intermittent connectivity, which can indicate early signs of equipment failure. For example, when a device is unresponsive and might be disconnected, alerts might be sent with a Siemens S7 stop PLC command.
