Learn about .NET Aspire tools
.NET Aspire adds tools to the Visual Studio user interface to helps you create and manage cloud-native apps. These tools can ease confusion because it's clear what integrations make up your complete app, even though they run in different containers. The .NET Aspire dashboard also presents a unified view of your running app, with diagnostic and monitoring data to help you test and debug it.
Consider the imaginary outdoor clothing and equipment company scenario again. Your development teams completed their architecture designs for each microservice and want to begin development. You want to understand how they can work with .NET Aspire in Visual Studio and at the command line.
In this unit, you learn about the .NET Aspire tools and how they assist developers as they create and debug cloud-native apps.
Prerequisites
Before you install .NET Aspire, you need the following present on your computer:
- .NET 8.0.
- Docker Desktop or Podman for hosting containers.
- An Integrated Development Environment (IDE) such as Visual Studio, or a code editor such as Visual Studio Code.
If you use Visual Studio, you must install version 17.9 or higher.
Note
Docker Desktop or Podman is necessary to host the containers that .NET Aspire uses to run microservices and some backing services. Since .NET Aspire configures and compiles the images and containers for you, you don't need to be an expert in containers.
Install .NET Aspire
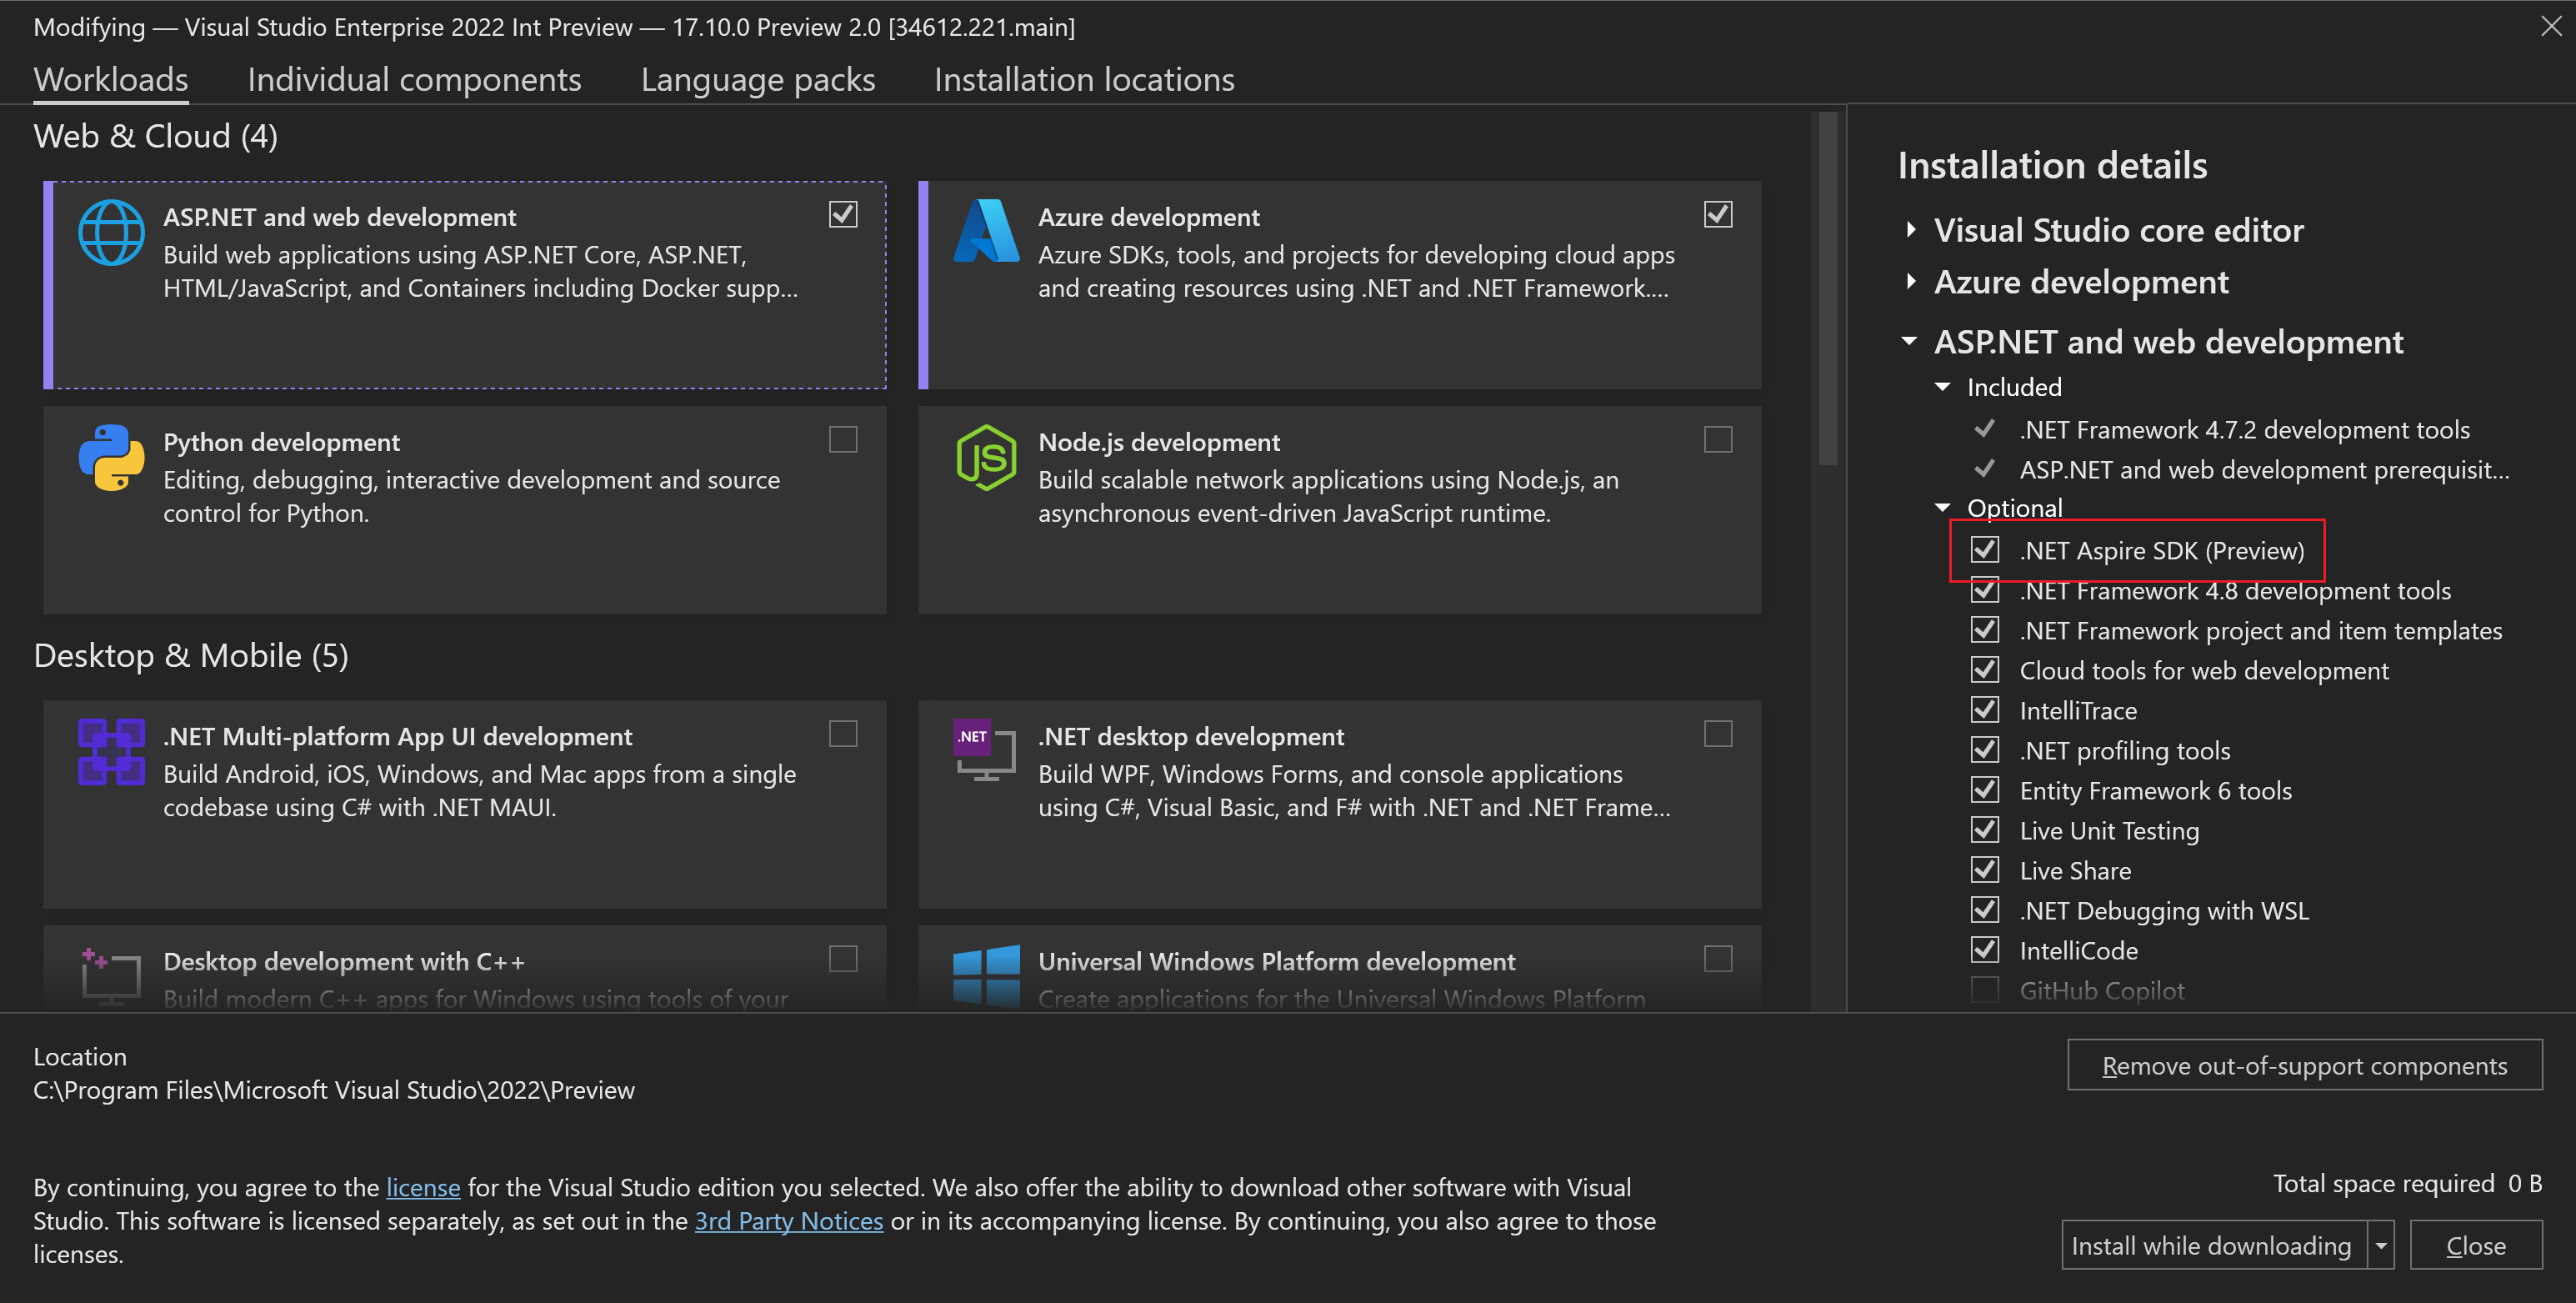
If you're using Microsoft Visual Studio, you can install .NET Aspire by adding the .NET Aspire SDK integration from the ASP.NET and web development workload. Once installed, new tools become available. Later in this module, you complete these steps in the exercise.
Alternatively, if you don't want to use the Visual Studio installer, you can use the .NET CLI to install .NET Aspire:
dotnet workload update
dotnet workload install aspire
dotnet workload list
Project templates in Visual Studio
Five .NET Aspire application templates are added. You can use them to create a new application:
- .NET Aspire Application: This template creates a minimal .NET Aspire solution with two projects present: The App Host project orchestrates the solution and the Service Defaults project manages reusable configuration details for resiliency, service discovery, and telemetry.
- .NET Aspire Starter Application: This template creates a complete solution. It includes the same App Host and Service Defaults projects as the previous template and adds projects for a back-end API service and a front-end web interface.
- .NET Aspire App Host: This template creates only the App Host project in a new solution. You can add microservices, libraries, and other projects to complete your app.
- .NET Aspire Service Defaults: This template creates only the Service Defaults project in a new solution.
- .NET Aspire Test Project: This template creates xUnit tests for the app host.
Note
You can also add .NET Aspire to any existing .NET web application you open in Visual Studio. In Solution Explorer, right-click the project, select Add and then select .NET Aspire Orchestrator Support. This action adds app host and service defaults projects to the solution and enrolls the existing project in them for service discovery and other .NET Aspire features.
The .NET Aspire dashboard
As you work on your application, you can use the Visual Studio debugger to run code by pressing the F5 key. When you select F5, Visual Studio automatically builds Docker images for each microservice, starts the Docker service if it isn't running, and runs the complete application. It also displays the .NET Aspire dashboard, which you can use to connect to microservices, investigate the app's performance, and monitor its behavior:
Important
The .NET Aspire project templates set the App Host project as the startup project for the solution. If you change the startup project, the .NET Aspire dashboard and other aspects of your solution won't function correctly during debugging.
In the dashboard's homepage, you can see all the resources that make up the application. Each microservice is listed as a Project. Backing services, such as Redis caches, are listed as Containers. Other integrations might be present as Executables. You can obtain more Details for each resource. Microservices also have an Endpoint column. Select the link in this column to connect to and test the resource in the browser.
There are four monitoring sections in the dashboard:
- Console logs: This page displays any text sent to standard output from the project you select at the top. Standard output is often used to report events or status messages.
- Structured logs: This page displays events generated by the OpenTelemetry library. Structured logs are easier to query than other log events because they preserve the message template and parameters.
- Traces: This page displays traces for each request received by your app. The details include the timestamp, when the trace completed, and the duration of the trace. The Spans column shows all the resources that were involved in the request. If you select View in the Details column, you can see a timeline that illustrates all the spans in the trace and their durations.
- Metrics: This page displays charts for any metric you select. First, choose a project at the top of the page. Then choose from the list of metrics, which include values like active request counts, request durations, connection counts, and other performance data. When you select a metric, a live chart is displayed. You can change the time interval for the chart or filter to drill down to more diagnostic information.

