Azure monitoring tools
Now that we have a deeper understanding of reliability and some useful framing for how to view it for monitoring, it's time to get practical. This unit introduces a product suite in Azure, and a specific tool in that suite that allows us to put this information to direct use.
Azure Monitor
Azure Monitor is a comprehensive platform for monitoring Azure resources to gain insights into your applications, infrastructure, and network. In this unit, we'll focus on the Azure Monitor tools that you can use to monitor and improve your reliability.
Data sources
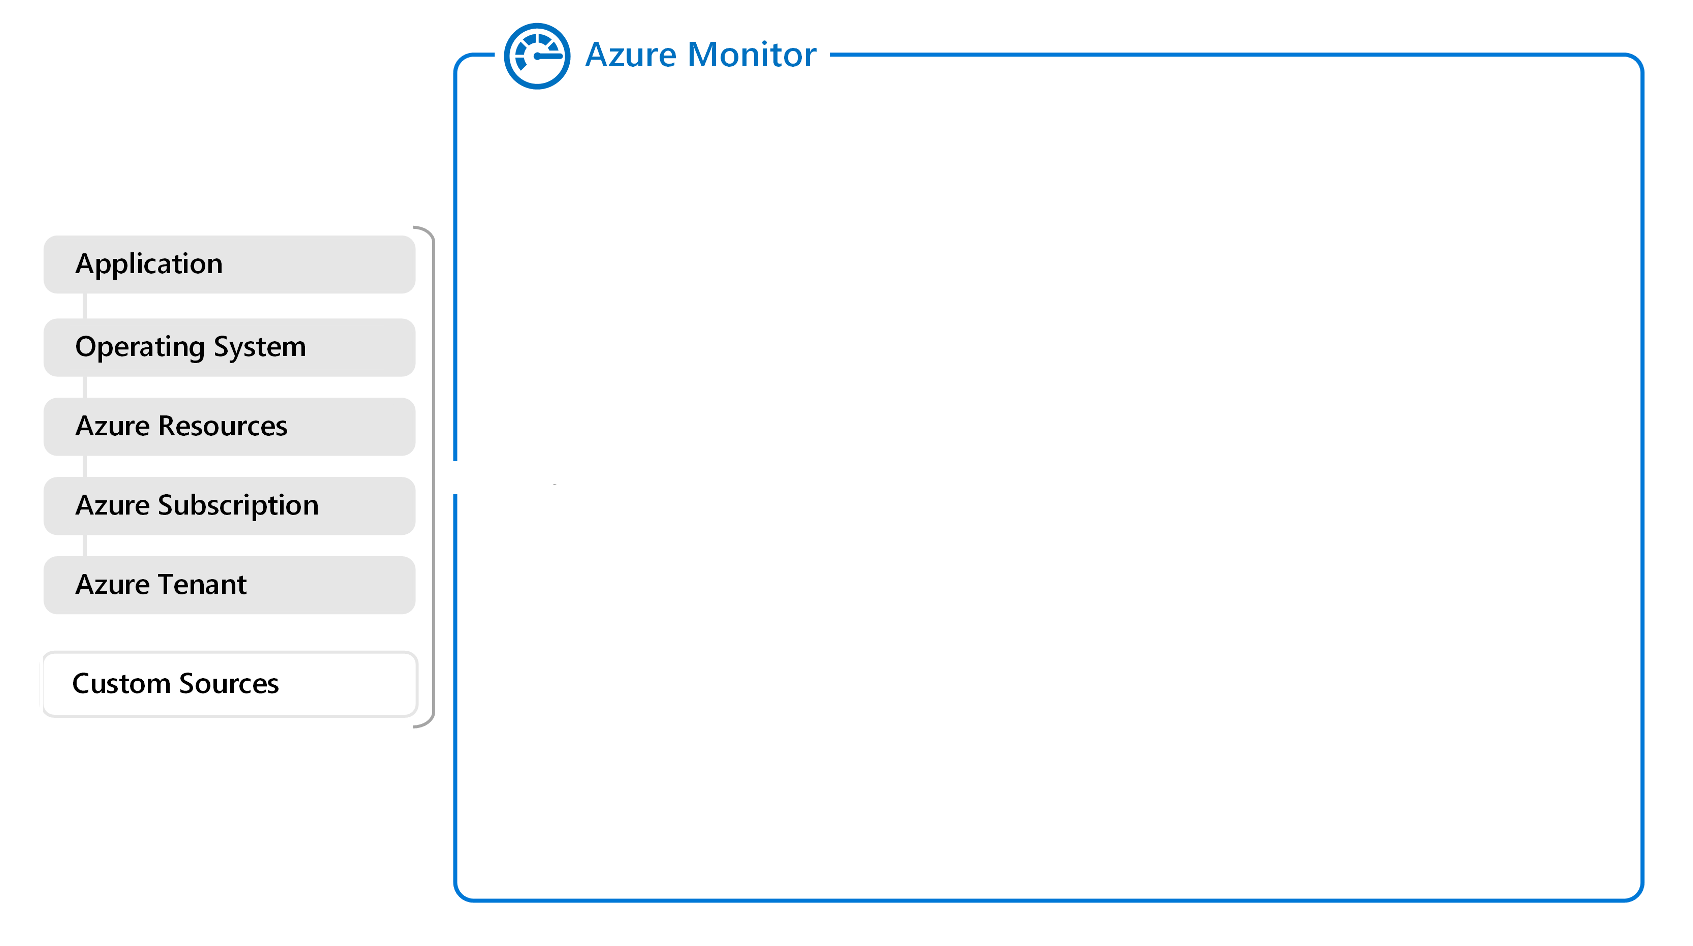
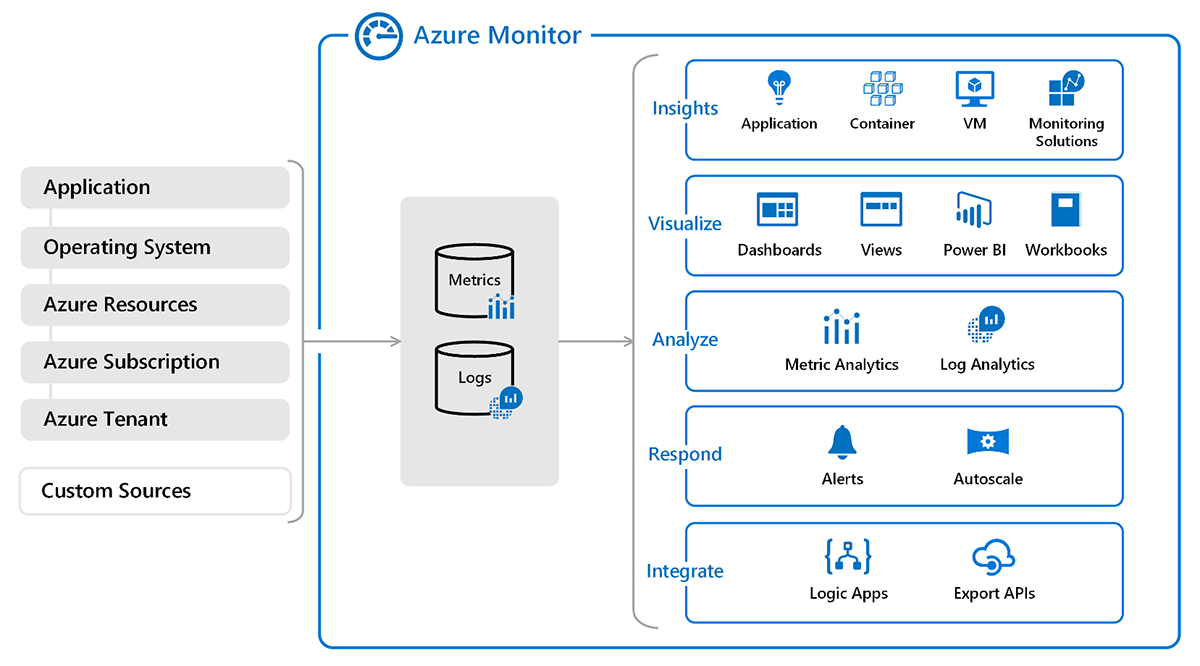
Azure Monitor starts with the data that comes into the system. It takes in data from a number of different sources. These include:
- Data from applications.
- Data from the various operating systems running in Azure.
- Information fed from Azure resources, subscriptions, and tenants.
- Custom data. If you’d like to send in monitoring-related data from your systems or applications—basically of any sort and from any source—Azure Monitor can take in that custom data.

Data types
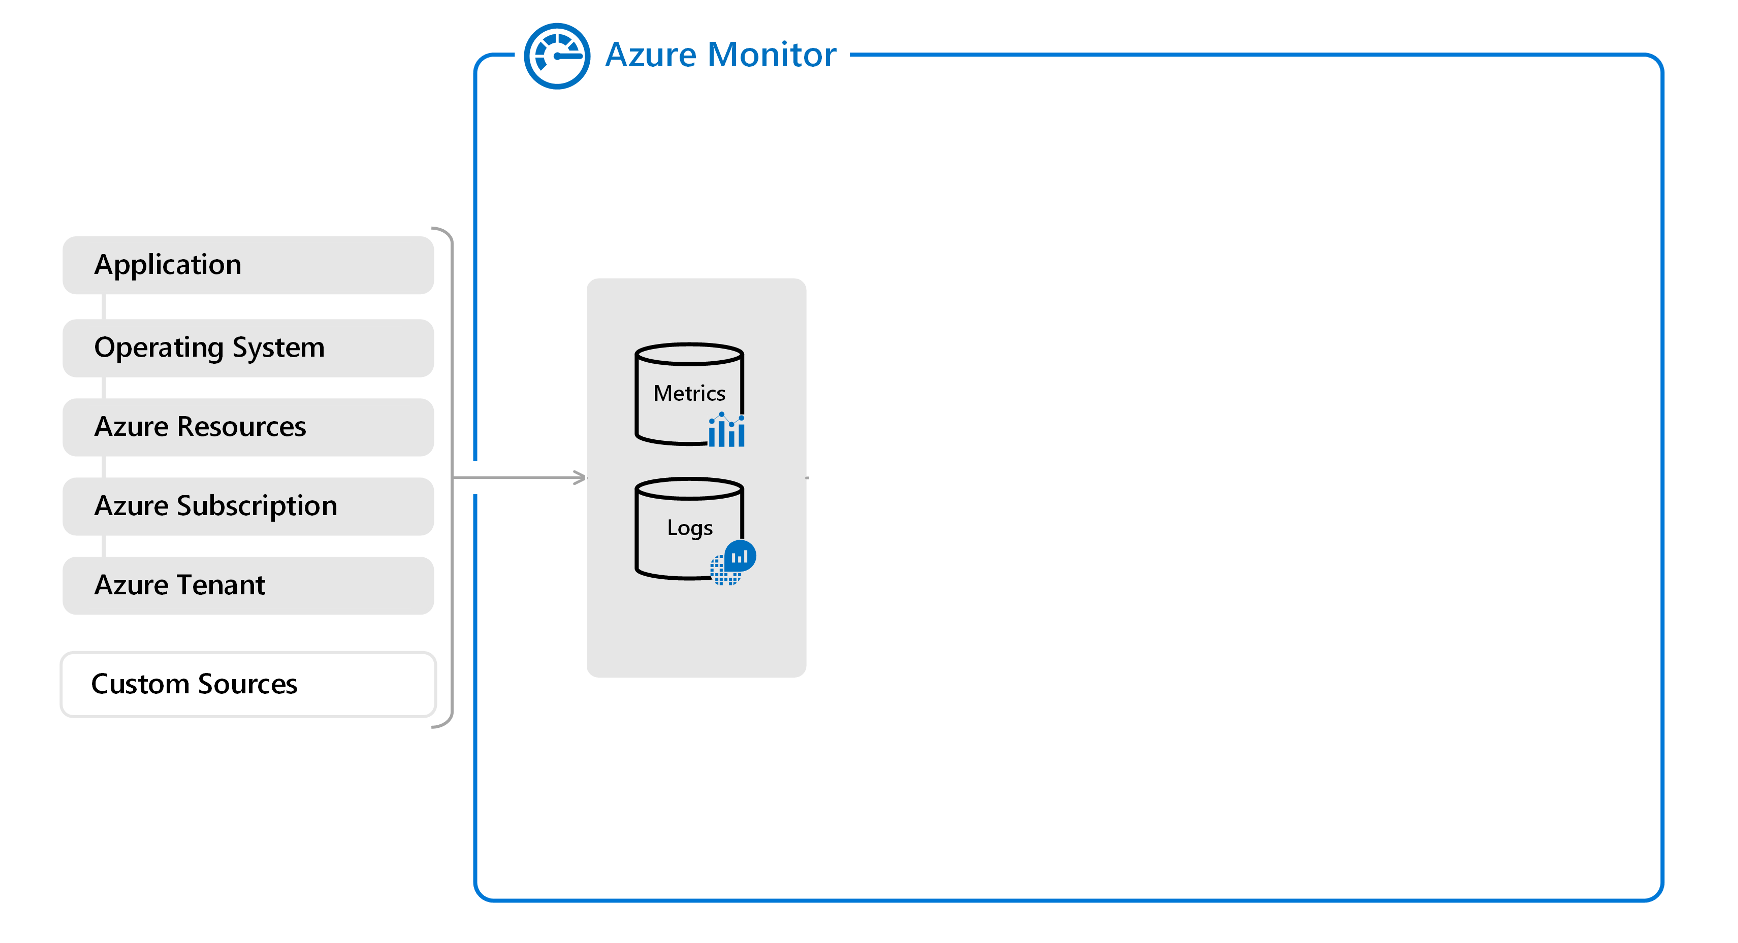
We can divide the data that comes into Azure Monitor into two types:
Metrics: Small numerical pieces of information from counters, gauges, and so forth that are collected on a regular basis.
Log data: Information gathered from many different logs, such as Windows event logs, Linux syslog, agents running on virtual machines, custom logs, telemetry from Application Insights, and more.
In this module, we'll focus primarily on log data.

Do something with the data
Once the data is in Azure Monitor, there's a suite of tools that lets us analyze, visualize, respond to specific contents, and integrate that data with other tools.

In our next unit, we're going to explore one of the most useful tools for working with reliability in more detail: Log Analytics.