IoT intelligence and insights
Supply Chain Management empowers users by offering Internet of Things (IoT) intelligence that supports several core insights and actions within the application. By connecting your equipment sensors to the Microsoft Azure IoT Hub, you can set up and manage your production scenarios in Supply Chain Management.
Production control and IoT
Within production control in Supply Chain Management there are several supported scenarios for IoT intelligence for notification services. These notifications allow users to act as needed. The IoT add-in helps facilitate the tracking and optimization of the overall equipment effectiveness in real time.
Each of the supported scenarios is explained in the following sections.
Delayed orders
Cases might occur where production orders are delayed for several reasons. With IoT, you can set up notifications and actions for managing the delayed production orders. You can display operations that have been impacted because of the delay, which will allow users to define order-delay metrics for different combinations of resources and products. A notification can then be sent to inform users of when exceptions for the thresholds occur. This approach also empowers you to take necessary actions for delayed orders and gives you the ability to view impact or create a maintenance request.
Equipment down
IoT intelligence can provide notification services and actions for managing when equipment might be out of operation. You can define metrics for machine-down thresholds and can notify users when an exception to the threshold occurs. This method also gives you the ability to take necessary actions for delayed orders, which can include viewing impact or creating a maintenance work order.
Quality anomaly
Notification services can be used for manager quality anomalies. You can define quality attributes for products and get notified when exceptions to these attributes occur.
No-code onboarding
The No-code onboarding feature provides a fast, code-free method for you to connect your machine to IoT intelligence service and get started with actionable insights.
Configure IoT intelligence for production control scenarios
Note
To use this feature, you must enable the IoT Intelligence feature in the Feature management workspace.
To get started with configuring IoT intelligence for production control scenarios, follow these steps.
- Go to Production control > Setup > IoT Intelligence > Scenario parameters.
- In the Scenario parameters page, you can set up parameters for your IoT scenarios.
Time series – On the Time series tab, paste your Redis cache in the Redis Metric Store Connection String. To access this string, follow these steps:
- Sign into the Azure portal.
- From the dashboard, select All services > Azure cache for Redis.
- Go to Settings > Access keys.
- Copy the value in the Primary connection string field.
- If no records are on this screen, you will need to create a Redis cache. For more information on this topic, go to Quickstart: Use Azure Cache for Redis with a .NET Framework application.
Important
Whenever you update your Redis cache, make sure that you update it in Supply Chain Management.
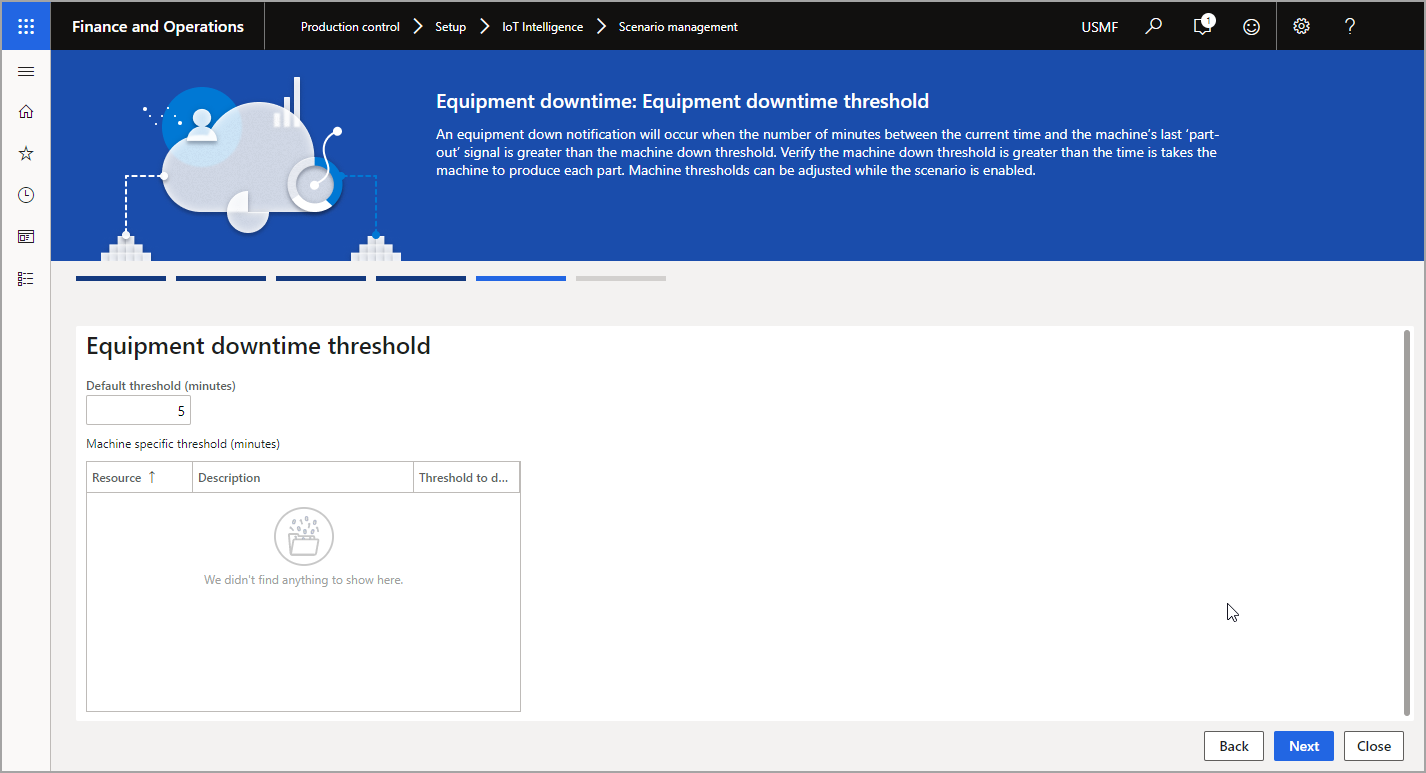
Equipment downtime – On the Equipment downtime tab, you can specify your default threshold in minutes for equipment downtime. This specification is the number of minutes that a machine needs to have to be considered in down time. You can then specify the threshold for each resource in the table.
Production delays – On the Production delays tab, you can specify production delay deviation thresholds for routes.
After you have configured your parameters and entered your Redis cache, you will need to configure the metrics.
- Go to Production control > Inquiries and reports > IoT Intelligence > Metric keys.
- Select Update in the Action Pane.
- Select OK to run the update. After the update is complete, all metric keys in the Redis cache are retrieved and added to the Metric keys list.
- Configure the resource status time series.
- Go to Production control > Manufacturing execution > Resource status.
- On the Resources status page, select Configure.
- In the Resource field, select the resource that you want to configure and monitor.
- Select the Edit icon for the Time series 1 field.
- Select a metric in the grid (you need to ensure that the metric keys are updated).
- Select OK to return to the Configure dialog box.
- Enter a Display name.
- Specify a time frame in the Show data from field.
- Select OK.
Scenario management
The Scenario management page in Supply Chain Management is where you can view and manage your IoT insights for production control.
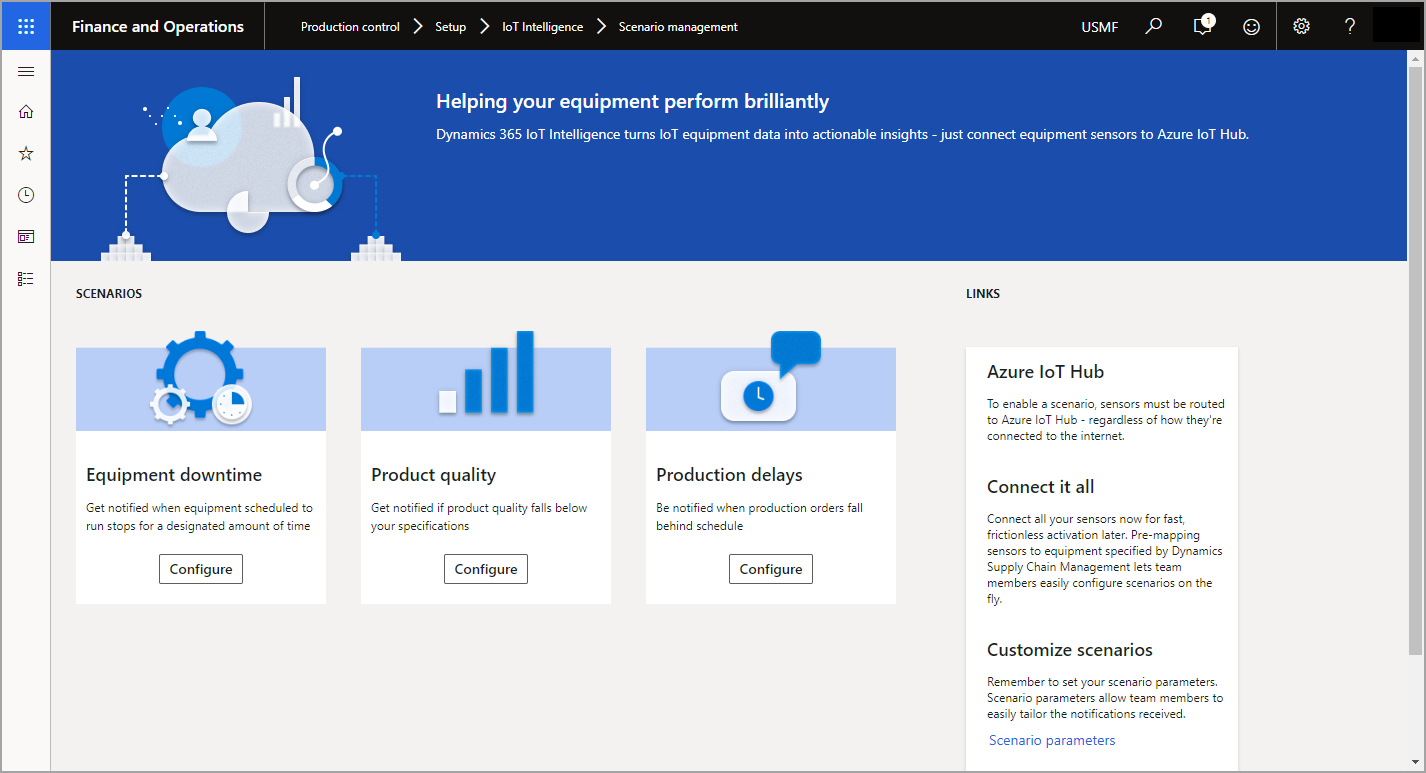
You can access the Scenario management page in Production control > Setup > IoT Intelligence > Scenario management. From this page, you can configure the scenarios previously mentioned.
To begin, select the scenario that you want to configure from the Scenario management page. The wizard will walk you through the setup for your scenario.
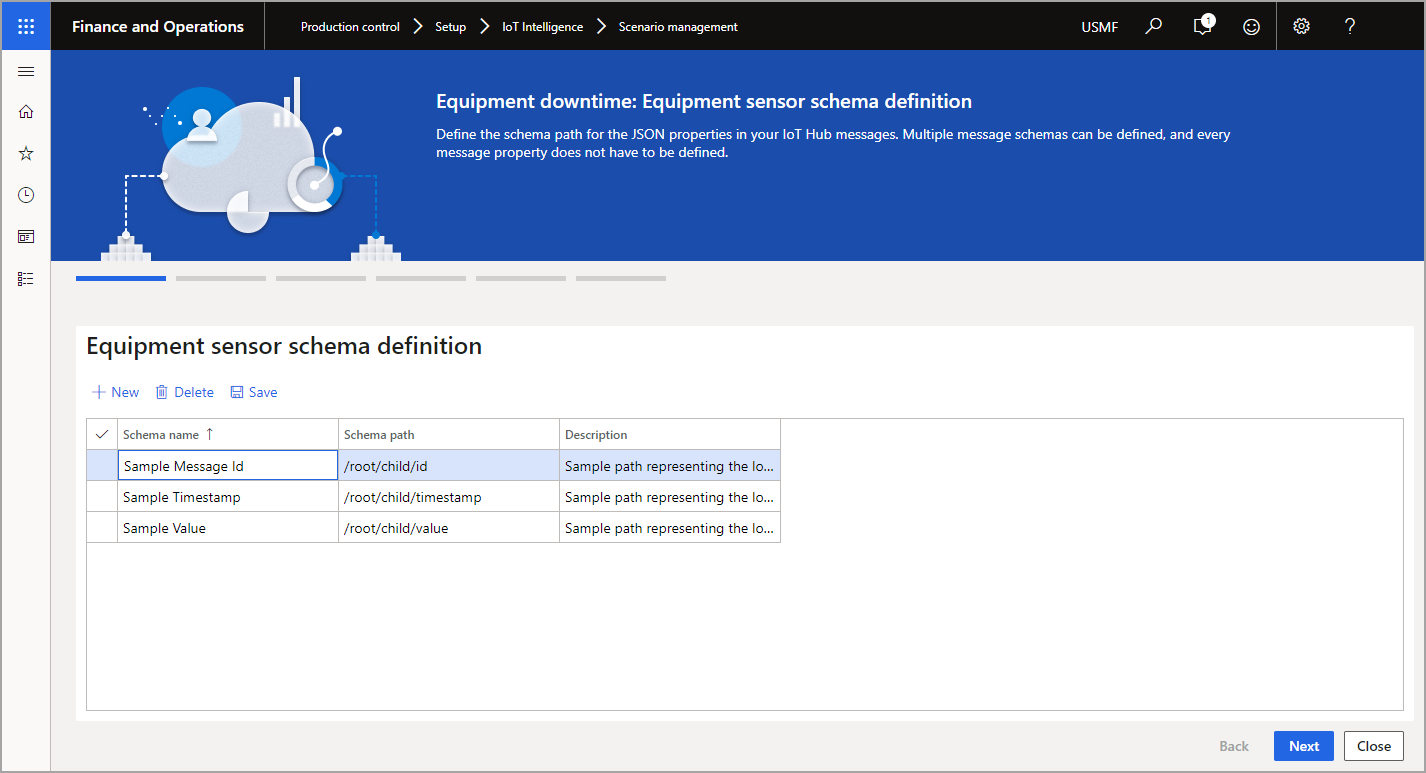
Define the schema path for the JSON properties in your IoT Hub messages.
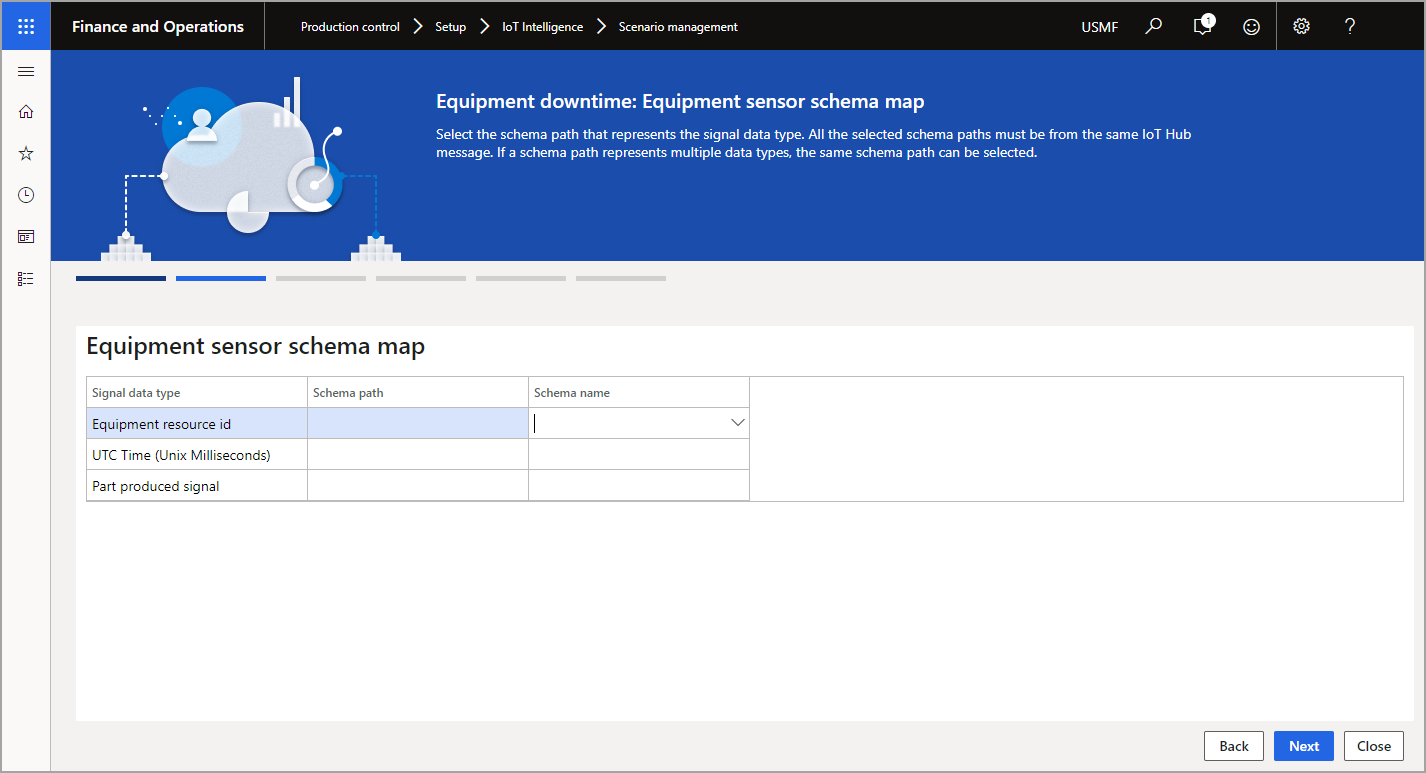
Select the schema path that represents the signal data type.
Define the equipment resource ID configuration for the selected schema path.
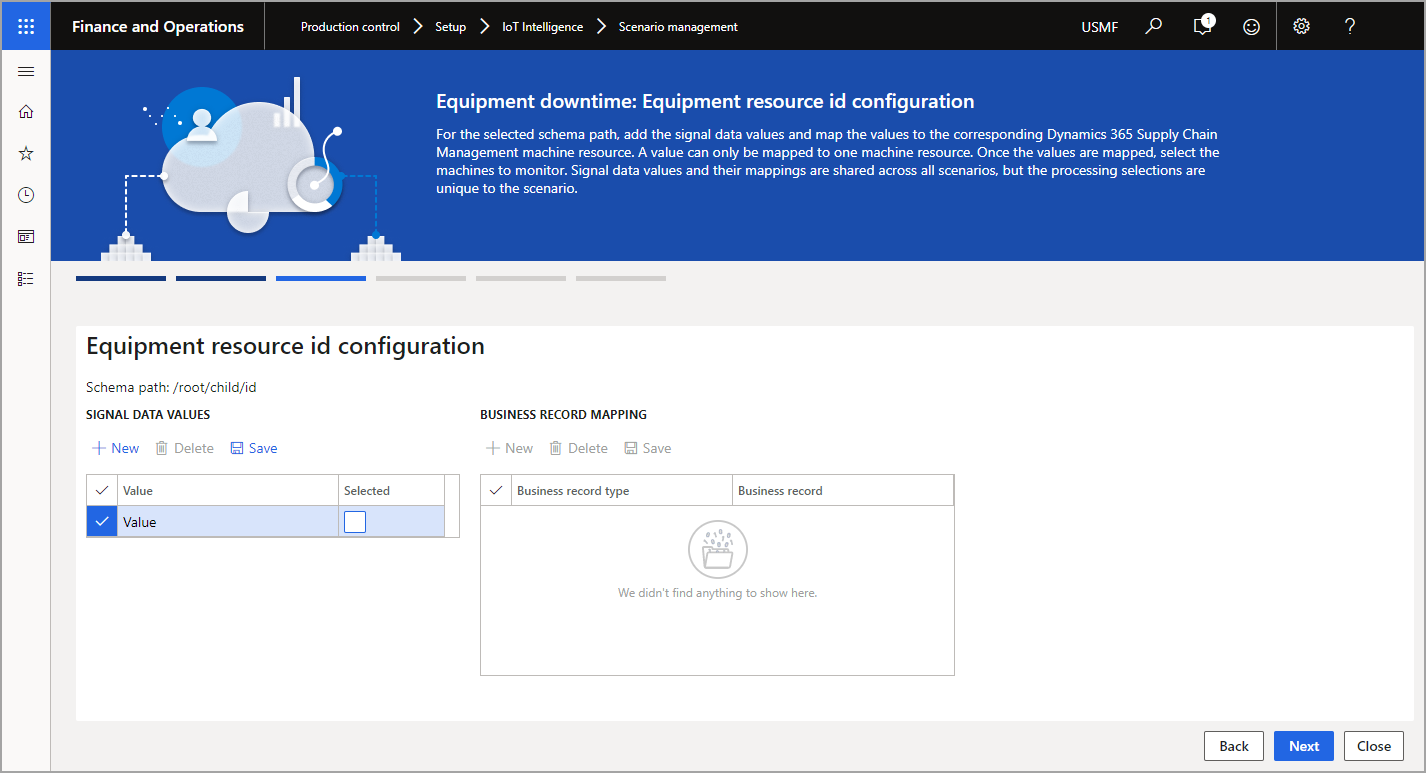
Add the signal data values that represent the mapped equipment’s part-out signals.

Set up the equipment downtime threshold. The notification will be sent when the number of minutes between the current time and the machine’s last part-out signals are greater than the machine down threshold.
Enable the scenario by setting the toggle switch to Yes in the final step of the wizard.
For more information on scenario configuration, go to Scenario setup for IoT Intelligence.