Collaborate and share in Power BI
The pains of version control are common. For example, working on a project with coworkers and ending up with 10 versions of the same report. Frequently, as you and your colleagues edit and update a report, you lose track of which, if any, is the most updated version.

Power BI simplifies collaboration and improves outcomes by allowing you and your colleagues to work simultaneously on the same dashboards and reports. And, while you and your colleagues explore the data and make changes to the reports and dashboards, the underlying data isn't affected.

With Power BI, you can collaborate with your colleagues in many ways. This unit focuses on three of these ways: sharing, commenting, and printing.
Tip
If you're unable to share with a colleague, it might be because of the type of Power BI license that you or your colleague have. Check with your Power BI administrator for help.
Sharing
This section explores how designers share content with consumers, and how consumers share content with others. Imagine that you're a regional sales manager working with other managers to prepare a presentation for senior leadership. You and your colleagues can work in Power BI from start to finish to collect, organize, analyze, and present your data-driven findings. Your team members can all use the same shared content and communicate with each other within the Power BI framework.
Step 1: Power BI designers share content with Power BI consumers
Before you begin working on the presentation, you need content from your designer coworkers. You can find this content through apps, dashboards, and reports. Designers can share this content with you and the other managers in several different ways:
- Share links to individual dashboards or individual reports.
- Send links to content.
- Install content in your Power BI.
- Post a Power BI app.
Designer shares a link to an individual report or individual dashboard
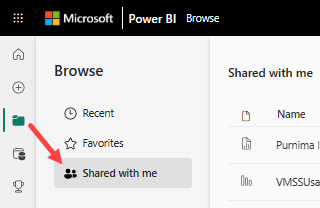
A designer can send you and the other managers a link by email. When you select the link and install, that dashboard or report shows up as Shared with me content. As explained in previous units in this module, shared content can be viewed from the nav pane > Shared with me and from the Home page.
Designer shares an app
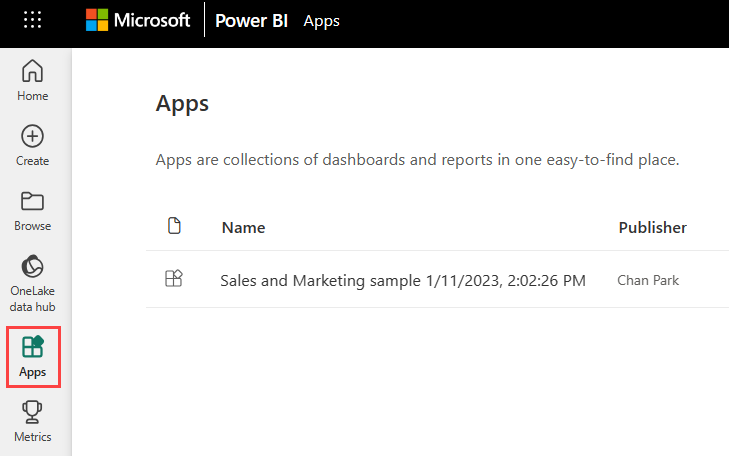
Sometimes, it's easier for a designer to package dashboards and reports into an app, which they share with you. With an app, all the related content is simple to find because it's all part of that single app. Designers can share apps by sending an installation link, by automatically installing the app in your Power BI workspace, or by posting the app on a web site where you can get it.
No matter how the app is shared, it shows up in Power BI under the Apps heading in the nav pane and on the Home page.
Now that the designer shared content with you and the other managers, it's time to start the project. Because the designer gave all managers access to the content, everyone can start working together to prepare for the big meeting.
However, another challenge you face is that you want help from other colleagues, but the designer didn't give them permissions to the content.
Step 2: Consumers share content with internal and external colleagues
As a Power BI consumer, you can also share content if the designer gave you reshare permissions.
If you decide to reshare any of this content, go to the My workspace tab in the navigation pane. If the Shared column contains the "share" icon, you can select the icon to share.
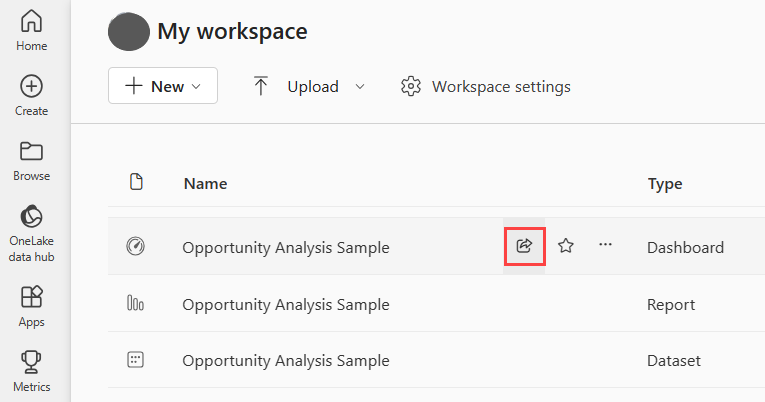
External colleagues are never able to reshare, even if the Allow recipients to share your report check box is selected.
Add comments to a dashboard
When a dashboard is shared, everyone with access to that dashboard can send messages to each other, right there on the dashboard, by using comments. The following scenario explains the process of adding comments.
In this scenario, Cassandra has created and shared a dashboard with her team. Instead of sending a chart and message in email, she shares a dashboard and adds a comment.
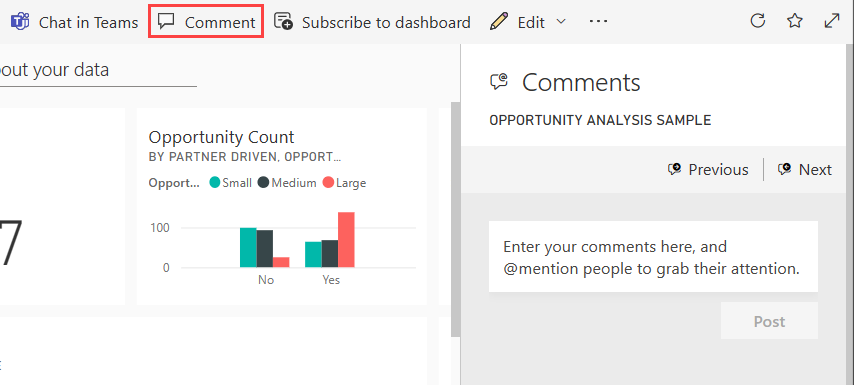
In preparation for the meeting on Monday, her entire team views the dashboard, reviews the updated version of the report, and continues the conversation on the dashboard canvas.
There are two types of comments: those about the dashboard in general and those about a specific visual. The chart icon lets you know that this comment is tied to a specific visual. Selecting the icon highlights the related visual on the dashboard.
![]()
Get your colleagues' attention
Whether you're commenting on the dashboard or on a particular visual, grab your colleagues' attention by using the at sign (@). When you type @, Power BI opens a drop-down list where you can search for and select individuals from your organization. Any verified name prefaced with @ appears in blue font.
Print from Power BI
A third way to collaborate and share is by printing. Occasionally, you might need to hand out printed copies of your Power BI dashboards and reports, such as when you're giving a talk at a conference, submitting regulatory documentation, or presenting somewhere without a network connection. To prepare, you want to print copies of the dashboards and reports, in addition to a few specific tiles and report visualizations.
Print a dashboard
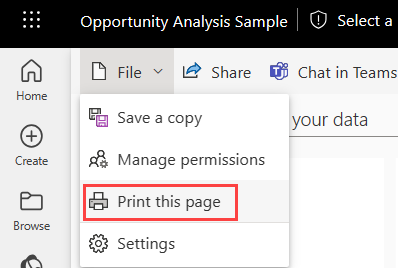
To print a dashboard, select File from the upper left corner of the menu and select Print this page.
Print a report
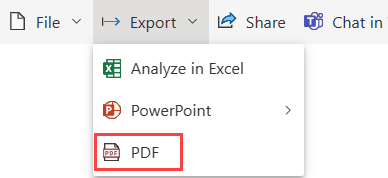
Reports can be printed one page at a time, or you can print all pages at once if you first export to PDF.
Print tiles and visuals
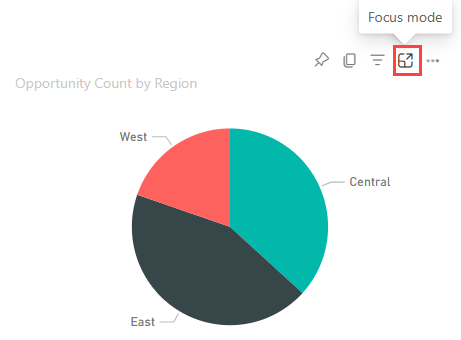
Tiles and visuals are found on dashboards and reports. To print a single tile or a single visual, you first need to open it by itself. You can use the focus mode and full screen mode to open a dashboard tile or a report visual by itself so that you can print it with File, Print this page.
Note
The print dialog that you see depends on which browser you use.
Export a Power BI report to PowerPoint
Another way to share a report with your team is to export it as a PowerPoint file. Each report page is a slide that includes links to the live report in Power BI.
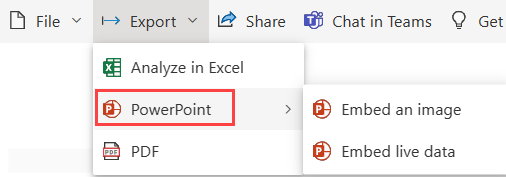
In Power BI, select a report to display on the canvas. You can also select a report from your Home page, Apps, or any other section on the nav pane. Select Export > PowerPoint from the menu bar in Power BI. You can choose Embed an image, which includes the current values in your report, or Embed live data, which exports the original report without the changes that you made.
When the export has finished, you can download the file, open it with PowerPoint, and then modify or enhance it just like you would any other PowerPoint deck.