Create and configure a dashboard
Dashboards in Power BI are one-page collections of visualizations that are created from within the Power BI service. You can create dashboards by pinning visuals from reports.
Video: Create a dashboard
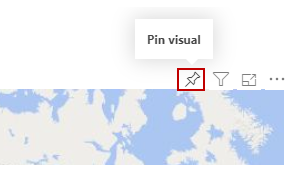
Pinning a visual to a dashboard is a lot like pinning a picture to a cork board on a wall, where the visual is pinned to a particular spot for others to see. To pin a visual, open its report on the Power BI service. Hover over the visual that you want to pin and select the pin icon.

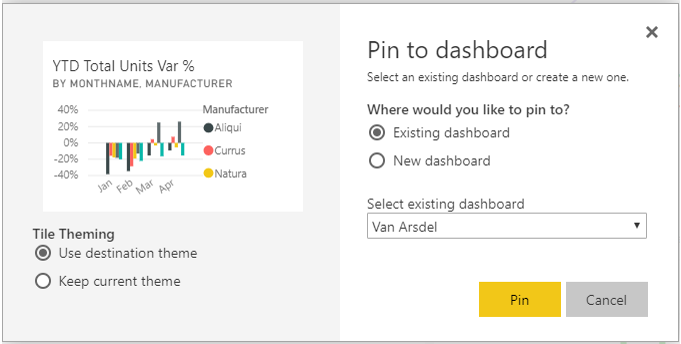
You can select a destination dashboard for the visual from the drop-down menu or create a new dashboard. You can pin visualizations from multiple reports and pages to a single dashboard, allowing you to combine different datasets and sources into a single page of insights.

On dashboards, you can add any sort of visualization, including graphs, maps, images, and shapes, by pinning them. After a visual has been pinned to a dashboard, it's called a tile.
Your dashboards appear in the navigation pane on the left side of the Power BI service. Select a dashboard from the list to view it.

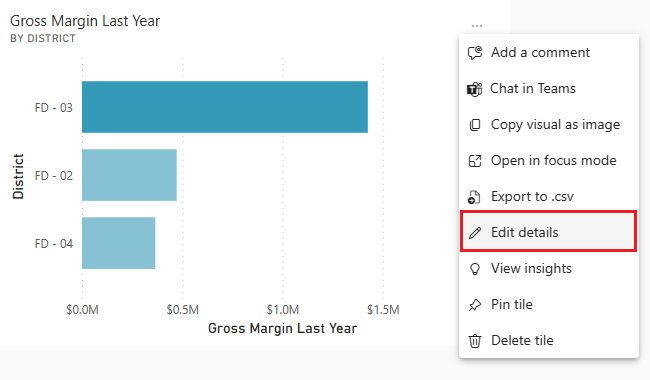
You can change the layout of visuals on a dashboard however you'd like. To resize a tile, drag its handles in or out. To move a tile, just select and drag it to a different location on the dashboard. Hover over a tile and select the pencil icon to open the Tile details form, where you can change information in the Title or Subtitle fields.

Select a dashboard tile to view the report from which it originated. You can also change that link by using the Set custom link field on the Tile details form.
You can pin tiles from one dashboard to another, for example, if you have a collection of dashboards and want to create one summary board. The process is the same: hover over the tile and select the pin icon. Dashboards are simple to create and to change. You can customize your one-page dashboard to show exactly the information that it should.
For more information, see Introduction to dashboards for Power BI designers.