Describe reporting and data visualization options in Dynamics 365 Customer Service
A typical contact center such as Contoso Coffee’s contact center can handle thousands of calls per day. While details of individual support cases are different, there are often similarities between cases. For example, one customer might have a problem with their coffee machine powering on, while another might report an issue with their machine not staying on. Even though they're different issues, they are both power related problems. Grouping cases based on similarities can provide your organization with a more accurate representation of emerging trends, resolution times, customer satisfaction and more. For example, if 25% of calls last week were power related issues, you might want to dive deeper into the calls.
You can further examine items such as:
How long on average are agents spending on these calls?
How does this compare to last week or past performance over a specific period?
- Does this represent an increase in volume, or is it in line with a normal week?
What else do we know about these cases?
By diving deeper, Contoso notices that 90% of the cases were related to machines not powering on. You can use this data to improve your organizational efficiency. After some research, it’s identified that it could be one of two issues:
Faulty Power Switch: A faulty power switch on the machine results in a short surge of power followed by the machine’s screen going black. Typically, in this case, a replacement machine needs to be sent out.
Faulty Power Cable: A faulty cable means that nothing happens at all when the customer attempts to power up the machine. This issue is easily resolved by sending the customer a new cable.
To help solve this issue, Contoso Coffee creates a customer service bot that includes trouble shooting steps for working through power related issues. If the product has a faulty power cable, the bot could assist the customer in sending out a replacement cable. If the product has a faulty power switch, the bot could transfer the customer to a live agent for more troubleshooting before sending out a replacement product. A simple measure such as this could reduce Contoso Coffee’s individual agent call volumes by 20% or more.
Insights dashboards for Customer Service and Dynamics 365 Contact center help you to better understand different factors that can help improve customer service for your organization. Charts, Key performance indicators (KPIs), and visual breakdowns of your organization's support cases are coupled with AI-generated insights on cases, agents, and topics that contribute to overall trends.
The insights dashboards cover Customer Service, Contact Center, and Knowledge Management. With the Customer Service dashboards, you can view a performance summary breakdown and examine detailed reports on your agents and topics. Similarly, the Contact Center dashboards provide a view into the support operation across channels. For knowledge managers, Knowledge Search analytics provide insight into search terms being used by agents to uncover content needed to resolve customer issues.
Artificial intelligence automatically groups your cases into topics using natural language understanding such as grouping defective product cases into a single topic. Topics allow you to discover and adapt to current and emerging trends, identify problem areas, and improve brand sentiment. By pinpointing and fixing issues before they impact customers, you can deliver better customer service experiences.
The AI driven technology facilitates informed decision-making related to improving resolution rates, reducing wait times, and decreasing customer service costs. You can use case resolution insights, backlog trends, and historical comparisons to evaluate agent performance and business impact, and address inefficiencies in your system.
Customer Service historical analytics reports
Summary: Provides a broad overview of the customer service experience in your organization. AI technology shows you topics that are generating the highest volume and emerging topics with the highest rate of change in volume.
Agent: The Agent dashboard shows charts and KPIs for individual agents and overall agent performance.
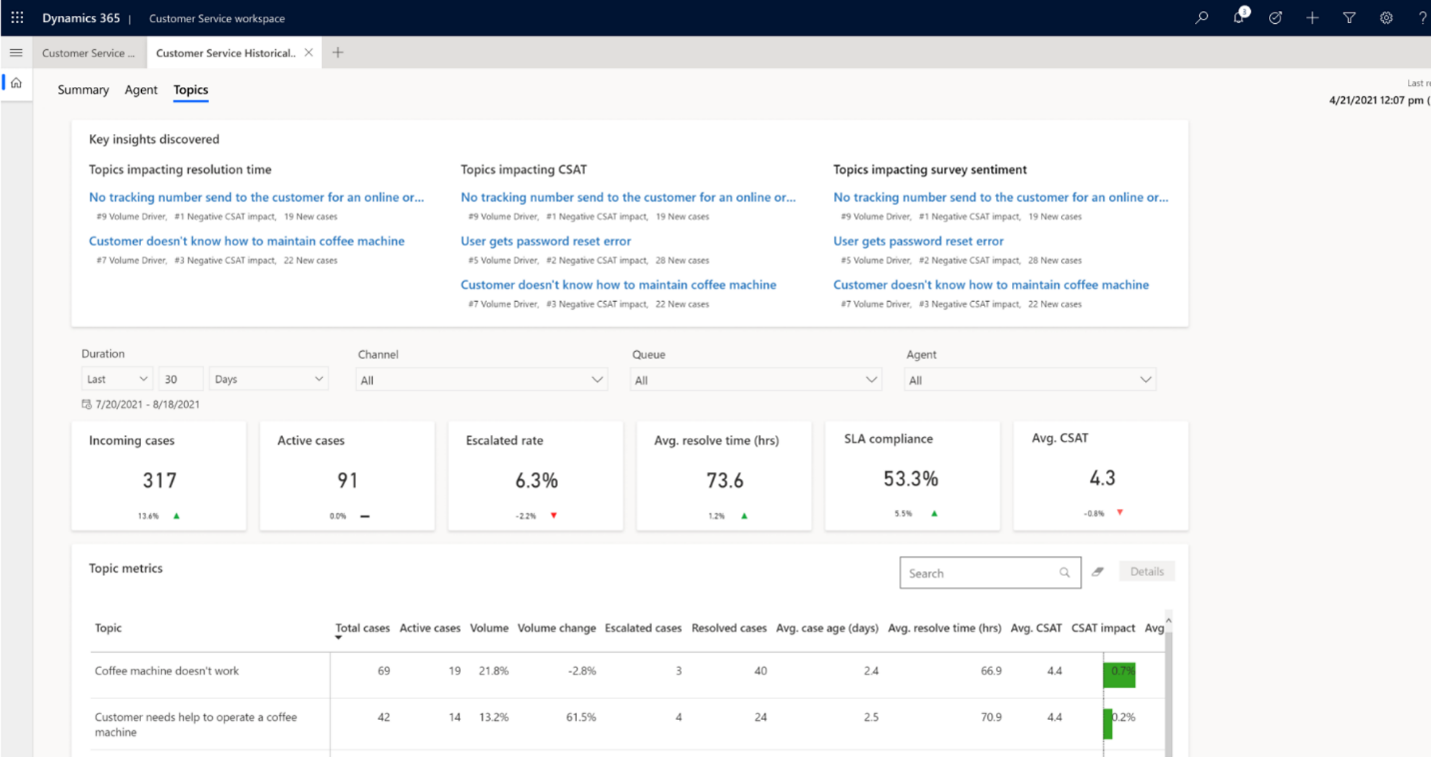
Case Topics: The Case Topics dashboard shows a detailed breakdown of cases and their assigned topics.
Omnichannel historical analytics reports
Conversation: The Conversation dashboard gives you a broad overview of the assisted support customer service experience in your organization.
Queue: The Queue dashboard gives you a broad overview of the customer service experience in your organization by providing insights into how specific queues are operating.
Agent: The Agent dashboard shows charts and KPIs that you can use to guide agents and understand overall agent performance.
Bot: The Bot dashboard shows charts and KPIs that you can use to understand how bots are playing a role in a support organization.
Conversation Topics: The Topics dashboard shows a detailed breakdown of conversations and their assigned topics.

