Remote debugging concepts
Visual Studio provides powerful remote debugging tools and features to troubleshoot applications running on other computers outside of your development environment. Most developers are familiar with the Visual Studio debugging tools while developing locally, but might not realize a similar experience is available for apps running in other environments. Here are some common scenarios for remote debugging:
- Connect to and debug an app hosted in one of many Azure services, such as app service instances or virtual machines
- Debug an app hosted from an on-premises server in IIS
- Debug an app running on another development machine to assist with troubleshooting
- Attach to a client-side process such as a web browser to debug code that runs outside of your local app context
- Debug an application running in a containerized environment separate from your development environment
In the upcoming exercises, you'll focus on the first scenario in this list to debug an app running in Azure App Service using Visual Studio. App Service is one of the most widely used Azure services and a powerful option to host .NET applications.
Understanding remote debugging tools
Remote debugging encompasses various Visual Studio tools and features. When you're remote debugging applications deployed on other servers or virtual machines, you might need to install the Visual Studio Remote Tools.
In the next exercise, you'll debug an app hosted Azure App Service, so there's no need to install the tools. In this scenario, many of these types of configurations are handled automatically. You can use Visual Studio's Attach to process feature to connect directly to an App Service process. Assuming the correct debugging symbols and source code are loaded, you can then debug the application as though it were running locally on your computer.
An overview of symbol files
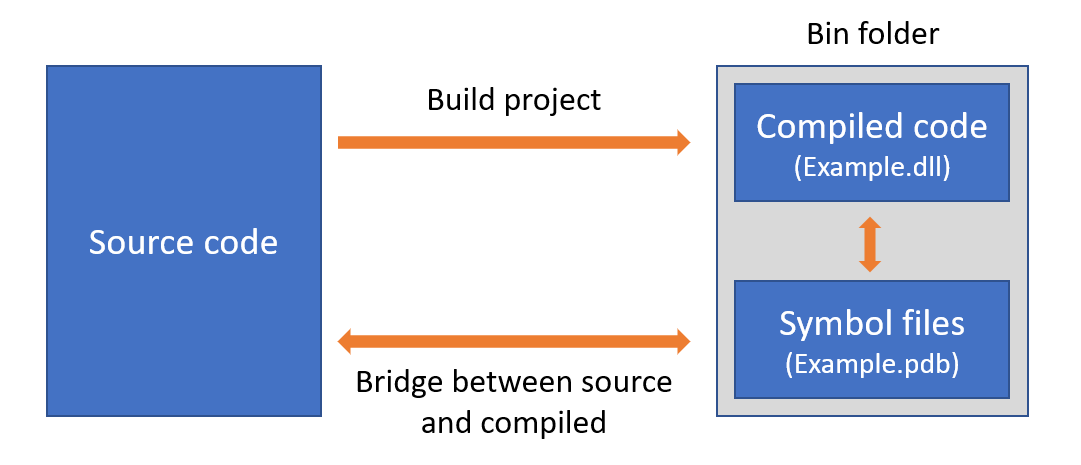
Visual Studio requires symbol files for your source code in order to debug an application running on other machines or environments. Symbol files are created in the bin directory as part of the build process, and end with a .pdb extension. In simplified terms, symbol files provide an instructional bridge between compiled code and source code. The Visual Studio debugger uses symbol files to step through your source code line by line while the compiled version executes. When you're running and debugging locally, Visual Studio is able to locate the generated symbol files automatically due to its default search locations for .pdb files.

When an application is compiled and deployed to Azure, Visual Studio doesn't automatically have access to the necessary symbol files, so you must provide a local copy of them during debugging. The local source code and symbol files must exactly match the deployed code so that the instructions line up correctly.