Monitor applications by using Application Insights
When issues arise on your financial organization's application, customers can't access their accounts. If the application issues aren't resolved quickly, customer satisfaction is negatively affected. Your organization wants to avoid these issues as it moves to Azure.
This unit describes how to integrate Azure Monitor Application Insights with your applications. You can use Application Insights to check the health of applications and resolve issues faster.
Use Application Insights to:
- Analyze and address issues and problems that affect your application's health and performance.
- Improve your application's development lifecycle.
- Assess your user experience and analyze users' behavior.
Integrate Application Insights with your applications
To integrate Application Insights with your applications, you can enable Application Insights in the Azure portal or instrument your application with Application Insights. Instrumentation refers to enabling the collection of monitoring data from your app by using an agent or an SDK. The approach to instrumentation varies depending on your application's language and platform.
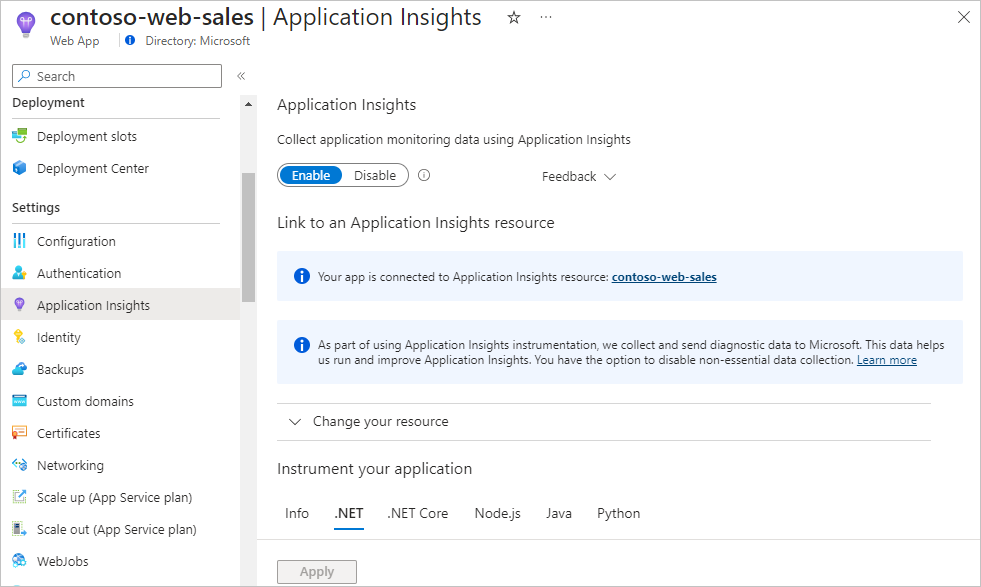
In many cases, you can implement instrumentation without access to application source code by using codeless attach in the Azure portal or by using an agent. For example, for your .NET and .NET Core applications hosted on Azure App Services, you can enable the collection of monitoring data with Application Insights by using a toggle in the Azure portal.
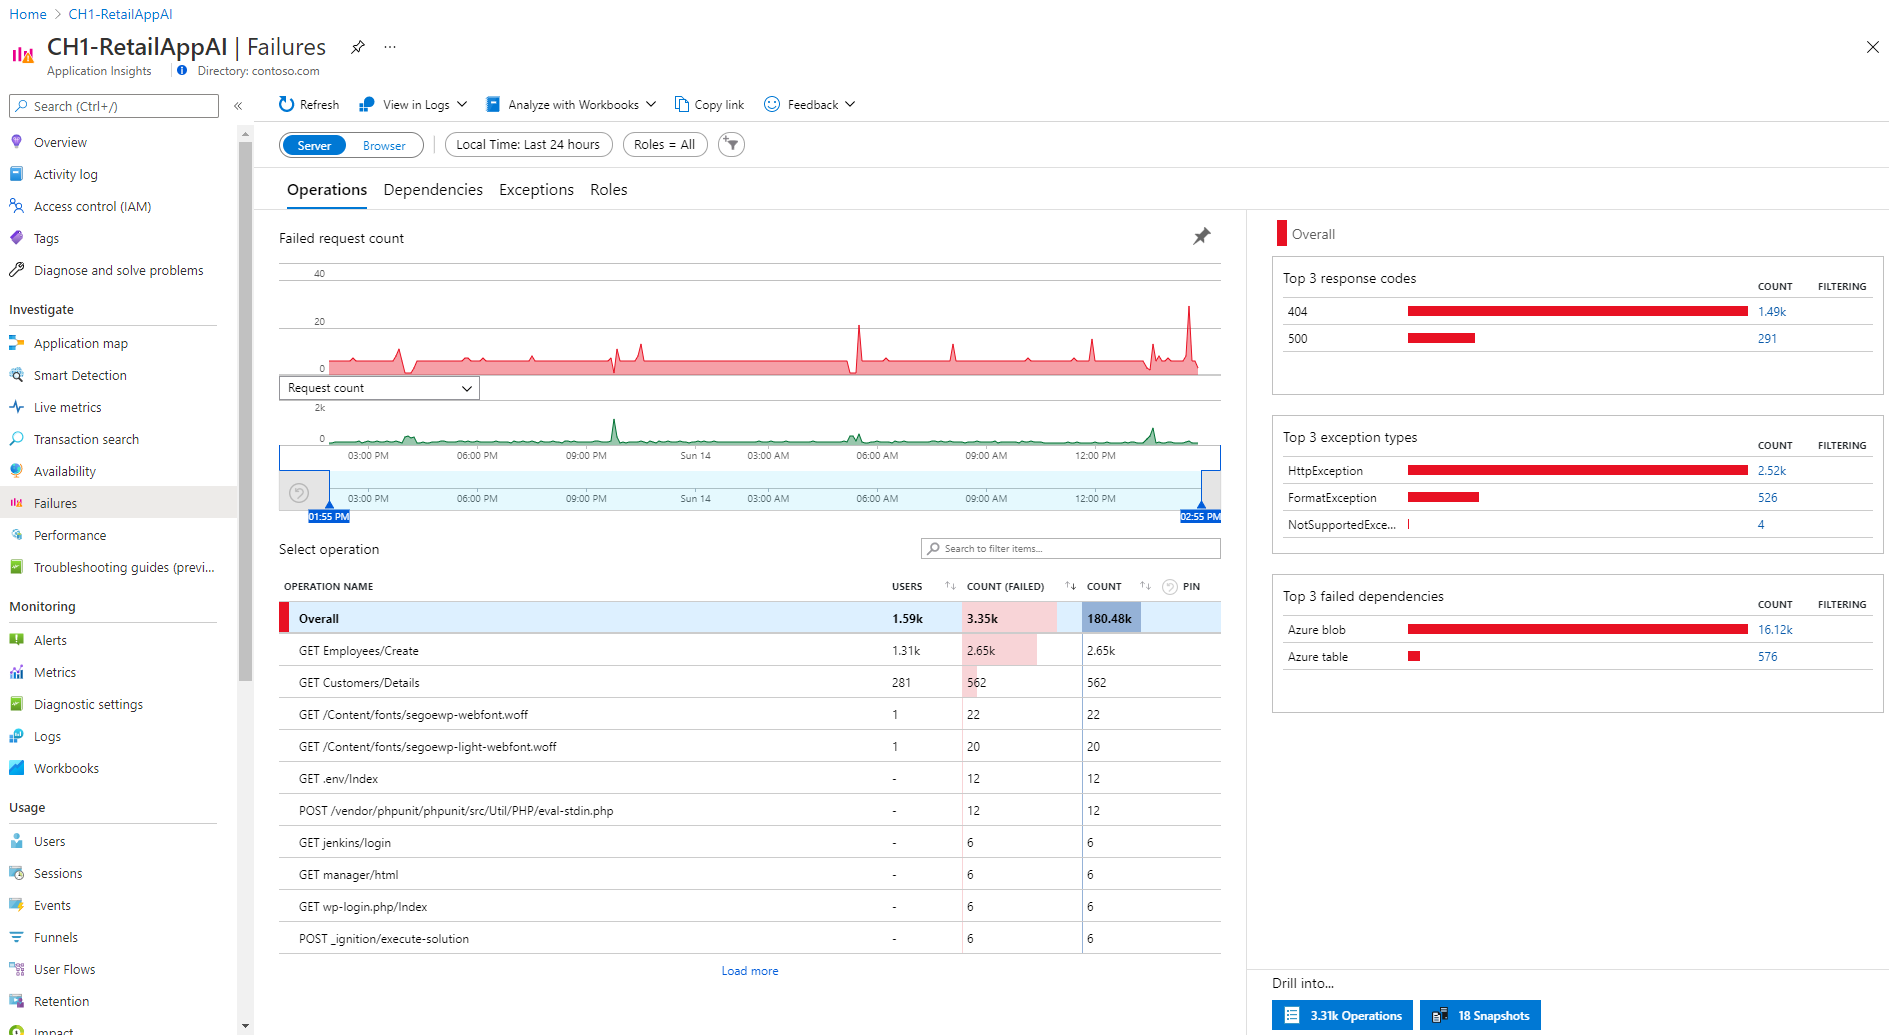
Application Insights automatically collects data about your application's performance and health, and displays this data in the Azure portal. You can select Failures in the Application Insights left navigation to get a list of all failures collected for your app and drill into each one.
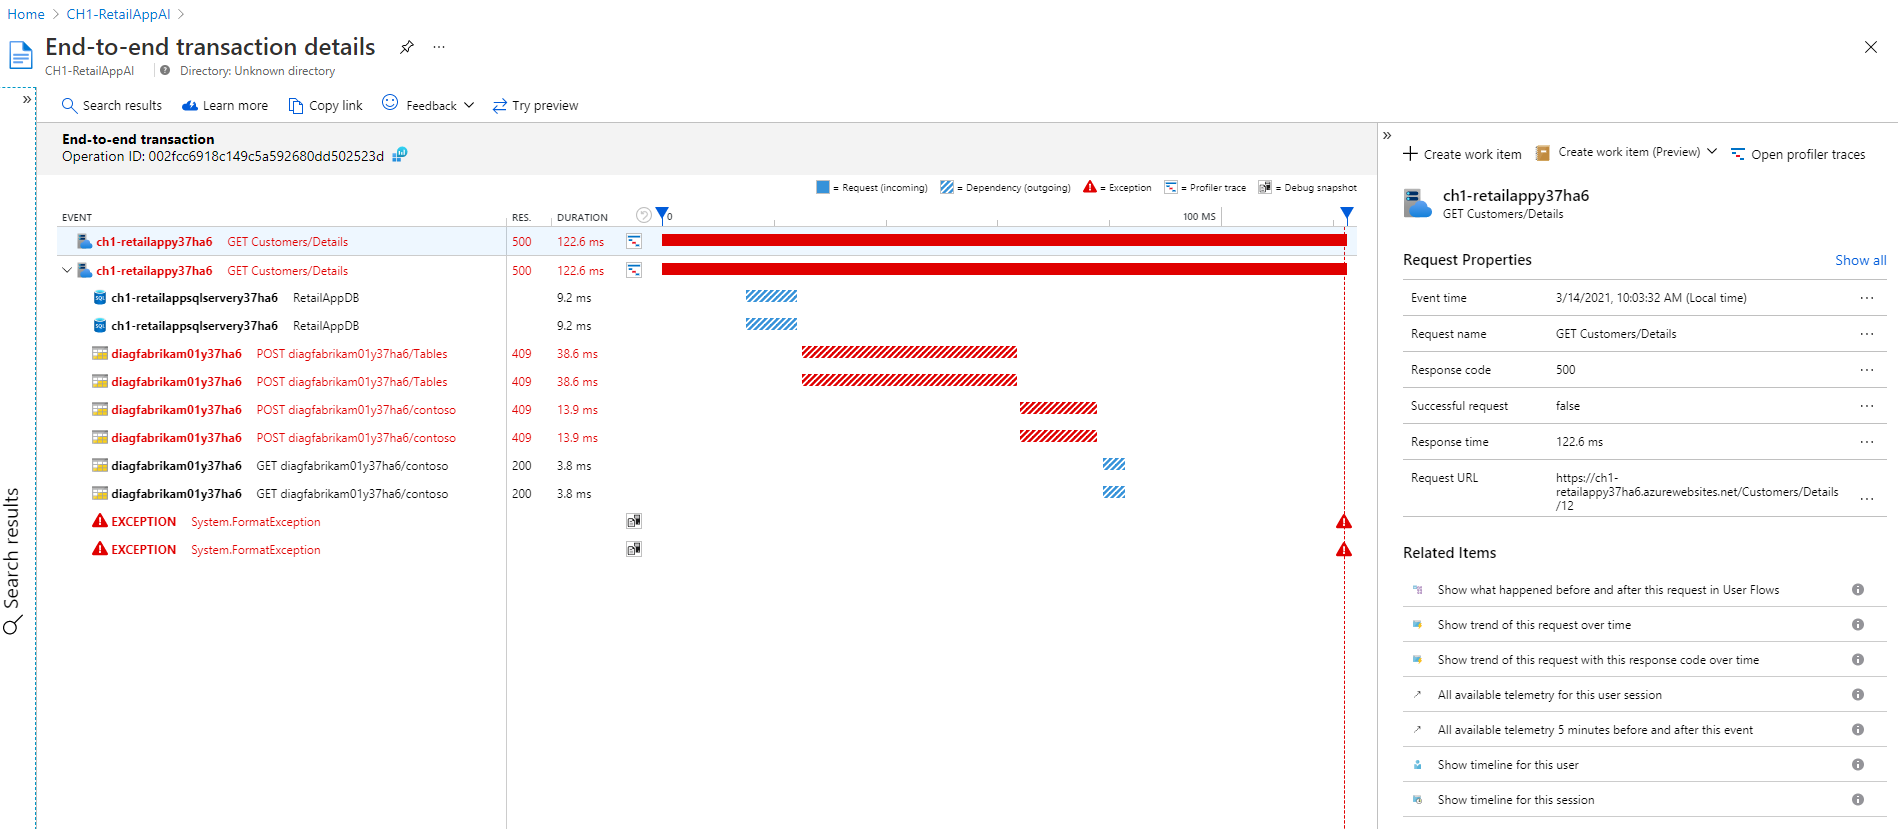
To continue your investigation into the root cause of the error or exception, you can drill into the problematic transaction for a detailed end-to-end transaction view that includes dependencies and exception details.
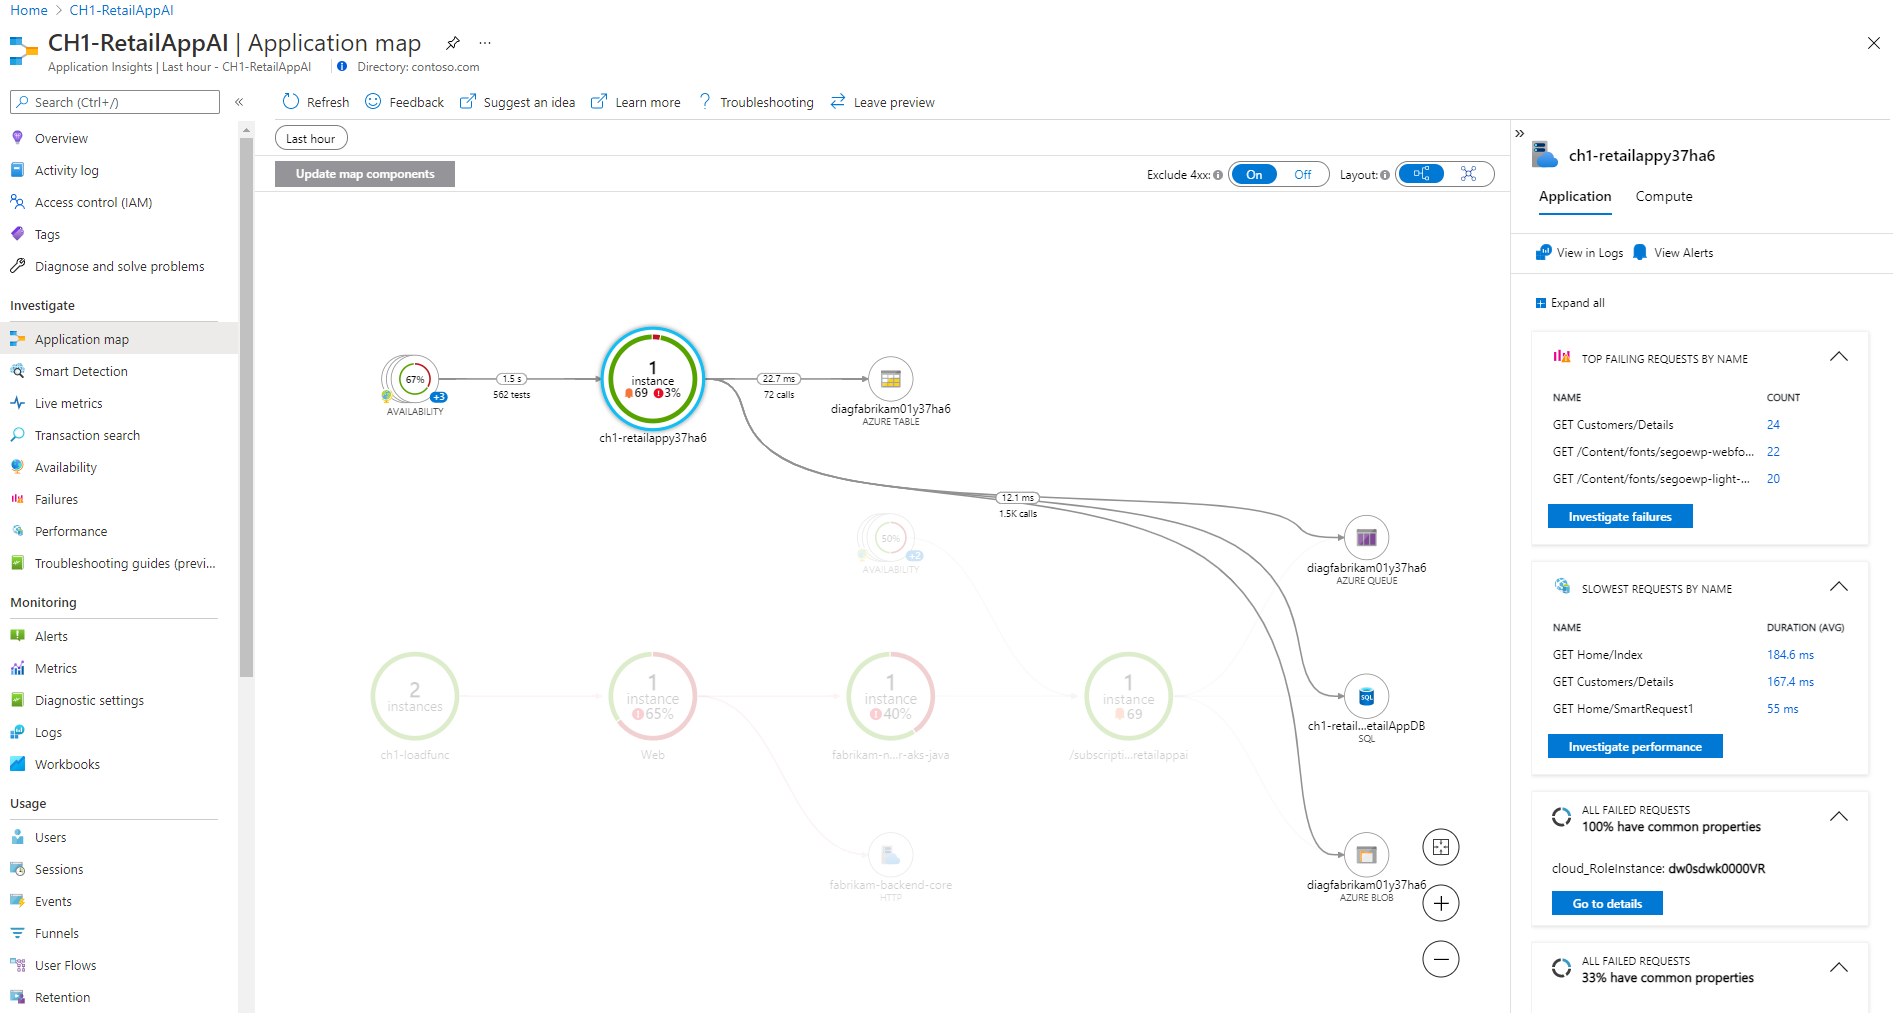
Application Insights also automatically detects app dependencies to support distributed tracing and create application topology views. You can see this topology by selecting Application map in the Application Insights left navigation.
You can view more details of each component in the map by selecting it. For example, you can view the slowest requests for an instance and investigate performance further. These detailed analytics help you understand the application better and respond to its requirements.
Monitor your applications' performance
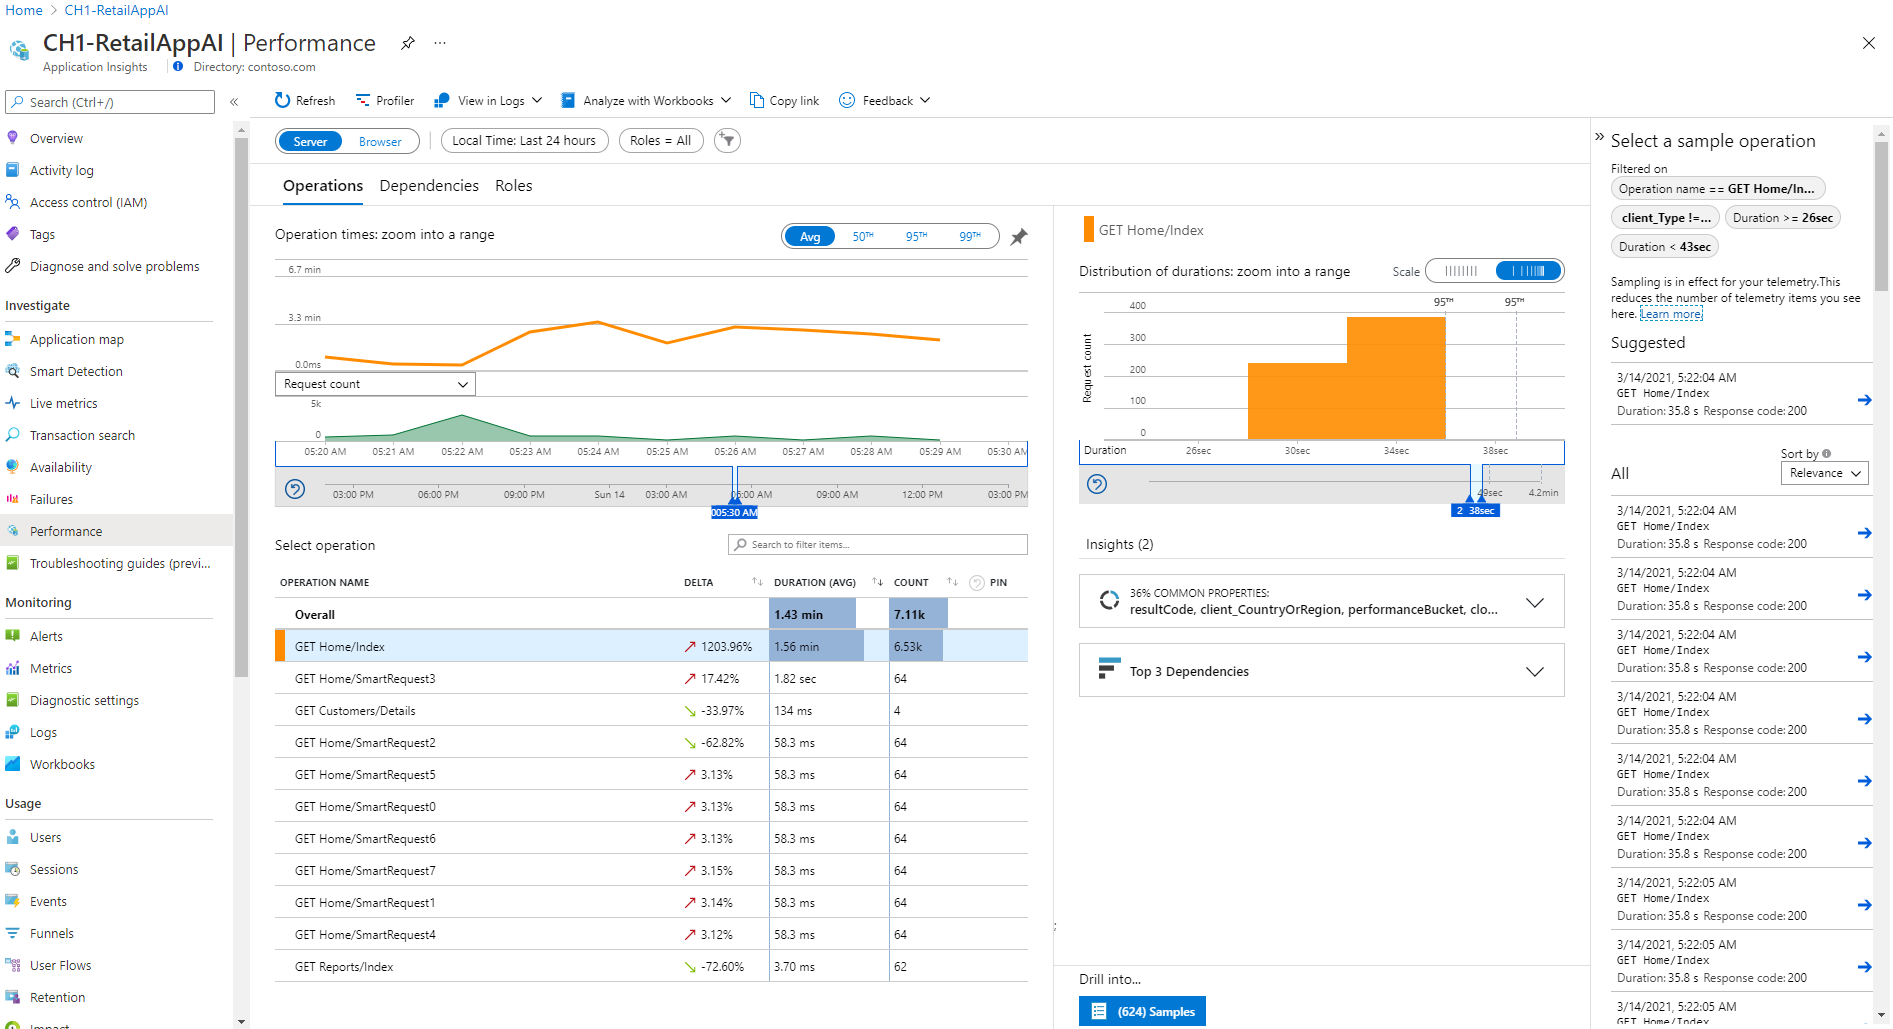
You can further investigate slow transactions to identify slow requests and server-side dependencies. Drill down by selecting Investigate performance from the application map, or by selecting Performance from the Application Insights left navigation.
On the Performance screen, you can isolate slow transactions by selecting the time range, operation name, and durations of interest. You're also prompted with automatically identified anomalies and commonalities across transactions. From here, you can drill into an individual transaction for an end-to-end view of transaction details with a Gantt chart of dependencies.
If you instrument your web pages with Application Insights, you can also gain visibility into page views and browser operations and dependencies. Collecting this browser data requires adding a script to your web pages. After you add the script, you can access page views and their associated performance metrics by selecting the Browser toggle.
Analyze user behavior
Instrumenting your web pages with Application Insights collects usage information to augment the server-side monitoring capabilities. The same browser-side JavaScript instrumentation provides usage data including number of users, sessions, events, browser version, OS version, and locations. This usage data shows which pages of your app are the most popular, where users drop out, and the conversion and retention rates for specific pages.
The preceding example shows the most popular browsers and versions. You can use this type of information to inform decisions for allocating functional and performance-testing resources.
Monitor your application's availability
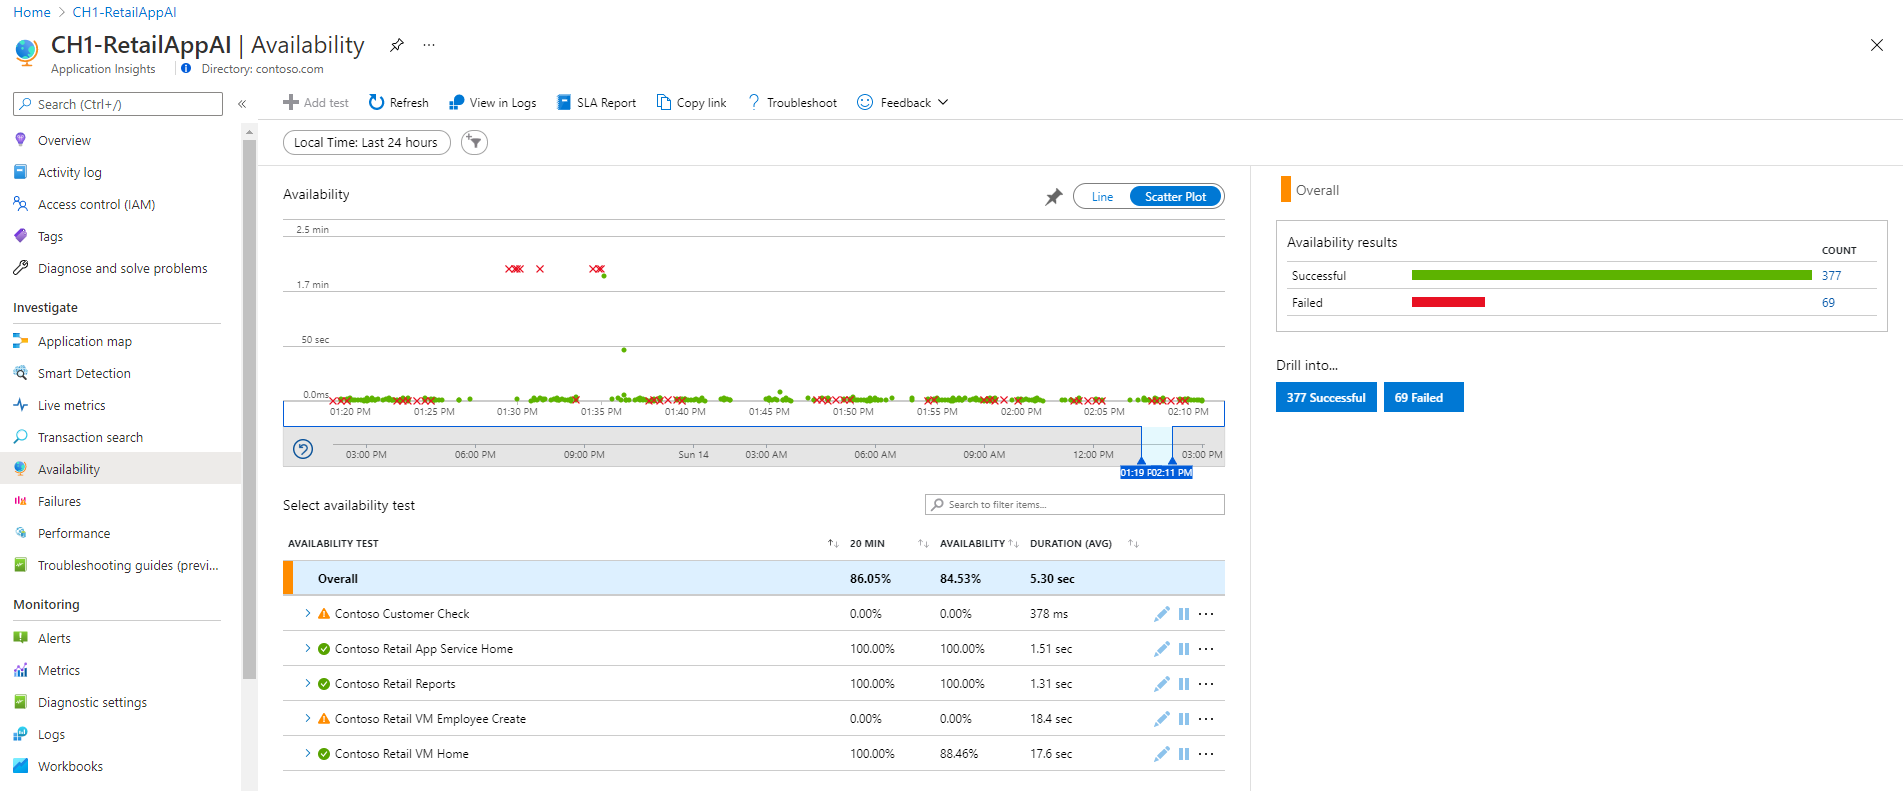
You can use the Application Insights Availability page to continuously monitor your application health and check application health from different geographic locations.
After you create an availability test, you can use the Availability page to see how your application is doing across different locations. Each dot on the Scatter Plot graph represents a test that was run. A red dot means that the test failed.
Select a red dot to see a detailed breakdown of the test failure, including information on what might have caused it. You can use the information to respond appropriately.
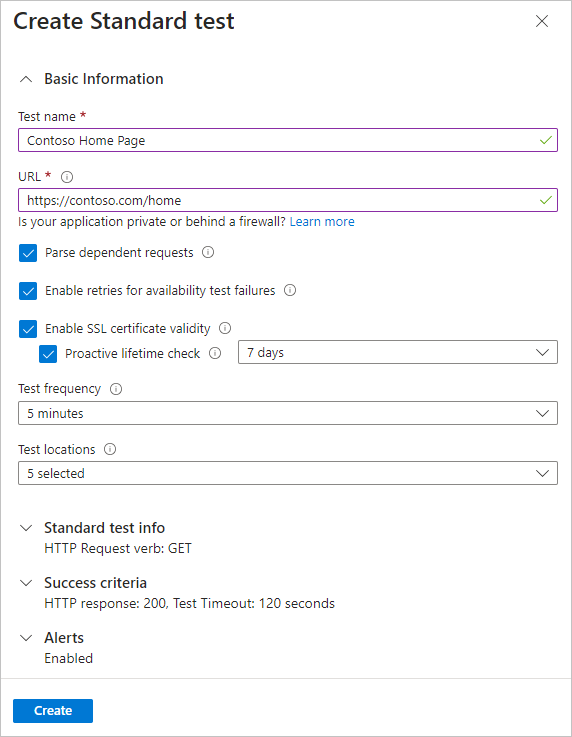
When you create an availability test, you can specify details like frequency, the URL of your application, and locations from which to test the app. The following example shows the configuration of a test that sends a request to an application every five minutes from five geographic locations.
Get notifications and take action
You can configure Application Insights alert rules to monitor your application's performance and availability. You can specify the conditions that should trigger an alert and dictate how to handle the alert. For example, Application Insights can send an alert if a specified number of locations are unavailable, or if a certain number of exceptions occur.
You can also specify who to notify about the alert. Application Insights can send notifications through email or text message, or use runbooks and webhooks to respond to alerts through automation.
