Use aggregation iterator functions
Each single-column summarization function has its equivalent iterator function. The following sections consider two aggregation scenarios when iterator functions are useful: complex summarization and higher grain summarization.
Complex summarization
In this section, you will create your first measure that uses an iterator function. First, download and open the Adventure Works DW 2020 M05.pbix file. Next, add the following measure definition:
Revenue =
SUMX(
    Sales,
    Sales[Order Quantity] * Sales[Unit Price] * (1 - Sales[Unit Price Discount Pct])
)
Format the Revenue measure as currency with two decimal places, and then add it to the table visual that's found on Page 1 of the report.
By using an iterator function, the Revenue measure formula aggregates more than the values of a single column. For each row, it uses the row context values of three columns to produce the revenue amount.
Now, add another measure:
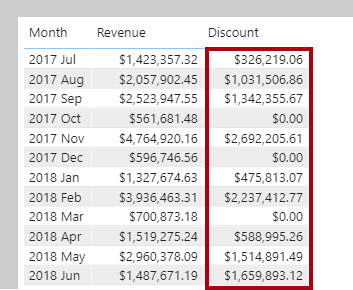
Discount =
SUMX(
    Sales,
    Sales[Order Quantity]
    * (
        RELATED('Product'[List Price]) - Sales[Unit Price]
    )
)
Format the Discount measure as currency with two decimal places, and then add it to the table visual.
Notice that the formula uses the RELATED function. Remember, row context does not extend beyond the table. If your formula needs to reference columns in other tables, and model relationships exist between the tables, use the RELATED function for the one-side relationship or the RELATEDTABLE function for the many-side relationship.
Higher grain summarization
The following example considers a requirement to report on average revenue. Add the following measure:
Revenue Avg =
AVERAGEX(
    Sales,
    Sales[Order Quantity] * Sales[Unit Price] * (1 - Sales[Unit Price Discount Pct])
)
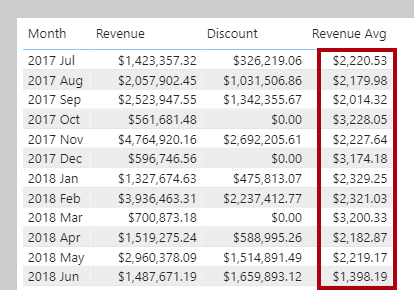
Format the Revenue Avg measure as currency with two decimal places, and then add it to the table visual.
Consider that average means the sum of values divided by the count of values. However, that theory raises a question: What does the count of values represent? In this case, the count of values is the number of expressions that didn't evaluate to BLANK. Also, because the iterator function enumerates the Sales table rows, average would mean revenue per row. Taking this logic one step further, because each row in the Sales table records a sales order line, it can be more precisely described as revenue per order line.
Accordingly, you should rename the Revenue Avg measure as Revenue Avg Order Line so that it's clear to report users about what's being used as the average base.
The following example uses an iterator function to create a new measure that raises the granularity to the sales order level (a sales order consists of one or more order lines). Add the following measure:
Revenue Avg Order =
AVERAGEX(
    VALUES('Sales Order'[Sales Order]),
    [Revenue]
)
Format the Revenue Avg Order measure as currency with two decimal places, and then add it to the table visual.
As expected, the average revenue for an order is always higher than the average revenue for a single order line.
Notice that the formula uses the VALUES DAX function. This function lets your formulas determine what values are in filter context. In this case, the AVERAGEX function iterates over each sales order in filter context. In other words, it iterates over each sales order for the month. Filter context and the VALUES function are introduced in the filter context module.


