Introduction
Measures in Microsoft Power BI models are either implicit or explicit. Implicit measures are automatic behaviors that allow visuals to summarize model column data. Explicit measures, also known simply as measures, are calculations that you can add to your model. This module focuses on how you can use implicit measures.
In the Fields pane, a column that's shown with the sigma symbol ( ∑ ) indicates two facts:
- It's a numeric column.
- It will summarize column values when it is used in a visual (when added to a field well that supports summarization).
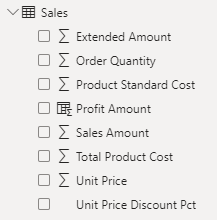
In the following image, notice that the Sales table includes only fields that can be summarized, including the Profit Amount calculated column.
As a data modeler, you can control if and how the column summarizes by setting the Summarization property to Don't summarize or to a specific aggregation function. When you set the Summarization property to Don't summarize, the sigma symbol will no longer show next to the column in the Fields pane.
To observe how report authors can use implicit measures, you can first download and open the Adventure Works DW 2020 M04.pbix file.
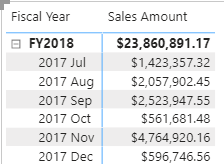
In the report, from the Sales table, add the Sales Amount field to the matrix visual that groups fiscal year and month on its rows.
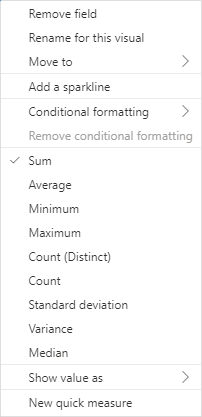
To determine how the column is summarized, in the visual fields pane, for the Sales Amount field, select the arrow and then review the context menu options.
Notice that the Sum aggregation function has a check mark next to it. This check mark indicates that the column is summarized by summing column values together. It's also possible to change the aggregation function by selecting any of the other options like average, minimum, and so on.
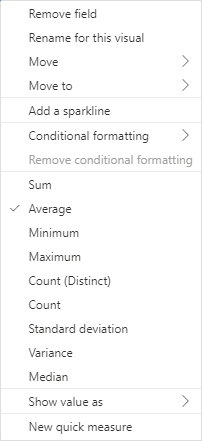
Next, add the Unit Price field to the matrix visual.
The default summarization is now set to Average (the modeler knows that it's inappropriate to sum unit price values together because they're rates, which are non-additive).
Implicit measures allow the report author to start with a default summarization technique and lets them modify it to suit their visual requirements.
Numeric columns support the greatest range of aggregation functions:
- Sum
- Average
- Minimum
- Maximum
- Count (Distinct)
- Count
- Standard deviation
- Variance
- Median
Summarize non-numeric columns
Non-numeric columns can be summarized. However, the sigma symbol does not show next to non-numeric columns in the Fields pane because they don't summarize by default.
Text columns allow the following aggregations:
- First (alphabetically)
- Last (alphabetically)
- Count (Distinct)
- Count
Date columns allow the following aggregations:
- Earliest
- Latest
- Count (Distinct)
- Count
Boolean columns allow the following aggregations:
- Count (Distinct)
- Count
Benefits of implicit measures
Several benefits are associated with implicit measures. Implicit measures are simple concepts to learn and use, and they provide flexibility in the way that report authors visualize model data. Additionally, they mean less work for you as a data modeler because you don't have to create explicit calculations.
Limitations of implicit measures
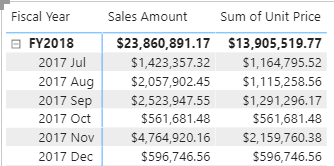
Implicit measures do have limitations. Despite setting an appropriate summarization method, report authors could choose to aggregate a column in unsuitable ways. For example, in the matrix visual, you could modify the aggregate function of Unit Price to Sum.
The report visual obeys your setup, but it has now produced a Sum of Unit Price column, which presents misleading data.
The most significant limitation of implicit measures is that they only work for simple scenarios, meaning that they can only summarize column values that use a specific aggregation function. Therefore, in situations when you need to calculate the ratio of each month's sales amount over the yearly sales amount, you'll need to produce an explicit measure by writing a Data Analysis Expressions (DAX) formula to achieve that more sophisticated requirement.
Implicit measures don't work when the model is queried by using Multidimensional Expressions (MDX). This language expects explicit measures and can't summarize column data. It's used when a Power BI semantic model is queried by using Analyze in Excel or when a Power BI paginated report uses a query that is generated by the MDX graphical query designer.
