Troubleshoot data by viewing its lineage
The Lineage view feature in Power BI allows you to quickly refresh semantic models and see the relationships between the artifacts in a workspace and their external dependencies.
Consider this module's continuing scenario with Tailwind Traders as an example. Thus far, you've developed several reports and have published them to the Tailwind workspace. However, because you are also collaborating with the Products team, it has become increasingly difficult to track which reports need to be refreshed and which semantic models are in which report. Consequently, you want the ability to determine which semantic models need to be refreshed because you've been receiving reports of stale data. The path of data from its source to the destination can often be a considerable challenge, more so if you have multiple semantic models.
The Lineage view feature can help you accomplish this task efficiently and almost effortlessly.
Data lineage
Data lineage refers to the path that data takes from the data source to the destination.
The Lineage view feature in Power BI is crucial because it:
Simplifies the troubleshooting process because you can see the path that the data takes from source to destination and determine pain points and bottlenecks.
Allows you to manage your workspaces and observe the impact of a single change in one semantic model to reports and dashboards.
Saves time by simplifying your task of identifying reports and dashboards that haven't been refreshed.
Use the Lineage view
The Lineage view is only accessible to Admin, Contributor, and Member roles. Additionally, it requires a Power BI Pro license and is only available for app workspaces. To access the Lineage view, go to the workspace, and then select Lineage from the View drop-down menu on the top ribbon.
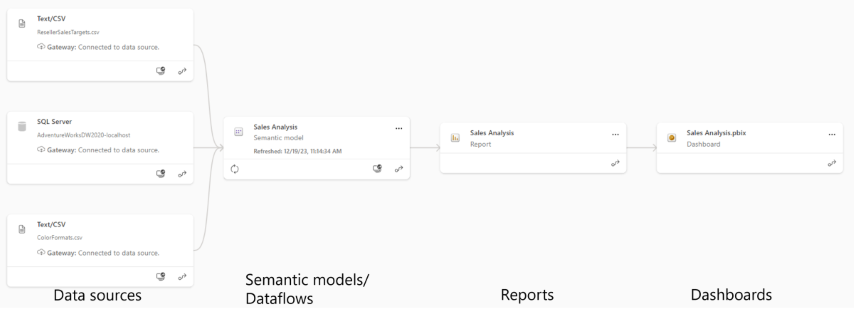
When the view canvas opens, you can begin to explore this view. The following example shown an excerpt of the data lineage for the Tailwind Sales workspace.
This view shows all the artifacts in your workspace. Artifacts include data sources, semantic models and dataflows, reports, and dashboards. Each card represents an artifact, and the arrows in between these cards represent the flow of data or the relationship between different artifacts. By following the arrows from left to right, you can observe the flow of data from the source to the destination, which will often be a dashboard. Typically, the flow would be data sources > semantic models/dataflows > reports > dashboards.
Data sources
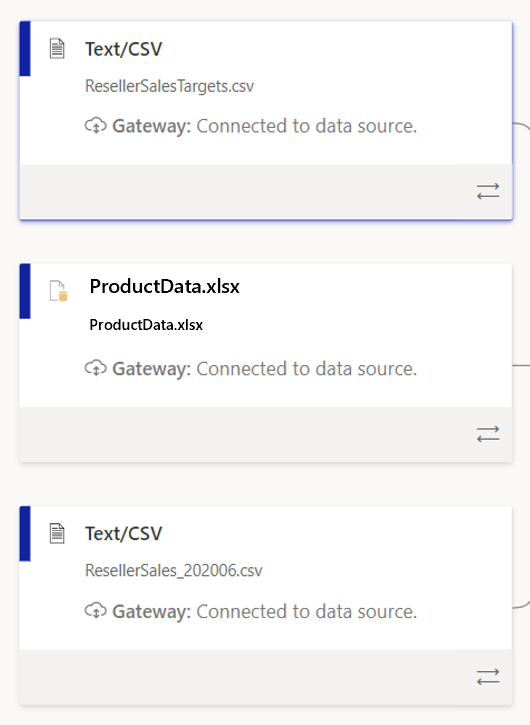
Each of the following cards is a data source that is used in your workspace.
The card tells you the type of data source (for example, Text/CSV) and the Gateway, which tells you the source of your data. If you are connected to the data through an on-premises data gateway, this card will tell you more information about the gateway. Additionally, if you double-click the card, you will get more details about the data source, such as the file path and the connection status.
Selecting the lower-right icon on the card will highlight the path from the data source to the destination, as shown in the following screenshot, which clarifies the exact path that the data takes.
Next are the semantic models/dataflows, which are marked in blue.
semantic models/dataflows
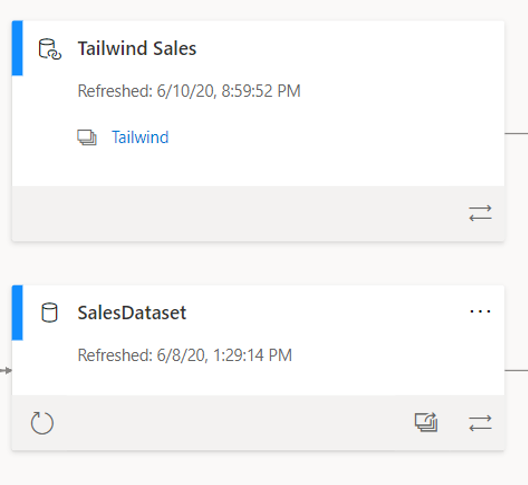
Often, semantic models and dataflows can connect to external data sources, such as SQL Server, or to external semantic models in other workspaces. The following examples show semantic model and dataflow cards on the Lineage view.
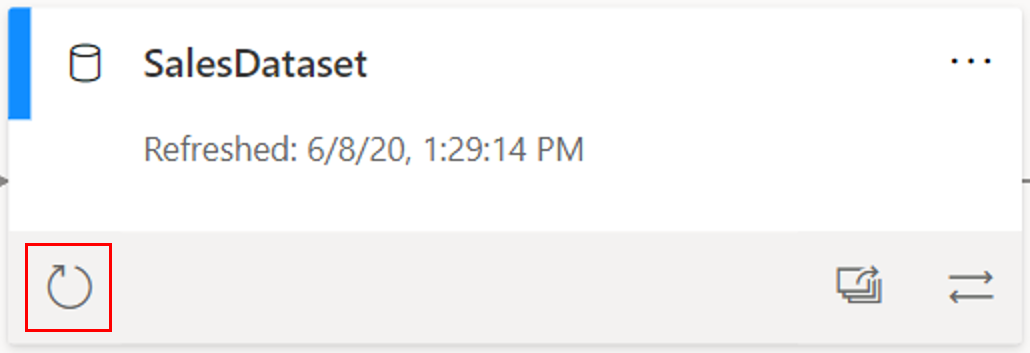
The Lineage view uses arrows to connect objects, such as semantic models, with their data sources. On these cards, you can see when the semantic model was last refreshed, and you can refresh the semantic model by selecting the arrow icon on the lower-left corner of the card, as shown in the following screenshot.
This component is a powerful troubleshooting feature that helps ensure that your semantic model refreshes are quick and uncomplicated.
Returning to the initial quandary with Tailwind Traders, you wanted to determine if the company had stale semantic models and then quickly refresh the data. By using the Lineage view feature, you can go through the different semantic models in one view and then use the Refresh data button to refresh semantic models that you determine as stale.
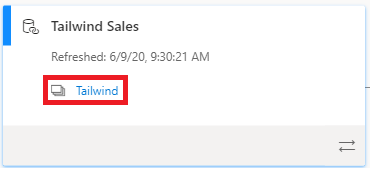
Additionally, if a semantic model or dataflow belongs to a different workspace (in this case, the Tailwind workspace), it will be indicated on the card, as shown in the following screenshot.
By double-clicking on any card, you can view the metadata, such as the sensitivity, by whom it was configured, the last refresh date, and the names and count of tables within this semantic model, as shown in the following figure.
You can also view the impact of this semantic model across workspaces. By selecting the overlapping window icon on the lower-right corner of a semantic model card, you can determine the impact analysis of the semantic model.
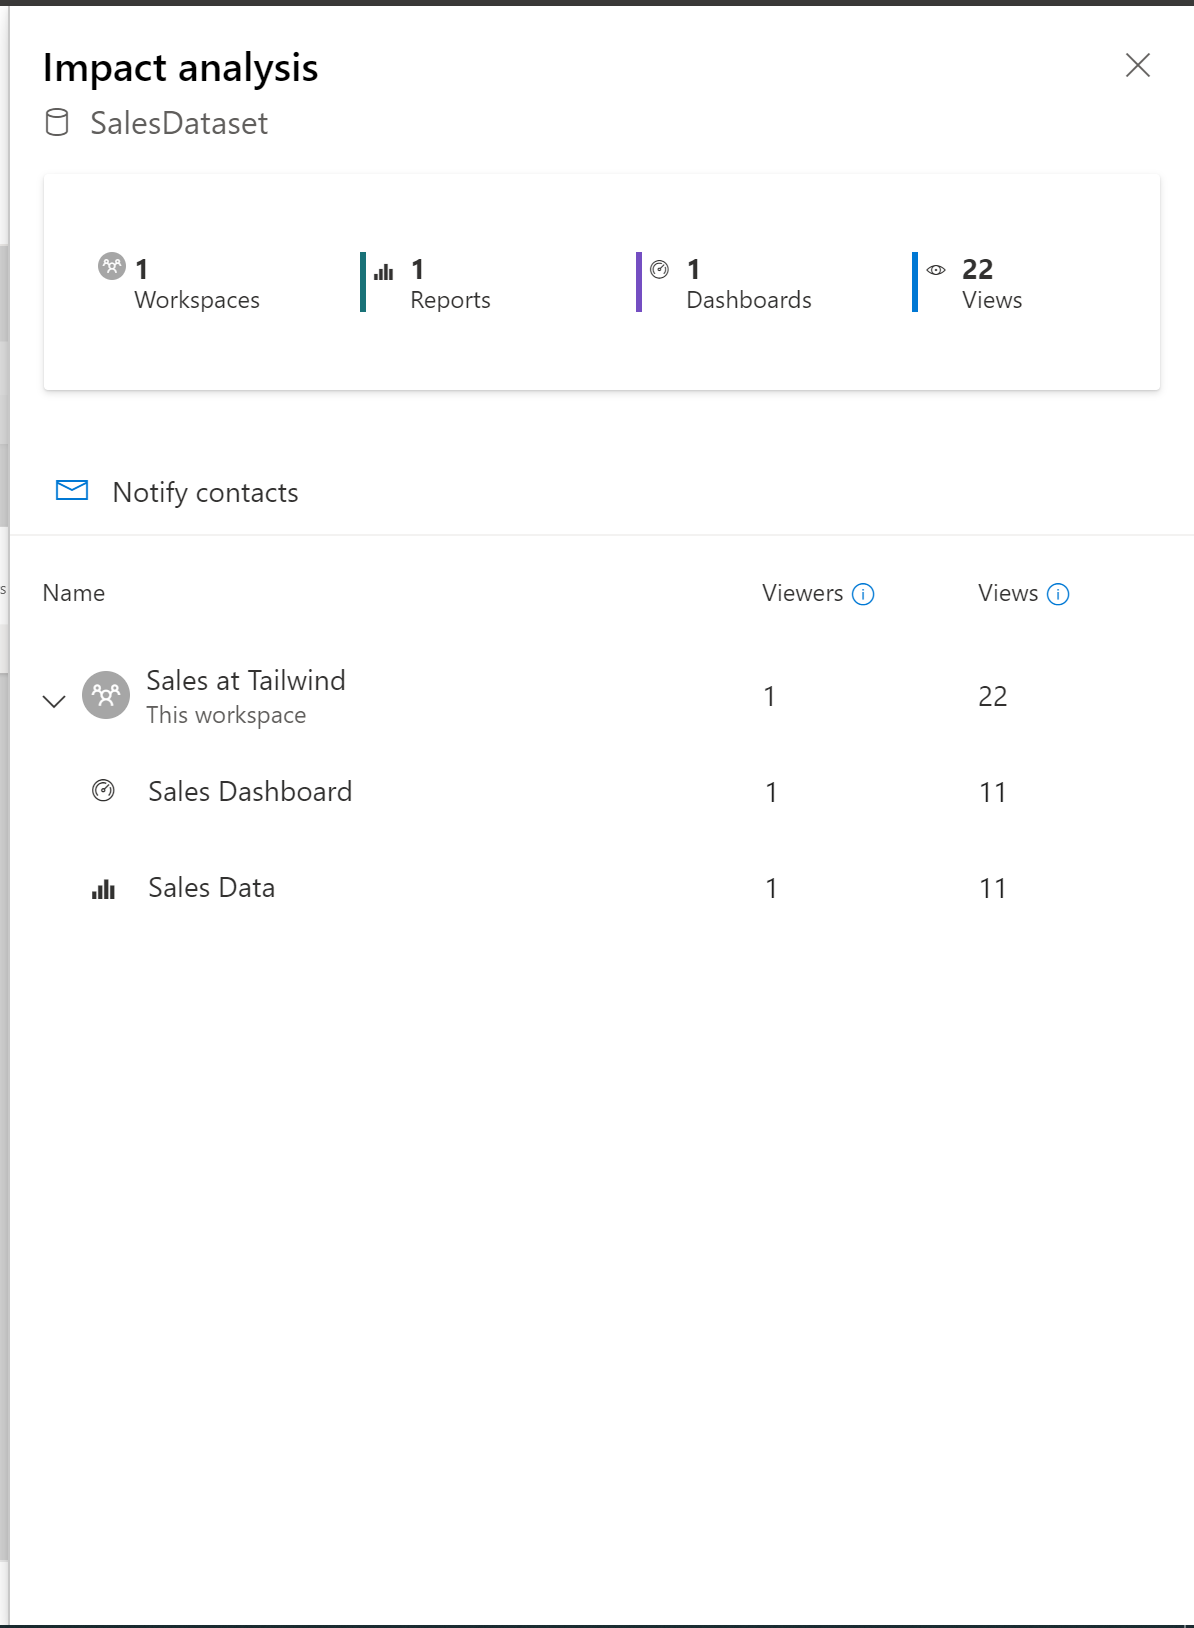
On the Impact analysis window, you can see how many workspaces, reports, and dashboards that this semantic model is a part of and how many views that this semantic model has gathered, as shown in the following screenshot.
The bottom of the Impact Analysis window includes more detail about which specific reports and dashboards that this semantic model is part of. Additionally, you can select Notify contacts, which allows you to notify semantic model owners (or any other user) of changes in the semantic model. Impact analysis is useful because it allows you to pinpoint semantic models that aren't being used or looked at.
Reports and dashboards
The reports and dashboards cards have similar functionality as the data source and semantic model cards.
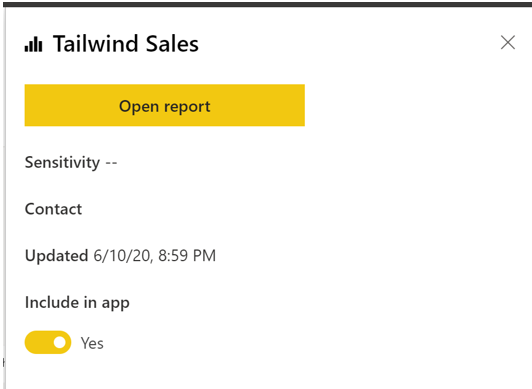
Selecting a card will bring up a window in which you can view the metadata about the report or dashboard. In this window, you can also go directly to the report or dashboard. You can also enable or disable whether you want to include this report or dashboard within the app.
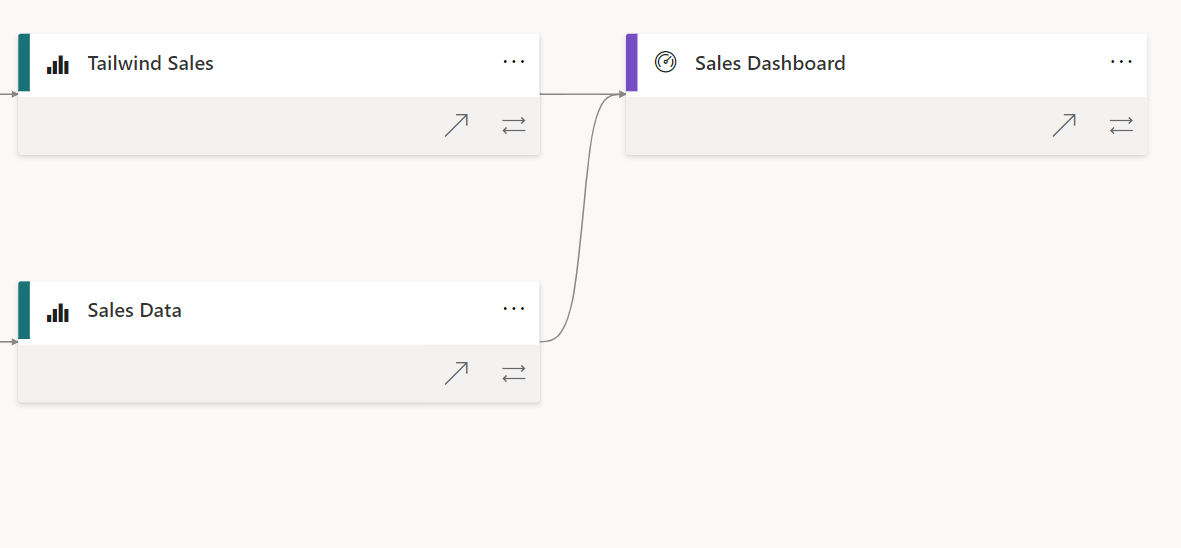
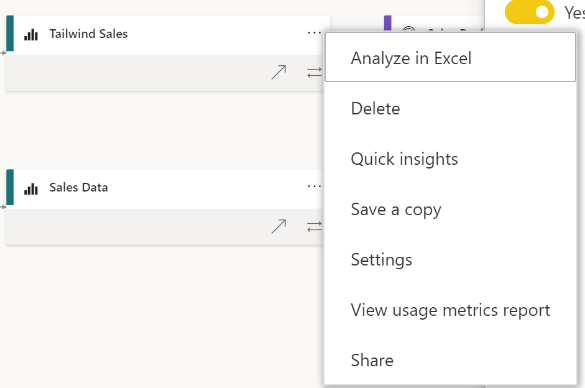
This card also contains useful options under the ellipsis (...), as shown in the following figure. From this menu, you can select to analyze the report in Microsoft Excel, delete a report, create Quick Insights, save a copy to a workspace, and more.
Now that you have had an in-depth look into the Lineage view in Power BI, you can commence with cleaning up the Tailwind Traders workspace. For more information, see Data Lineage.

