Exercise - List recently active virtual machines that stopped sending logs
Here, you'll write KQL queries to retrieve and transform data from the Heartbeat table to obtain insights about the status of machines in your environment.
1. Set goals
Your first log analysis goal is to ensure you're getting data about all active virtual machines in your network. You want to identify machines that stop sending data to ensure you have full visibility of all active virtual machines.
To determine which machines have stopped sending data, you need information about:
- All machines that have recently logged data, but haven't logged data as expected in the past few minutes.
- For deeper analysis, it's useful to know which virtual machine agent is running on each machine.
2. Assess logs
Azure Monitor uses Azure Monitor Agent to collect data about activities and operating system processes running inside virtual machines.
Note
Some of the older machines in your environment still use the legacy Log Analytics Windows and Linux agents, which Azure Monitor is deprecating.
Azure Monitor Agent and Log Analytics Agent send virtual machine health data to the Heartbeat table once a minute.
Let's run a simple take 10 query on the Heartbeat table to see the type of data each one of its columns holds:
Click to run query in Log Analytics demo environment
Heartbeat
| take 10
The TimeGenerated, Computer, Category, and OSType columns all have data that's relevant to our analysis.
Now let's assess how we can use this data and which KQL operations can help extract and transform the data:
| Column | Description | Analysis goal | Related KQL operations |
|---|---|---|---|
TimeGenerated |
Indicates when the virtual machine generated each log. |
|
|
Computer |
Unique identifier of the machine. |
|
|
Category |
The agent type:
|
Identify the agent running on the machine. | To simplify the results and facilitate further analysis, such as filtering:
|
OSType |
The type of operating system running on the virtual machine. | Identify agent type for Log Analytics agents, which are different for Windows and Linux. | summarize by... OSTypeFor more information, see summarize operator. |
Version |
The version number of the agent monitoring the virtual machine. | Identify the agent version on each machine. | Rename the column to AgentVersion (AgentVersion=Version). |
3. Write your query
Write a query that lists the machines that have been active in the past 48 hours, but haven't logged data to the Heartbeat table in the last five minutes.
Retrieve all logs from the past 48 hours:
Click to run query in Log Analytics demo environment
Heartbeat // The table you’re querying
| where TimeGenerated >ago(48h) // Time range for the query - in this case, logs generated in the past 48 hours
The result set of this query includes logs from all of the machines that sent log data in the past 48 hours. These results likely include numerous logs for each active machine.
To understand which machines haven't recently sent logs, you only need the last log each machine sent.
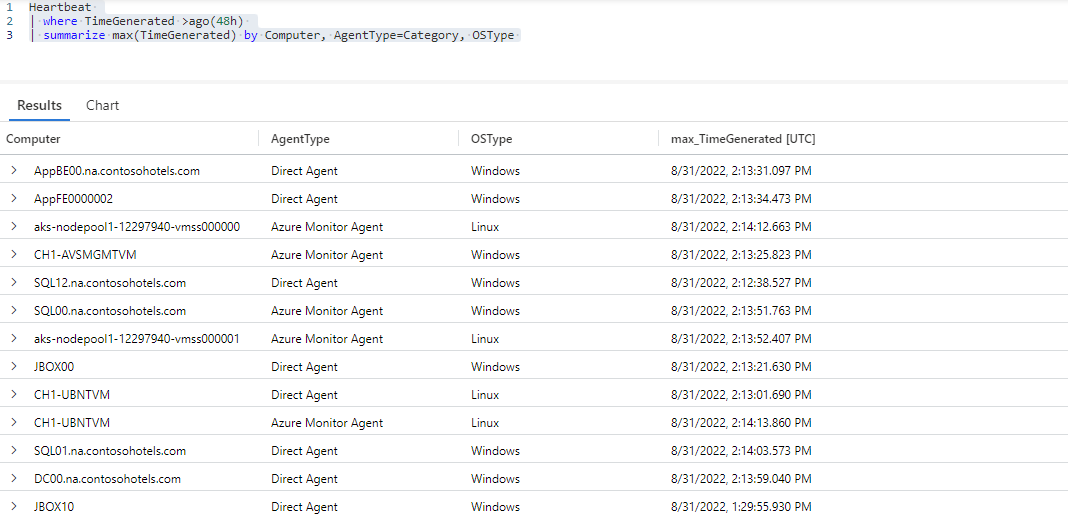
Find the last log generated by each machine and summarize by computer, agent type, and operating system:
Click to run query in Log Analytics demo environment
Heartbeat // The table you’re querying
| where TimeGenerated >ago(48h) // Time range for the query - in this case, logs generated in the past 48 hours
| summarize max(TimeGenerated) by Computer, AgentType=Category, OSType // Retrieves the last record generated by each computer and provides information about computer, agent type, and operating system
You now have one log from each machine that logged data in the past 48 hours - the last log each machine sent.
In the
summarizeline, you've renamed theCategorycolumn toAgentType, which better describes the information you're looking at in the column as part of this analysis.To see which machines haven't sent logs in the last five minutes, filter away all logs generated in the last five minutes:
Click to run query in Log Analytics demo environment
Heartbeat // The table you’re querying
| where TimeGenerated >ago(48h) // Time range for the query - in this case, logs generated in the past 48 hours
| summarize max(TimeGenerated) by Computer, AgentType=Category, OSType // Retrieves the last record generated by each computer and provides information about computer, agent type, and operating system
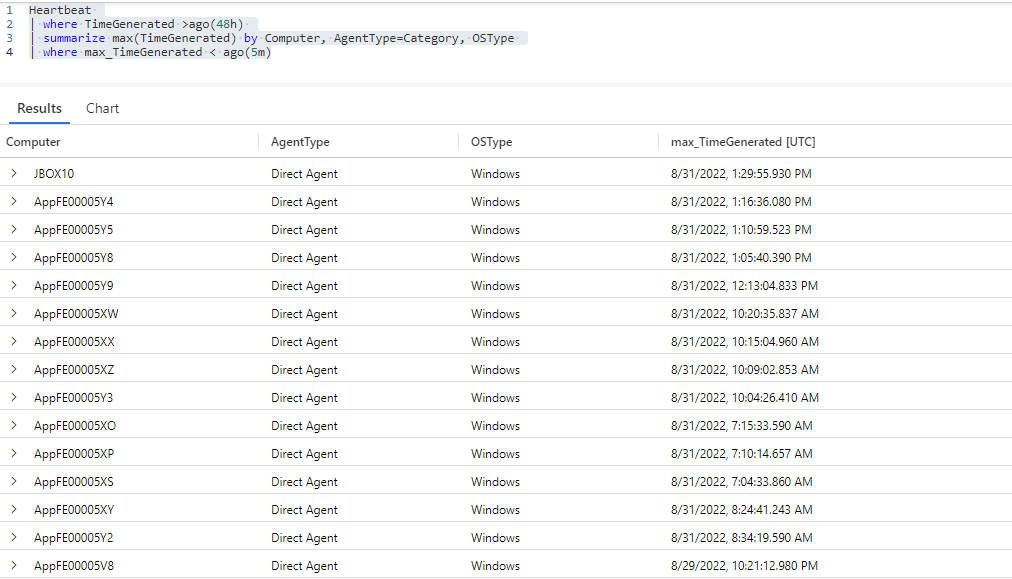
| where max_TimeGenerated < ago(5m) // Filters away all records generated in the last five minutes
The result set of this query includes the last log generated by all machines that logged data in the past 48 hours, but doesn't include logs generated in the past five minutes. In other words, any machine that logged data in the last five minutes isn't included in the result set.
You now have the data you're looking for: a list of all machines that logged data in the last 48 hours, but haven't been logging data as expected in the last five minutes. The result set consists of the set of computers you want to investigate further.
Manipulate the query results to present the information more clearly.
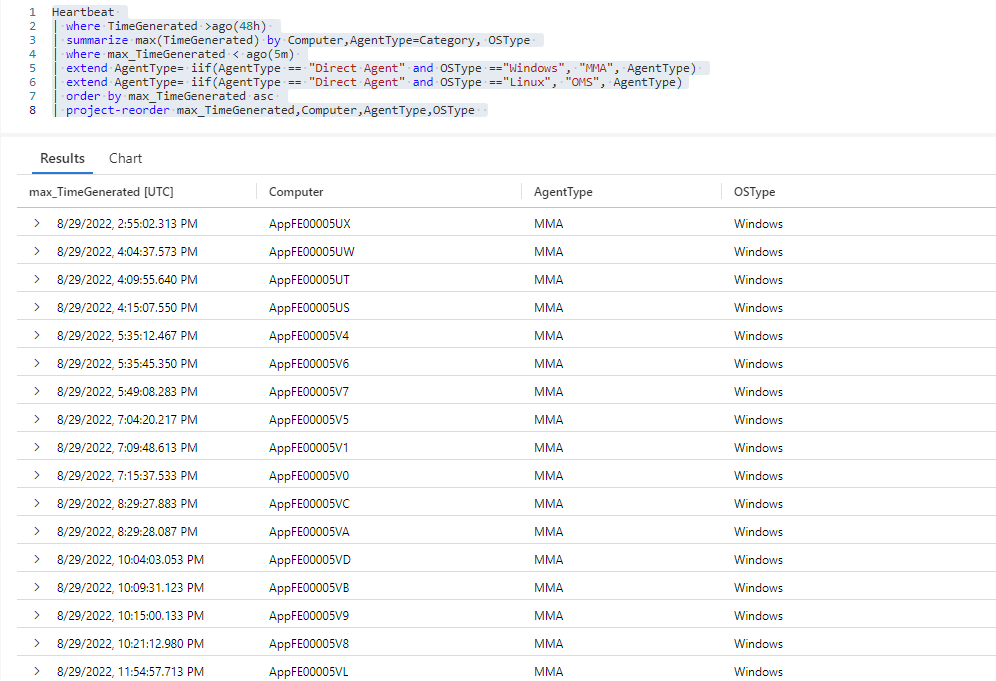
For example, you can organize the logs by time generated - from the oldest to the newest - to see which computers have gone the longest time without logging data.
The
Direct Agentvalue in the AgentType column tells you that the Log Analytics Agent is running on the machine. Since the Log Analytics Agent for Windows is also called OMS and for Linux the agent is also called MMS, renaming theDirect Agentvalue toMMAfor Windows machines andOMSfor Linux machines simplifies the results and facilitates further analysis, such as filtering.Click to run query in Log Analytics demo environment
Heartbeat // The table you’re querying
| where TimeGenerated >ago(48h) // Time range for the query - in this case, logs generated in the past 48 hours
| summarize max(TimeGenerated) by Computer,AgentType=Category, OSType // Retrieves the last record generated by each computer and provides information about computer, agent type, and operating system
| where max_TimeGenerated < ago(5m) // Filters away all records generated in the last five minutes
| extend AgentType= iif(AgentType == "Direct Agent" and OSType =="Windows", "MMA", AgentType) // Changes the AgentType value from "Direct Agent" to "MMA" for Windows machines
| extend AgentType= iif(AgentType == "Direct Agent" and OSType =="Linux", "OMS", AgentType) // Changes the AgentType value from "Direct Agent" to "OMS" for Linux machines
| order by max_TimeGenerated asc // Sorts results by max_TimeGenerated from oldest to newest
| project-reorder max_TimeGenerated,Computer,AgentType,OSType  // Reorganizes the order of columns in the result set
Tip
Use
max_TimeGeneratedto correlate the last heartbeat of the machine that stopped reporting with machine logs or other environmental events that occurred around the same time. Correlating logs in this way can help in finding the root cause of the issue you are investigating.
Challenge: Group machines by monitoring agent and agent version
Understanding which agents and agent versions are running on your machines can help you analyze the root cause of problems and identify which machines you need to update to a new agent or new agent version.
Can you think of a couple of quick tweaks you can make to the query you developed above to get this information?
Consider this:
- Which additional information do you need to extract from your logs?
- Which KQL operation can you use to group machines by the agent version they're running?
Solution:
Copy the first five lines from the query and add the
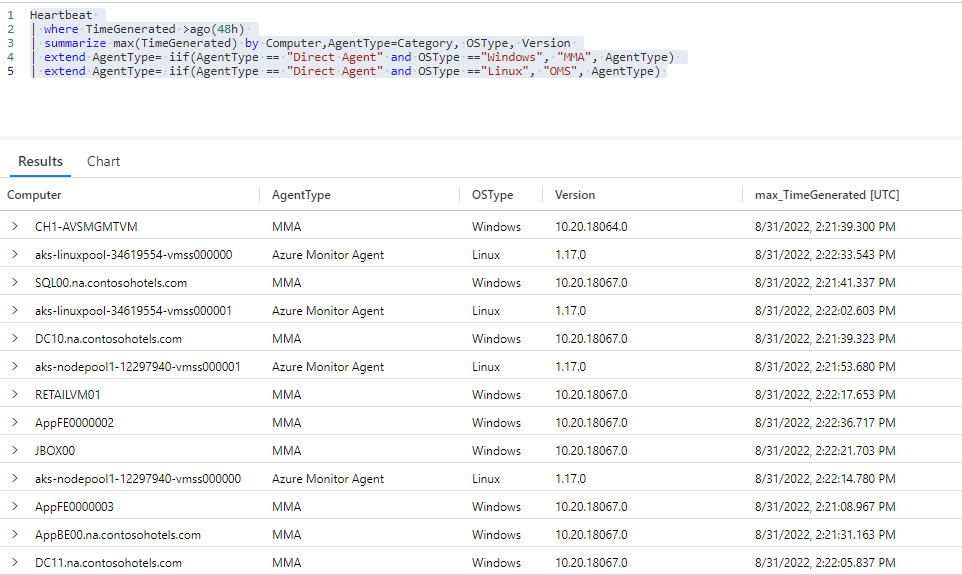
Versioncolumn to thesummarizeline of the query to extract agent version information:Click to run query in Log Analytics demo environment
Heartbeat // The table you’re querying
| where TimeGenerated >ago(48h) // Time range for the query - in this case, logs generated in the past 48 hours
| summarize max(TimeGenerated) by Computer,AgentType=Category, OSType, Version // Retrieves the last record generated by each computer and provides information about computer, agent type, operating system, and agent version
| extend AgentType= iif(AgentType == "Direct Agent" and OSType =="Windows", "MMA", AgentType) // Changes the AgentType value from "Direct Agent" to "MMA" for Windows machines
| extend AgentType= iif(AgentType == "Direct Agent" and OSType =="Linux", "OMS", AgentType) // Changes the AgentType value from "Direct Agent" to "OMS" for Linux machines
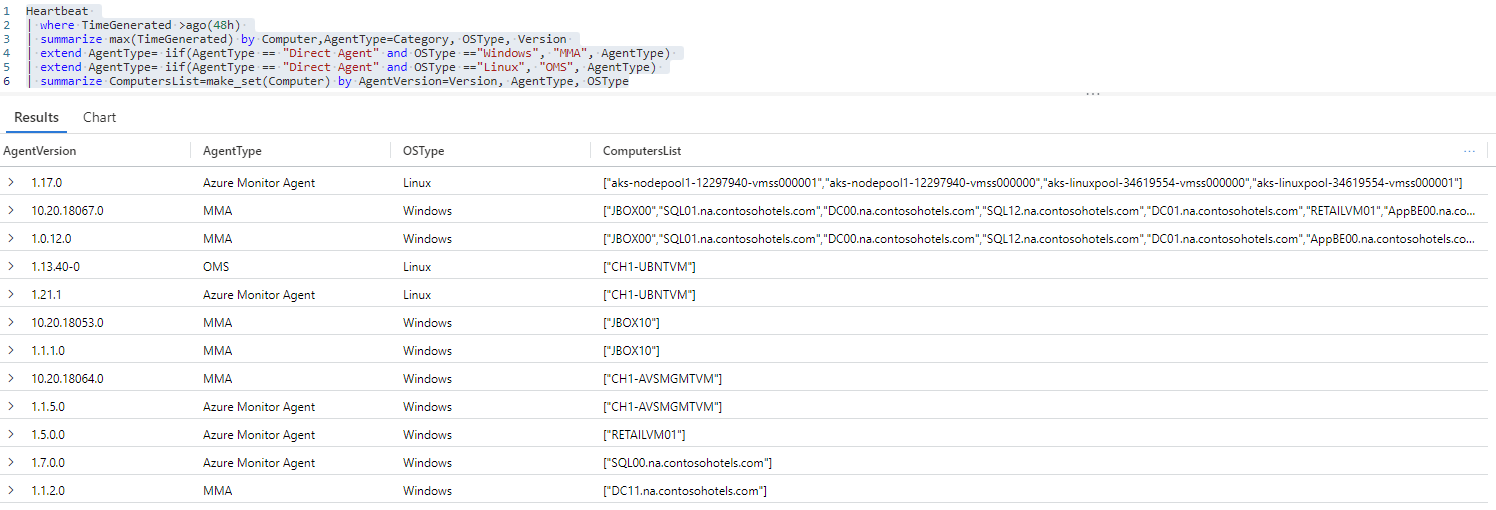
Rename the
Versioncolumn toAgentVersionfor clarity, add anothersummarizeline to find unique combinations of agent type, agent version, and operating system type, and use the KQLmake_set()aggregate function to list all computers running each combination of agent type and agent version:Click to run query in Log Analytics demo environment
Heartbeat // The table you’re querying
| where TimeGenerated >ago(48h) // Time range for the query - in this case, logs generated in the past 48 hours
| summarize max(TimeGenerated) by Computer,AgentType=Category, OSType, Version // Retrieves the last record generated by each computer and provides information about computer, agent type, operating system, and agent version
| extend AgentType= iif(AgentType == "Direct Agent" and OSType =="Windows", "MMA", AgentType) // Changes the AgentType value from "Direct Agent" to "MMA" for Windows machines
| extend AgentType= iif(AgentType == "Direct Agent" and OSType =="Linux", "OMS", AgentType) // Changes the AgentType value from "Direct Agent" to "OMS" for Linux machines
| summarize ComputersList=make_set(Computer) by AgentVersion=Version, AgentType, OSType // Summarizes the result set by unique combination of agent type, agent version, and operating system, and lists the set of all machines running the specific agent version
You now have the data you're looking for: a list of unique combinations of agent type and agent version and the set of all recently active machines that are running a specific version of each agent.


