Exercise - Create basic Azure Monitor log queries to extract information from log data
The operations team doesn't currently have enough information about its system behavior to diagnose and resolve problems effectively. To address this issue, the team has configured an Azure Monitor workspace with the company's Azure services. It runs Kusto queries to get the system's status and attempts to identify the causes of any problems that might occur.
In particular, the team is interested in monitoring security events to check for possible attempts to break into the system. An attacker might try to manipulate the applications running on the system, so the team also wants to gather application data for further analysis. An attacker might also try to halt the computers that compose the system, so the team wants to examine how and when machines are stopped and restarted.
In this exercise, you'll practice performing Azure log queries against a demo project that contains sample data in tables, logs, and queries.
Create basic Azure Monitor log queries to extract information from log data
Let's use the Azure Demo Logs pane to practice writing queries. The demo project workspace is prepopulated with sample data. Azure offers an optimized SQL-like query with visualization options of its data in a language called KQL (Kusto Query Language.)
Open the Logs demo environment. In the top-left corner, under New Query 1, you'll find Demo, which identifies the query's workspace (or scope). The left side of this pane contains several tabs: Tables, Queries, and Functions. The right side has a scratchpad for creating or editing queries.
On the New Query 1 tab, enter a basic query on the first line of the scratchpad. This query retrieves the details of the 10 most recent security events.
SecurityEvent
    | take 10
In the command bar, select Run to execute the query and view the results. You can expand each row in the results pane for more information.
Sort the data by time by adding a filter to your query:
SecurityEvent
    | top 10 by TimeGenerated
Add a filter clause and a time range. Run this query to fetch records that are more than 30 minutes old and that have a level of 10 or more:
SecurityEvent
    | where TimeGenerated < ago(30m)
    | where toint(Level) >= 10
Run the following query to search the
AppEventstable for records of theClicked Schedule Buttonevent being invoked in the last 24 hours:AppEvents | where TimeGenerated > ago(24h) | where Name == "Clicked Schedule Button"Run the following query to display the number of different computers that generated heartbeat events each week for the last three weeks. The results appear as a bar chart:
Heartbeat
    | where TimeGenerated >= startofweek(ago(21d))
    | summarize dcount(Computer) by endofweek(TimeGenerated) | render barchart kind=default
Use predefined Azure log queries to extract information from log data
In addition to writing queries from scratch, the operations team can also take advantage of predefined queries in Azure Logs that answer common questions related to their resources' health, availability, usage, and performance.
Use the Time Range parameter in the command bar to set a custom range. Select the month, year, and day to a range from January to today. You can set and apply a custom time to any query.
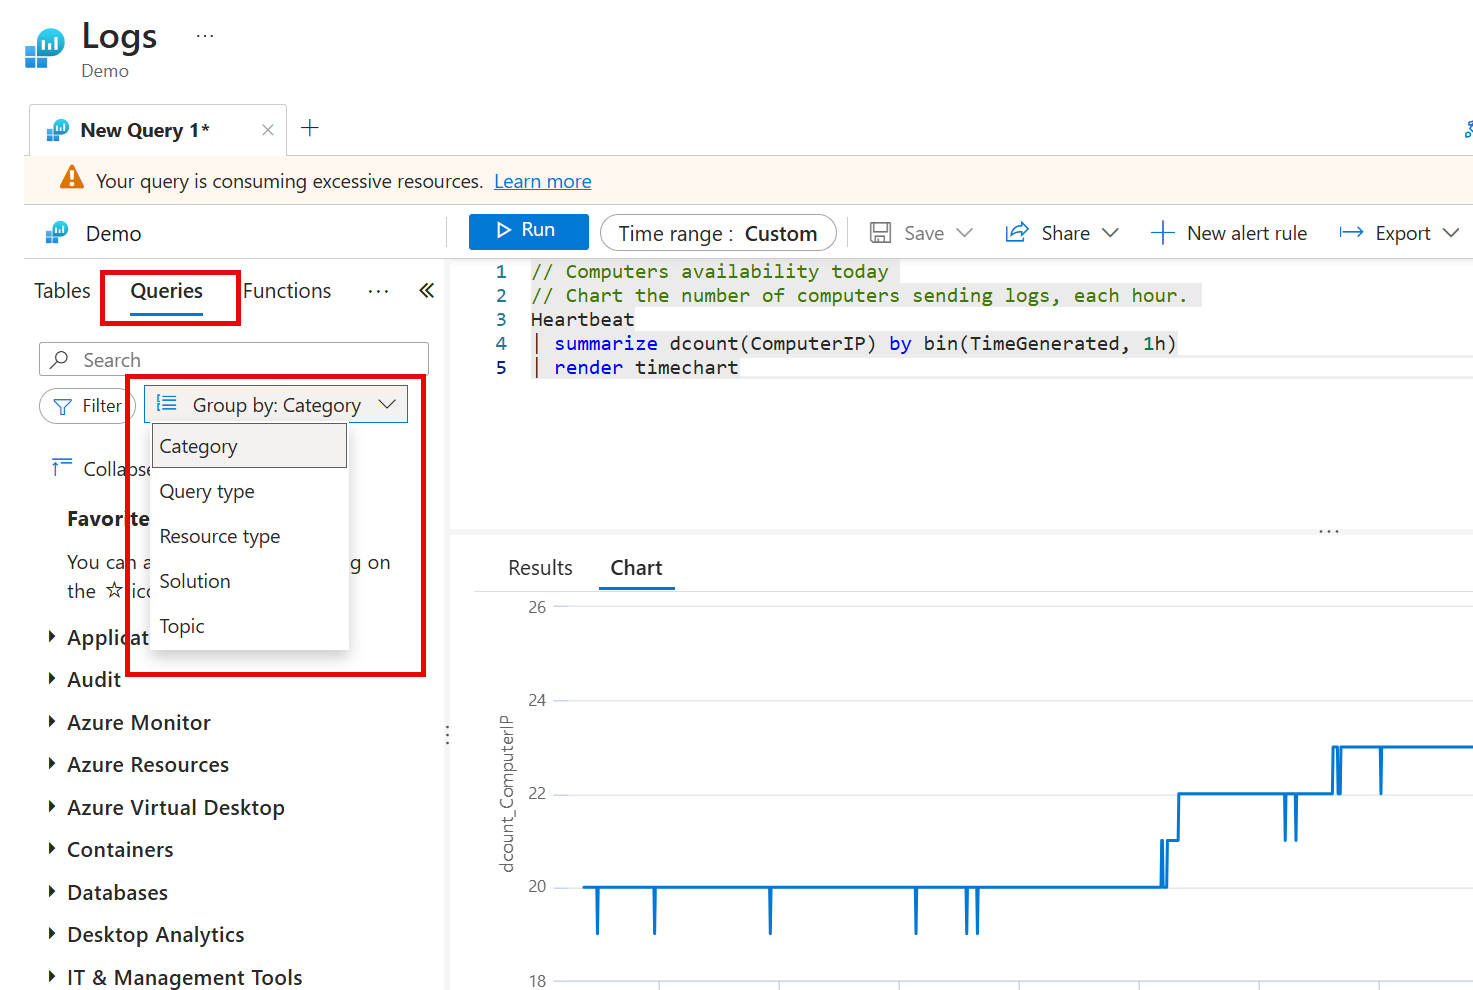
On the left toolbar, select Queries. In the drop-down list in the left menu, you can view a list of the sample queries grouped by Category, Query type, Resource type, Solution, or Topic.

Select Category in the drop-down list, then select IT & Management Tools.
In the search box, enter Distinct missing updates cross computers. Double-click the query in the left pane, then select Run. The Logs pane reappears, with the query returning a list of Windows updates missing from virtual machines that are sending logs to the workspace.
Note
You can also run this same query from the Logs pane. In the left pane, select the Queries tab, then select Category in the Group by dropdown list. Now scroll down the list, expand IT & Management Tools, and double-click Distinct missing updates cross computers. Select Run to run the query. When you select a predefined query in the left pane, the query code is appended to whatever query exists in the scratchpad. Remember to clear the scratchpad before opening or adding a new query to run.
In the left pane, clear the search box. Select Queries, then select Category in the Group by dropdown list. Expand Azure Monitor and double-click Computers availability today. Select Run. This query creates a time series chart with the number of unique IP addresses sending logs into the workspace each hour for the last day.
Select Topic in the Group by dropdown list, scroll down to expand Function App, and then double-click Show application logs from Function Apps. Select Run. This query returns a list of application logs, sorted by time with the latest logs shown first.
You'll notice that from the Kusto queries you used here, it's easy to target a query to a specific time window, event level, or event log type. The security team can easily examine heartbeats to identify when servers are unavailable, which might indicate a denial-of-service attack. If the team spots the time when a server was unavailable, it can query for events in the security log around that time to diagnose whether an attack caused the interruption. Additionally, predefined queries can also evaluate VM availability, identify missing Windows updates, and review firewall logs to view denied network flows intended for the VMs of interest.