Examples of custom query-based monitors
All examples of using custom query-based monitors and performance rules based on the AdventureWorks sample database can be found on the installation page or directly within the SQL Server samples GitHub repository.
Prerequisites
SQL Server Management Studio (SSMS).
A running instance of the AdventureWorks2022 database. If you don't have one, follow these steps to install it:
Download the AdventureWorks2022.bak database sample backup with online transaction processing (OLTP) data, which is for most typical OLTP workloads. If you're not sure what sample you need, start with the OLTP version that matches your SQL Server version.
Restore the AdventureWorks sample database to your SQL Server instance by using the
.bakfile. You can use the RESTORE (Transact-SQL) command or the graphical interface in SSMS.
Custom query-based two-state monitor
You can create two types of unit monitors based on custom queries: two-state monitors and three-state monitors. This article shows typical examples of the usage of two-state monitors.
Example 1 with "Empty Result Set"
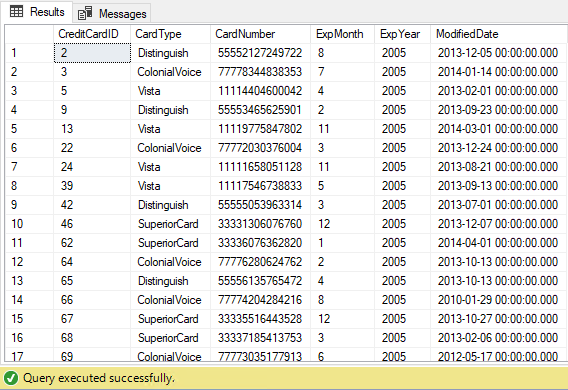
In this example, consider the condition under which the Sales.CreditCard table is checked to ensure that no entries in the ExpYear column have the 2005 year:
SELECT * FROM [Sales].[CreditCard]
WHERE ExpYear = 2005
The query returns several records:
To create a monitor that changes its state to unhealthy if the table contains records with an expiration year of 2005, use these steps:
In the System Center Operations Manager console, go to Authoring > Management Pack Objects. Right-click Monitors, select Create a Monitor, and then select Unit Monitor.
At the Monitor Type step:
- Select Microsoft SQL Server > DB Engine > User-defined SQL Query Two-State Monitor.
- In the Select destination management pack dropdown list, select a management pack that you want to use. Or select New to create a new one.
- Select Next.

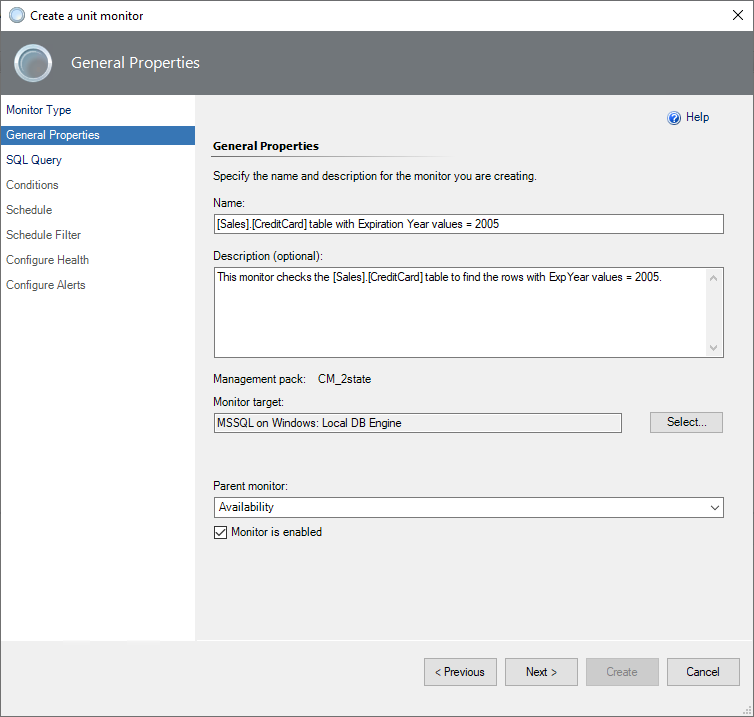
At the General Properties step:
- Enter the monitor name as
[Sales].[CreditCard] table with Expiration Year values = 2005. - Enter the description as
This monitor checks the [Sales].[CreditCard] table to find the rows with ExpYear values = 2005. - Make your selections for Monitor target as
MSSQL on Windows: Local DB Engineand Parent monitor as any of the Entity Health options. - If you want the monitor to be enabled by default, select the Monitor is enabled checkbox.
- Select Next.
- Enter the monitor name as
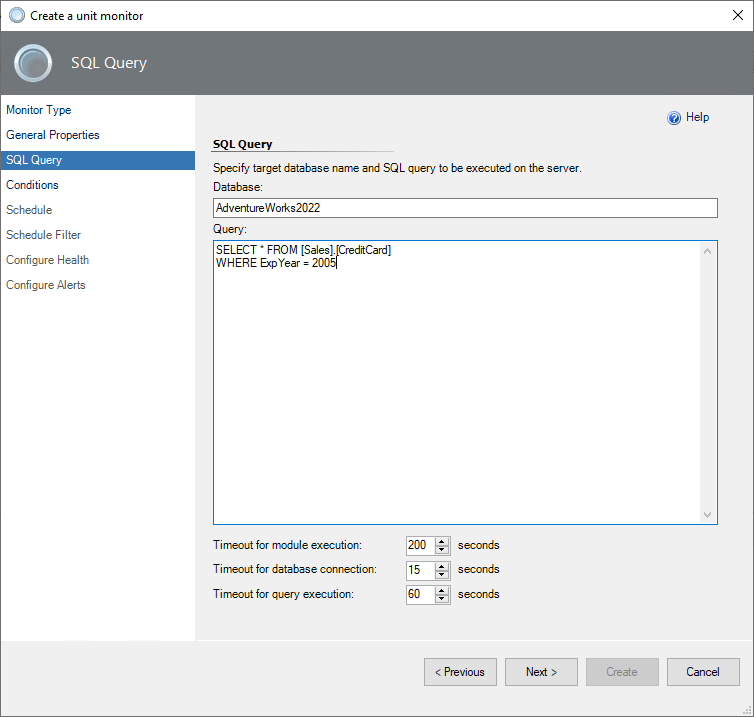
At the SQL Query step:
- Enter the database name as
AdventureWorks2022. - Enter the query text.
- Select the timeouts (in seconds).
- Select Next.
- Enter the database name as
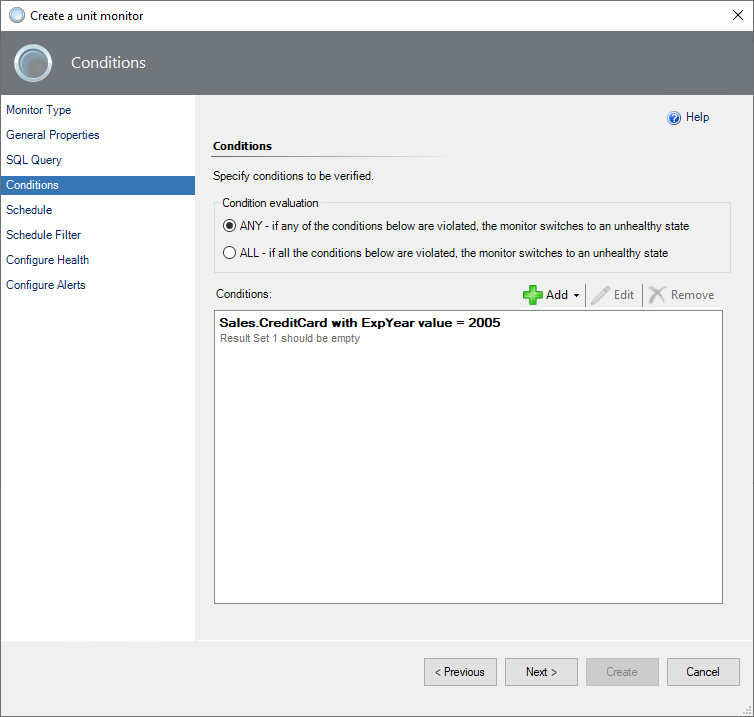
At the Conditions step:
Select the ANY condition. It means that if any of the added conditions are violated, the monitor switches to an unhealthy state. This example needs only one condition.
To add a new condition, select Add, and then select Empty Result Set. This condition checks if the specified result set that the query returned is empty.
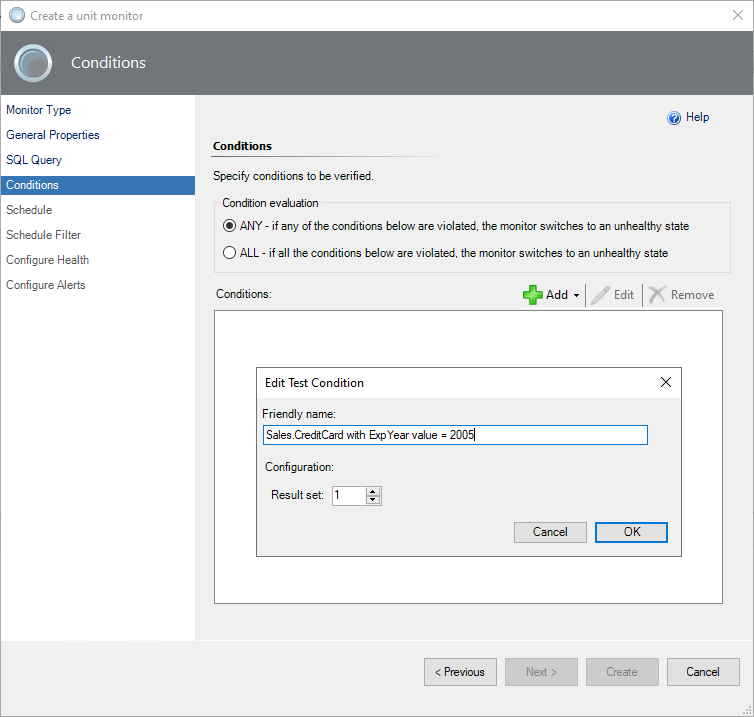
The monitor operates based on a condition that checks the query result if no rows that correspond to the expiring year 2005 are returned. Otherwise, the monitor switches to an unhealthy state.
Select Next.
At the Schedule and Schedule Filter steps, leave the default values. The monitor will process the data without a schedule, once every 15 minutes.
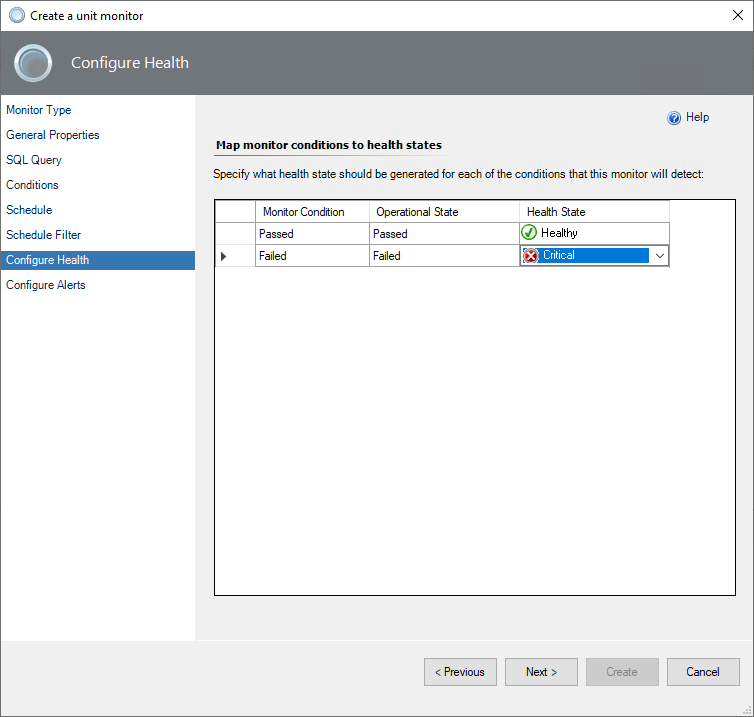
At the Configure Health step:
- Select Critical as the health state that the monitor should generate if the condition fails.
- Change the Operational State information if necessary.
- Select Next.
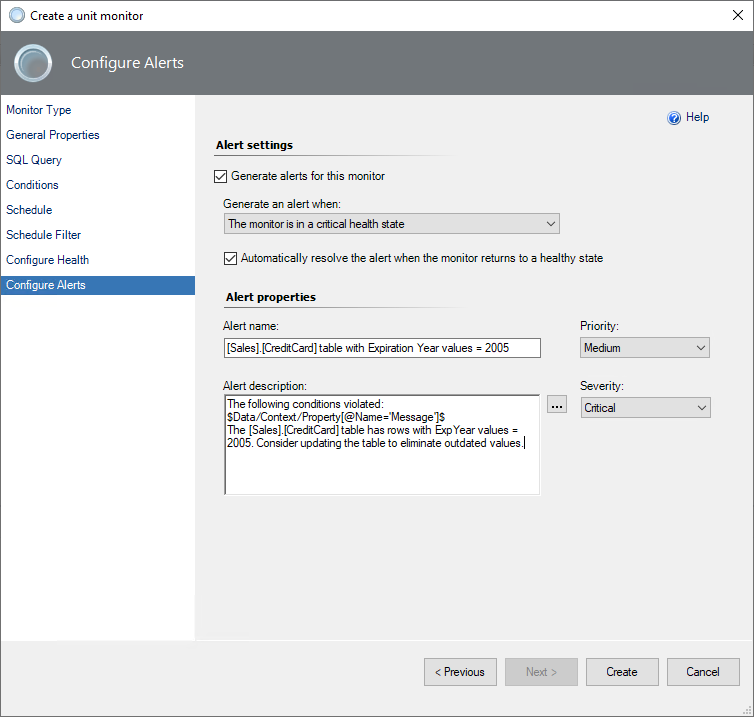
At the Configure Alerts step:
- Select Generate alerts for this monitor.
- Set Alert name as
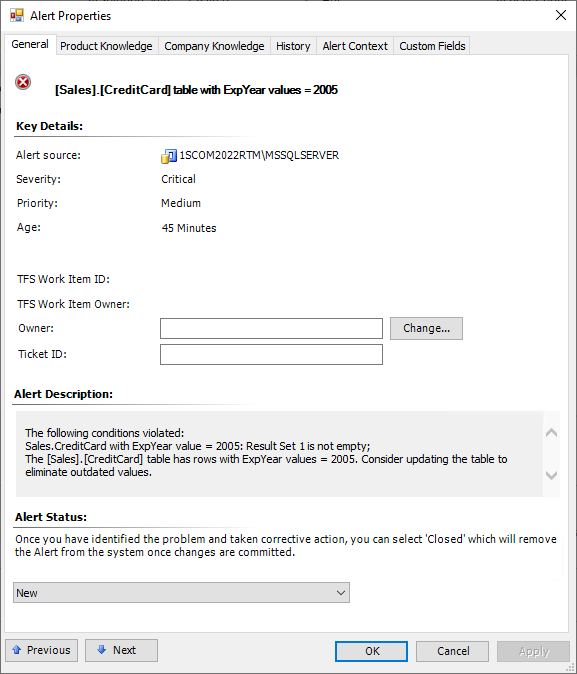
[Sales].[CreditCard] table with ExpYear values = 2005. - Set Alert description as
The following conditions violated: $Data/Context/Property[@Name='Message']$ The [Sales].[CreditCard] table has rows with ExpYear values = 2005. Consider updating the table to eliminate outdated values. - When you finish configuring alert properties, select Create.
After you create the custom monitor, you can run it to see how it changes its state and generates an alert. In this example, the monitor should switch to the critical state, because the resulting query returns several records in the Sales.CreditCard table with the expiring year 2005.
Tip
By default, a custom query-based monitor works for all SQL Server instances. To avoid alert storming on instances where the sample database doesn't exist, you need to override the monitor target only to a specific SQL Server instance that hosts the AdventureWorks2022 database. In the monitor's override properties:
- Set
Enabled = Falsefor theMSSQL on Windows: DB Engineclass. - Set
Enabled = Truefor the specificSQL Server DB Engineobject that hosts theAdventureWorks2022sample database.
Example 2 with "Empty Result Set"
In this example, consider the condition under which the Production.Illustration table is checked to ensure that for each IllustrationID record, an entry also exists in the Production.ProductModelIllustration table, because the Illustration table has the schema-bound dependency for the ProductModelIllustration table:
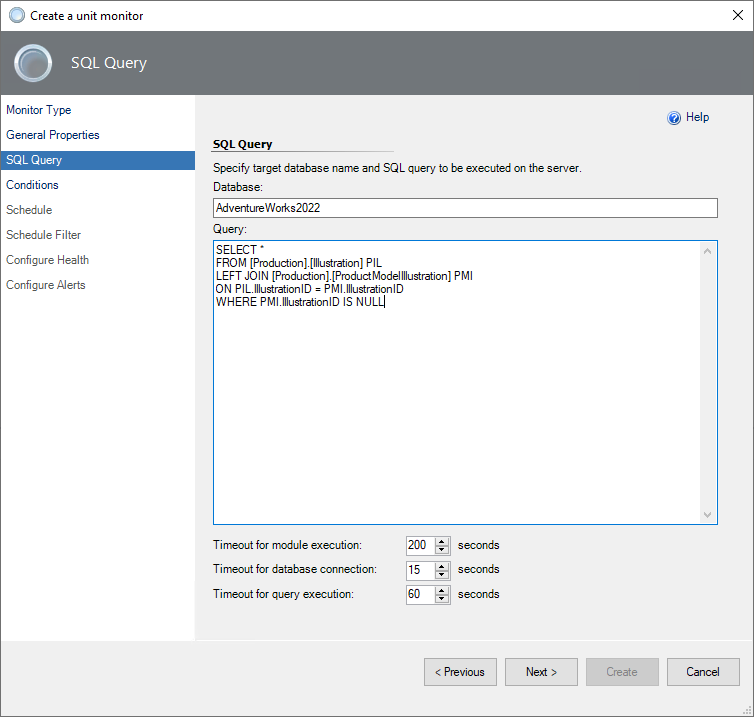
SELECT *
FROM [Production].[Illustration] PIL
LEFT JOIN [Production].[ProductModelIllustration] PMI
ON PIL.IllustrationID = PMI.IllustrationID
WHERE PMI.IllustrationID IS NULL
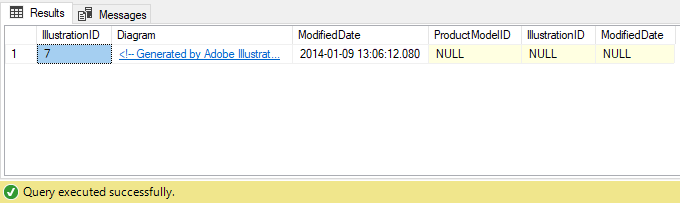
The query returns one record without a model illustration in the Production.ProductModelIllustration table:
To create a monitor that changes its state to unhealthy if the Illustration table doesn't contain models in the dependent ProductModelIllustration table, follow these steps:
In the System Center Operations Manager console, go to Authoring > Management Pack Objects. Right-click Monitors, select Create a Monitor, and then select Unit Monitor.
At the Monitor Type step:
- Select Microsoft SQL Server > DB Engine > User-defined SQL Query Two-State Monitor.
- In the Select destination management pack dropdown list, select a management pack that you want to use. Or select New to create a new one.
- Select Next.
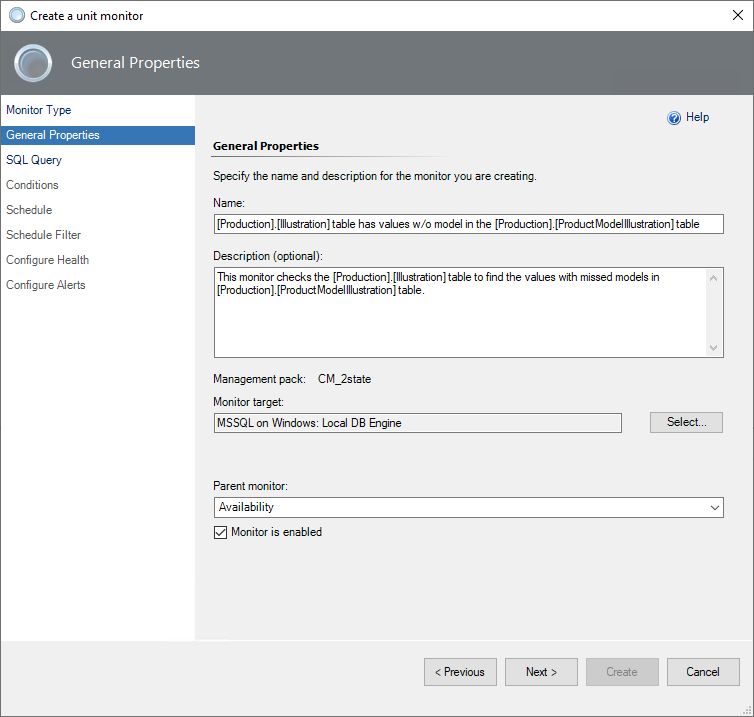
At the General Properties step:
- Enter the monitor name as
[Production].[Illustration] table has values w/o model in the [Production].[ProductModelIllustration] table. - Enter the description as
This monitor checks the [Production].[Illustration] table to find the values with missed models in [Production].[ProductModelIllustration] table. - Make your selections for Monitor target as
MSSQL on Windows: Local DB Engineand Parent monitor as any of the Entity Health options. - If you want the monitor to be enabled by default, select the Monitor is enabled checkbox.
- Select Next.
- Enter the monitor name as
At the SQL Query step:
- Enter the database name as
AdventureWorks2022. - Enter the query text.
- Select the timeouts (in seconds).
- Select Next.
- Enter the database name as
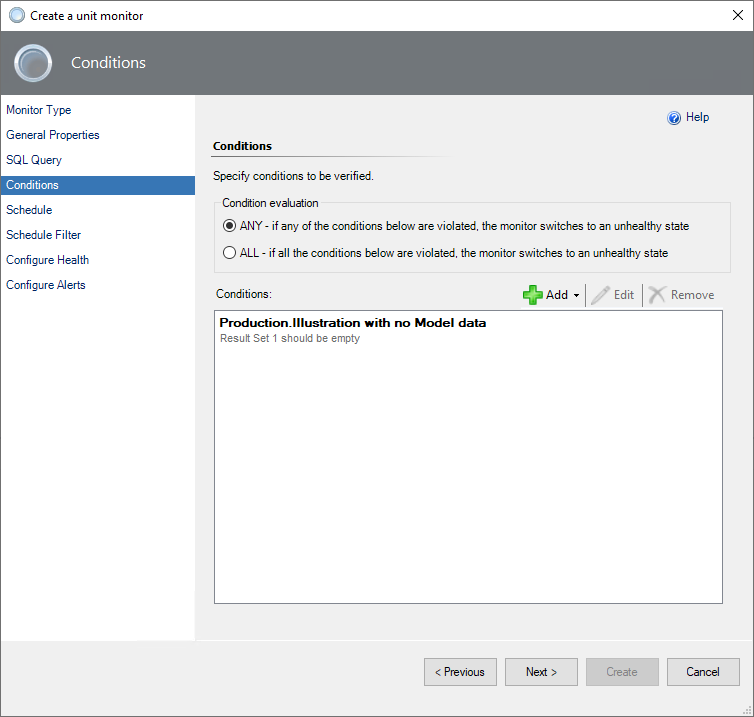
At the Conditions step:
Select the ANY condition. It means that if any of the added conditions are violated, the monitor switches to an unhealthy state. This example needs only one condition.
To add a new condition, select Add, and then select Empty Result Set. This condition checks if the specified result set that the query returned is empty.
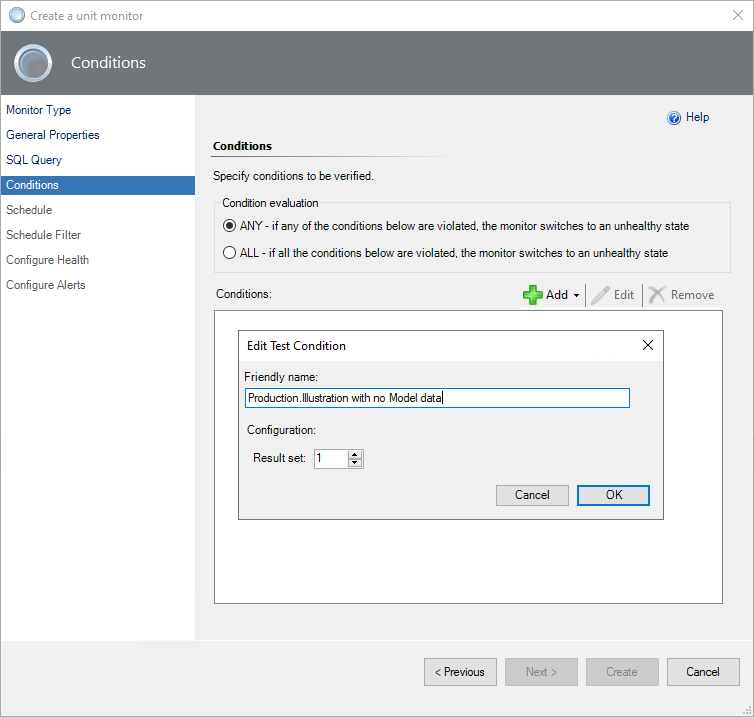
The monitor operates based on a condition that checks the query result if no illustration IDs that correspond to models are returned. Otherwise, the monitor switches to an unhealthy state.
Select Next.
At the Schedule and Schedule Filter steps, leave the default values. The monitor will process the data without a schedule, once every 15 minutes.
At the Configure Health step:
- Select Critical as the health state that the monitor should generate if the condition fails.
- Change the Operational State information if necessary.
- Select Next.
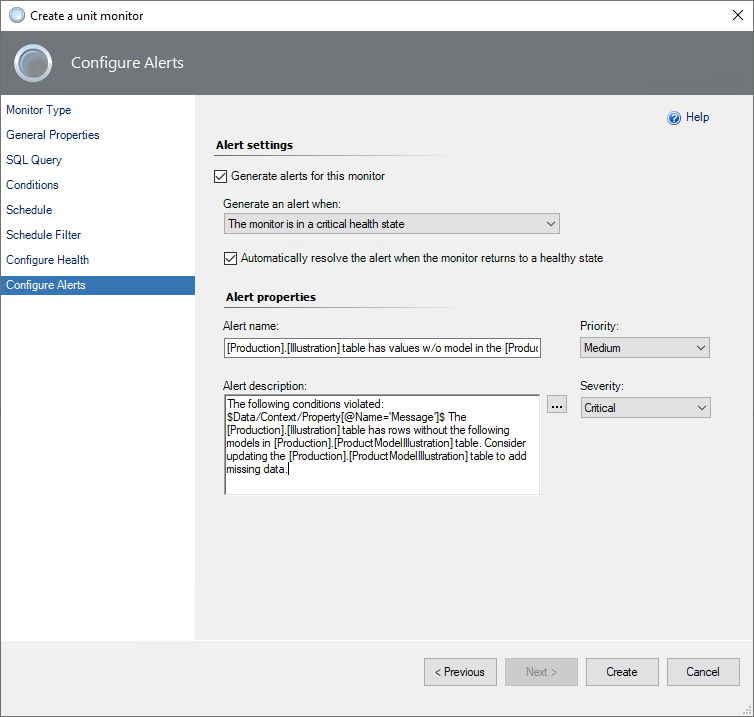
At the Configure Alerts step:
- Select Generate alerts for this monitor.
- Set Alert name as
[Production].[Illustration] table has values w/o model in the [Production].[ProductModelIllustration] table. - Set Alert description as
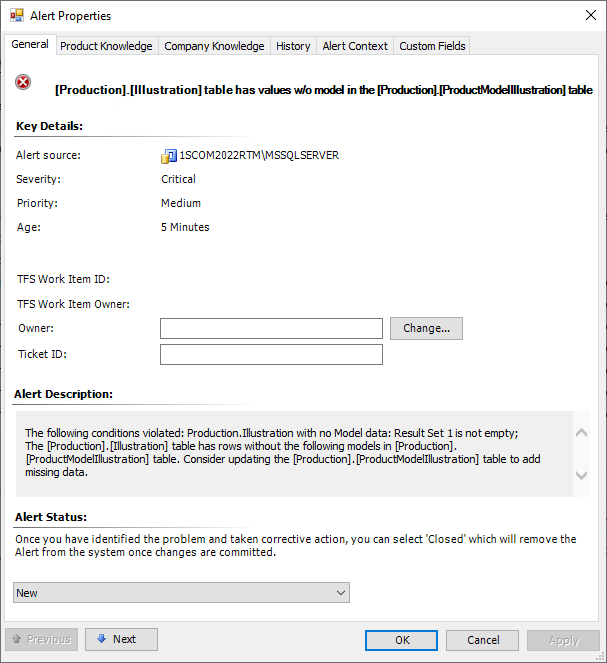
The following conditions violated: $Data/Context/Property[@Name='Message']$ The [Production].[Illustration] table has rows without the following models in [Production].[ProductModelIllustration] table. Consider updating the [Production].[ProductModelIllustration] table to add missing data. - When you finish configuring alert properties, select Create.
After you create the custom monitor, you can run it to see how it changes its state and generates an alert. In this example, the monitor should switch to the critical state because the resulting query returns a record in the Product.Illustration table, whereas there's no data for the Product.ProductModelIllustration table.
Example 3 with "Not Empty Result Set and Scalar Value"
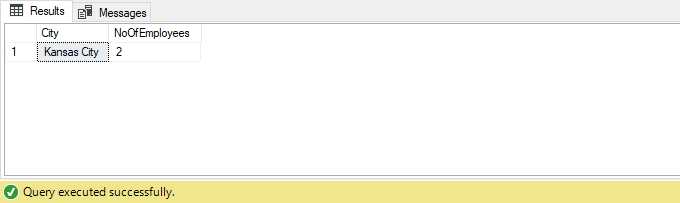
In this example, consider the condition under which the Person.Address table is checked to ensure that for the Kansas City record, the number of employees from the Person.BusinessEntityAddress table is no more than one. Also, the result set of the query should not be empty. That means the Kansas City record exists in the Person.Address table:
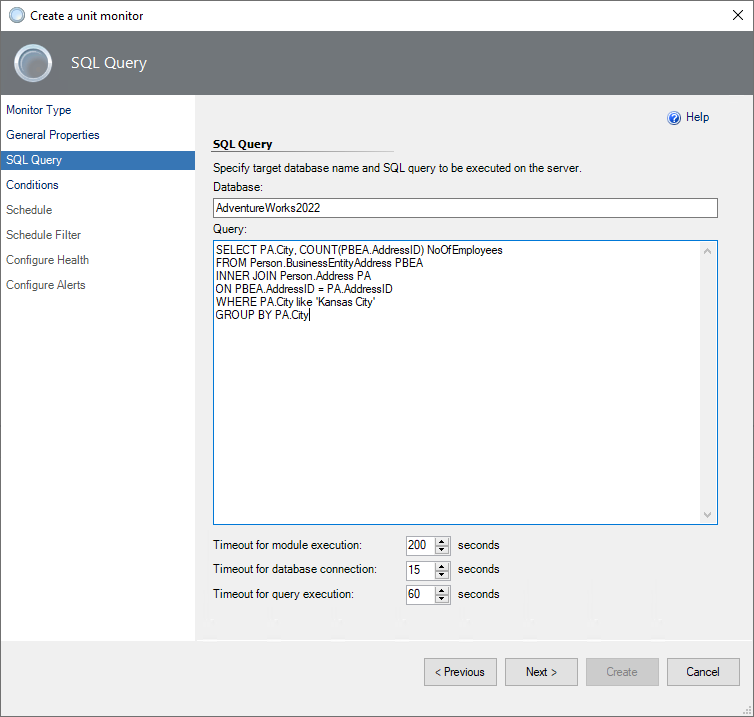
SELECT PA.City, COUNT(PBEA.AddressID) NoOfEmployees
FROM Person.BusinessEntityAddress PBEA
INNER JOIN Person.Address PA
ON PBEA.AddressID = PA.AddressID
WHERE PA.City like 'Kansas City'
GROUP BY PA.City
As a result of the query, the Kansas City record exists and the number of employees for that city is two:
To create a monitor that changes its state to unhealthy if the Person.Address table contains a Kansas City record with more than one employee, follow these steps:
In the System Center Operations Manager console, go to Authoring > Management Pack Objects. Right-click Monitors, select Create a Monitor, and then select Unit Monitor.
At the Monitor Type step:
- Select Microsoft SQL Server > DB Engine > User-defined SQL Query Two-State Monitor.
- In the Select destination management pack dropdown list, select a management pack that you want to use. Or select New to create a new one.
- Select Next.
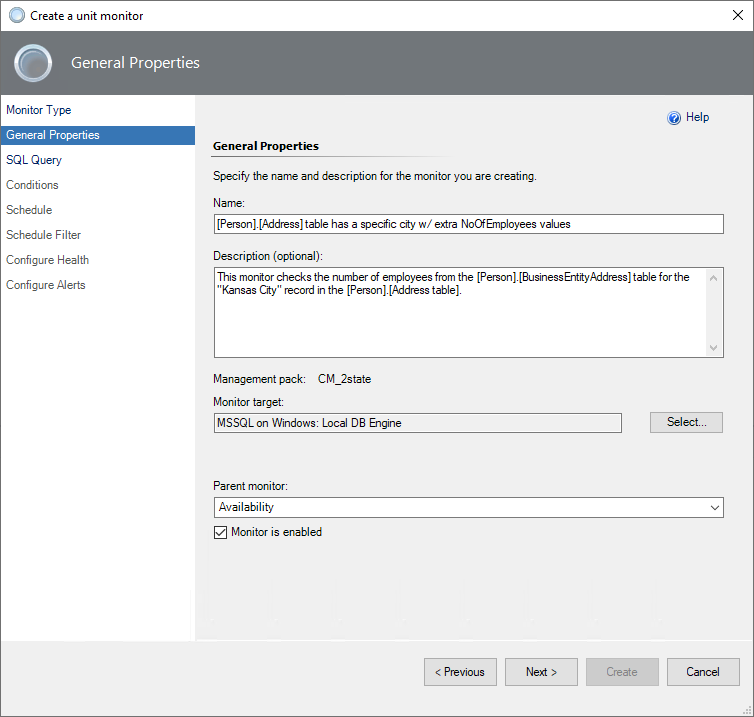
At the General Properties step:
- Enter the monitor name as
[Person].[Address] table has a specific city w/ extra NoOfEmployees values. - Enter the description as
This monitor checks the number of employees from the [Person].[BusinessEntityAddress] table for the "Kansas City" record in the [Person].[Address table]. - Make your selections for Monitor target as
MSSQL on Windows: Local DB Engineand Parent monitor as any of the Entity Health options. - If you want the monitor to be enabled by default, select the Monitor is enabled checkbox.
- Select Next.
- Enter the monitor name as
At the SQL Query step:
- Enter the database name as
AdventureWorks2022. - Enter the query text.
- Select the timeouts (in seconds).
- Select Next.
- Enter the database name as
At the Conditions step:
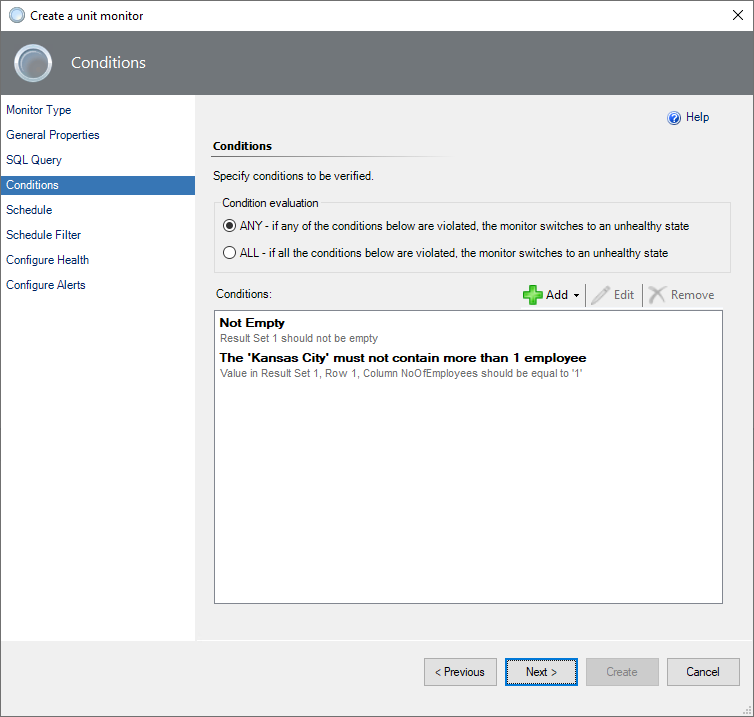
Select the ANY condition. It means that if any of the added conditions are violated, the monitor switches to an unhealthy state. This example needs both conditions because the monitor checks not only the number of employees for a certain city, but also whether the city exists in the table.
To add a first condition, select Add, and then select Not Empty Result Set. This condition checks if the specified result set that the query returned is not empty.
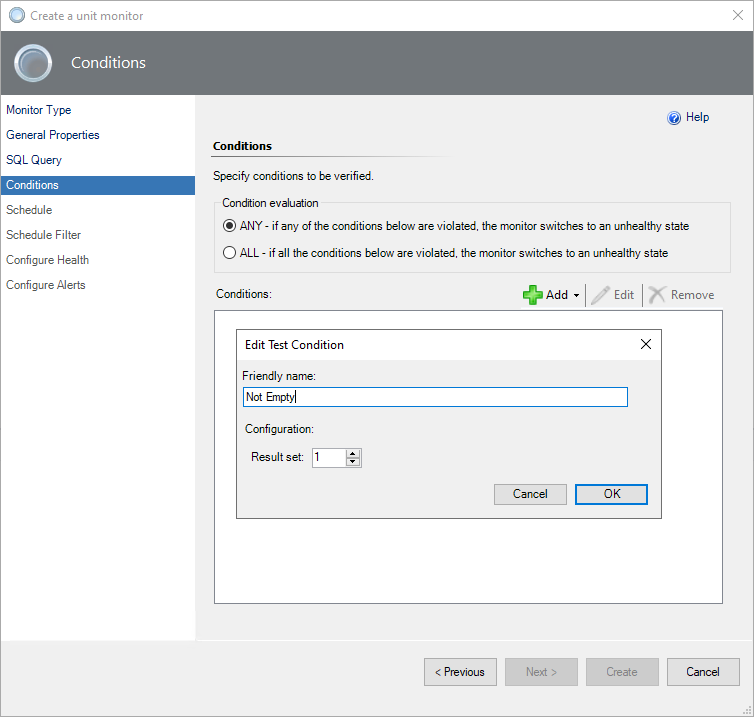
To add a second condition, select Add, and then select Scalar Value. This condition checks if the specified result set, specified row number, and specified column name (that is, cell value) are equal to 1.
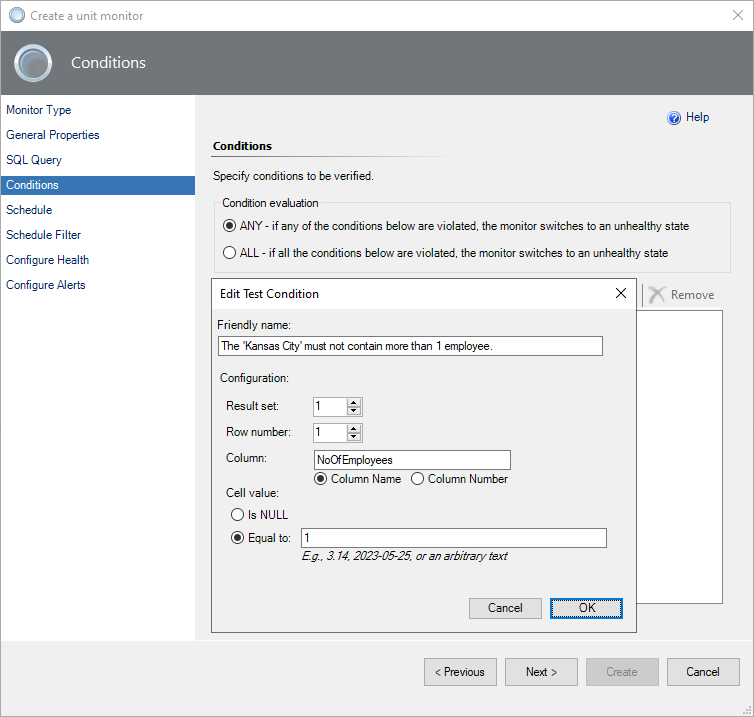
The monitor operates based on conditions that check that the query result is not empty and the number of employees is equal to 1. Otherwise, the monitor switches to an unhealthy state.
Select Next.
At the Schedule and Schedule Filter steps, leave the default values. The monitor will process the data without a schedule, once every 15 minutes.
At the Configure Health step:
- Select Critical as the health state that the monitor should generate if the condition fails.
- Change the Operational State information if necessary.
- Select Next.
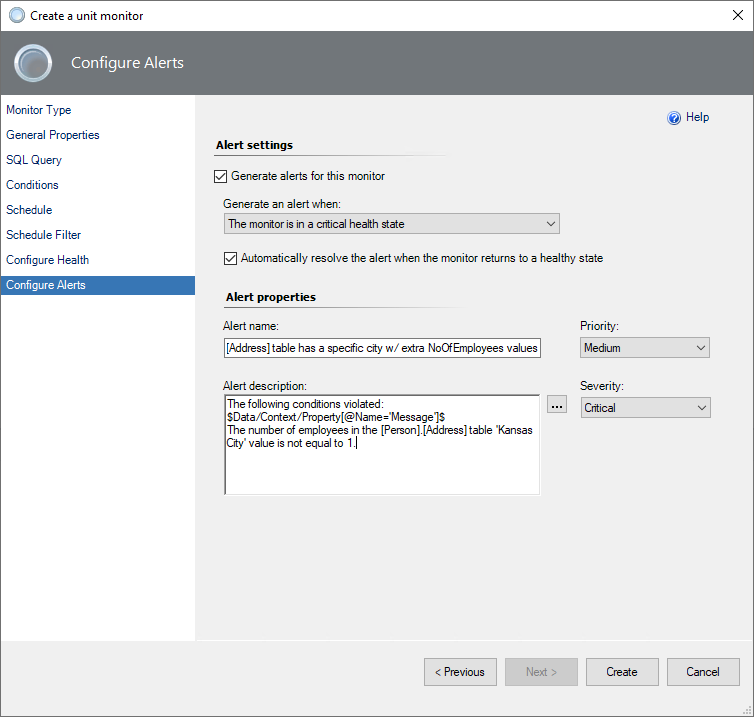
At the Configure Alerts step:
- Select Generate alerts for this monitor.
- Set Alert name as
[Person].[Address] table has a specific city w/ extra NoOfEmployees values. - Set Alert description as
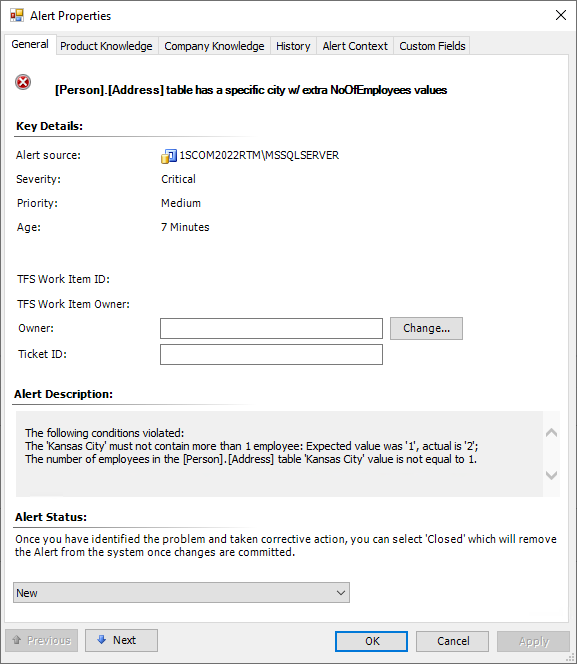
The following conditions violated: $Data/Context/Property[@Name='Message']$ The number of employees in the [Person].[Address] table 'Kansas City' value is not equal to 1. - When you finish configuring alert properties, select Create.
After you create the custom monitor, you can run it to see how it changes its state and generates an alert. In this example, the monitor should switch to the critical state because the resulting query returns a record in the Person.Address table and there are two employees for Kansas City in the Person.BusinessEntityAddress table.