Create a dashboard with the Performance widget in the Web console
In System Center Operations Manager version 2019 and later, the Web console provides a monitoring interface for a management group that can be opened on any computer using any browser that has connectivity to the Web console server. The following steps describe how to create a dashboard in the new HTML5 Web console with the Performance widget.
Add widget to dashboard
Open a web browser on any computer and enter
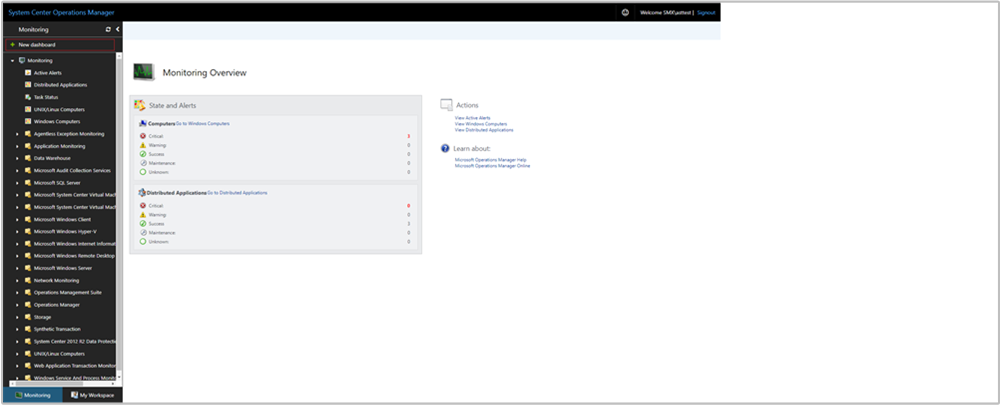
http://<web host>/OperationsManager, where web host is the name of the computer hosting the web console.From the left pane in the Web console, select + New dashboard.
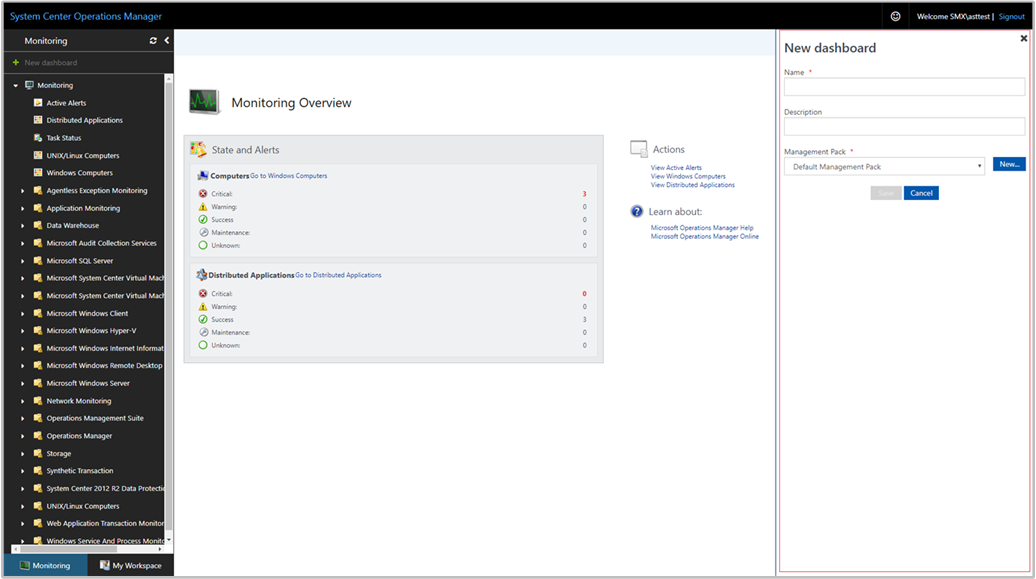
On the Create New Dashboard page, provide a name and description for the dashboard you want to create.
You can save the dashboard in an existing unsealed management pack by selecting the management pack from the Management Pack dropdown list or you can save the dashboard by creating a new management pack by selecting New next to the Management Pack dropdown list and provide a name, description, and optionally a version number.
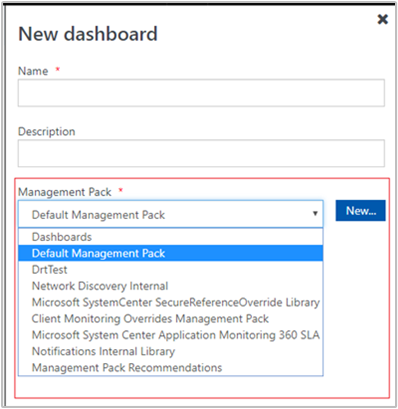
When you have completed specifying where to save the new dashboard to, select OK.
Select Save after providing a name and description for the new dashboard.
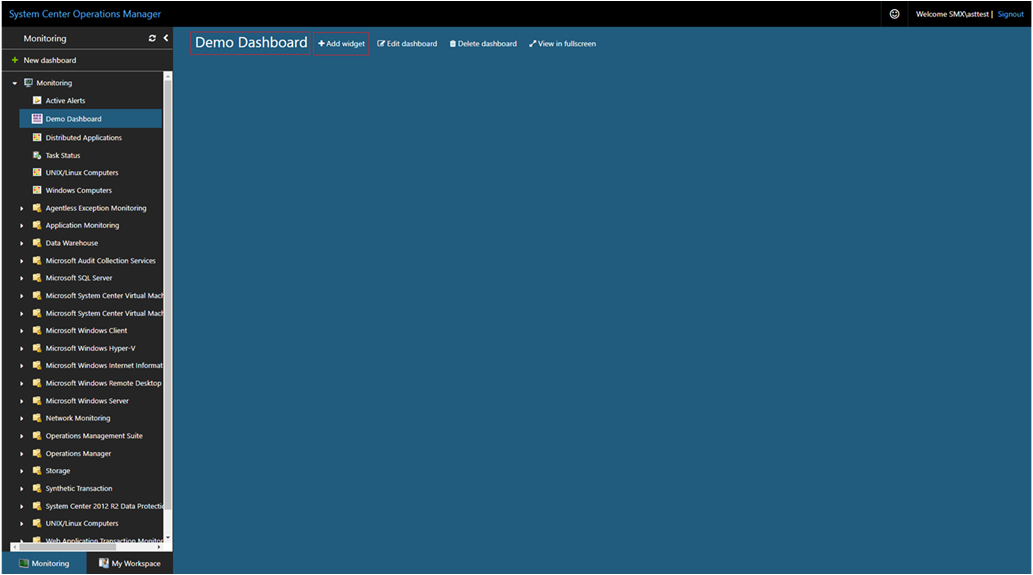
On the blank empty dashboard, you see the dashboard name, Add Widget, Edit Dashboard, Delete dashboard, and View in fullscreen options on the top of the page.
Select Performance Widget from the Select Widget dropdown list.
In the Performance widget pane, select scope for the widget by selecting either Groups or Class.
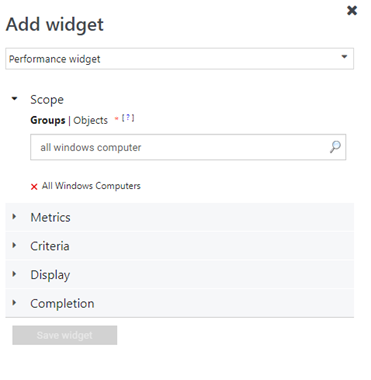
For either option selected, you can search by keyword in the list. As you begin typing, the list filters based on your input. You can select an individual group or class or multiple from the returned results.
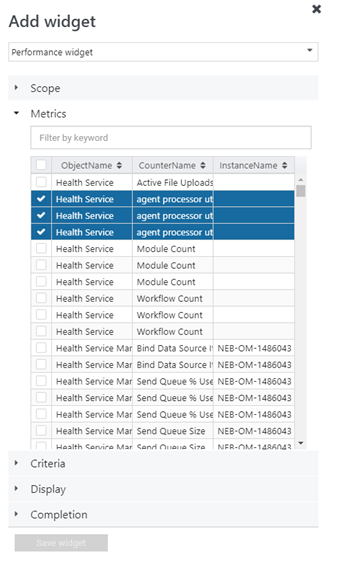
Under Metrics, search for the performance objects and counters in the search box. For the results returned, select the object and counter. If there are multiple instances for the counter, you can select the counter instances from the dropdown list. This will only be visible if there are multiple instances for the selected counter.
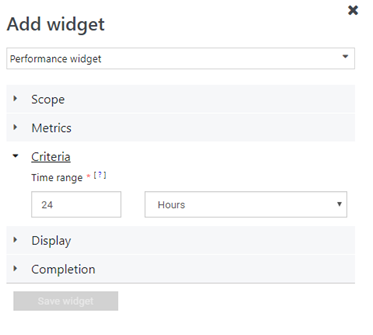
Set the criteria to identify the widget to display. To narrow the results, you can filter by selecting a time range.
Data matching the defined criteria will only be displayed in the widget.
Select Display to choose the columns to be displayed in the dashboard. You can select or search for the columns from the dropdown list.
The widget can also be visualized as Objects by performance widget. If you wish to visualize object by performance widget, then select Visualize objects by performance.
Complete the configuration by providing a Name, Description, and Widget refresh interval (default interval is 5 minutes) for the widget. Select Save Widget to save your new dashboard.
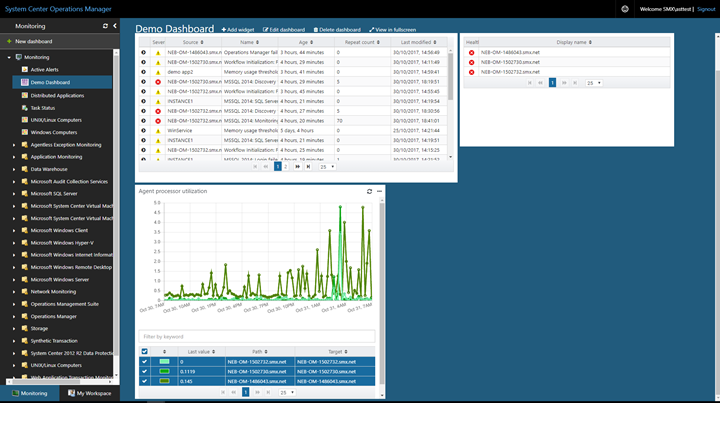
After the widget has been created, it displays a performance graph with the selected objects based on the scope and criteria defined. You see the name of the performance widget along with the number of objects in the header of the widget.
Actions on Performance widget
With a performance widget, you can perform such actions as:
- Specify the minimum and maximum vertical axis values
- Export the alerts to Excel for further analysis
- Modify your selection of legend or enable/disable Visualize objects by performance, customized to your personal needs
To perform these actions, hover your mouse over the widget and select the ellipsis ... at the top right corner of the widget. This will display actions available for the widget.
- Select Set vertical axis to modify the scale values of the y axis and select Save.
- Select Export to Excel to export the alert data to an Excel file.
- Select Personalize to change your selection of columns to be displayed or to group alerts. Select Save personalization when you've completed making your changes.
Next steps
To learn how to create a dashboard in the new web console with the State widget, see How create a dashboard with the State widget in the Web console.
