Data quality report in Microsoft Purview Unified Catalog
The Data Quality (DQ) report is a comprehensive document that evaluates and summarizes the quality of data within an organization or system. It typically includes assessments of various data quality dimensions, and metrics to help stakeholders understand the accuracy, completeness, consistency, reliability, and timeliness of their data. This data quality report allows your team to track your health management progress at a glance, and identify areas that need more work to improve the quality of data in your data estate.
This article covers how you can access this report and what the provided data quality measure means for your health management.
Report purposes
Monitoring and governance: to continuously monitor and manage the quality of data, ensuring it meets the organization’s standards and regulatory requirements.
Decision support: to provide stakeholders with reliable data for making informed business decisions.
Identifying issues: to detect and document data quality issues, enabling timely remediation.
Improving data management: to enhance data management practices by identifying root causes of data quality problems and implementing corrective measures.
Performance Measurement: to measure the effectiveness of data quality initiatives and track improvements over time.
Stakeholder Communication: to communicate data quality status and progress to stakeholders, including management, data product owners, data stewards, and IT teams. By providing a clear and comprehensive view of the state of data quality, these reports play a crucial role in maintaining the integrity and usefulness of data within an organization.
Prerequisites
You need data health reader permissions to be able to view Data Estate Health information.
View data governance health report
- Open the Microsoft Purview portal and select Unified Catalog.
- Select the Health Management drop-down.
- Select Reports
- Select the Data health report.
Data quality dimension reporting
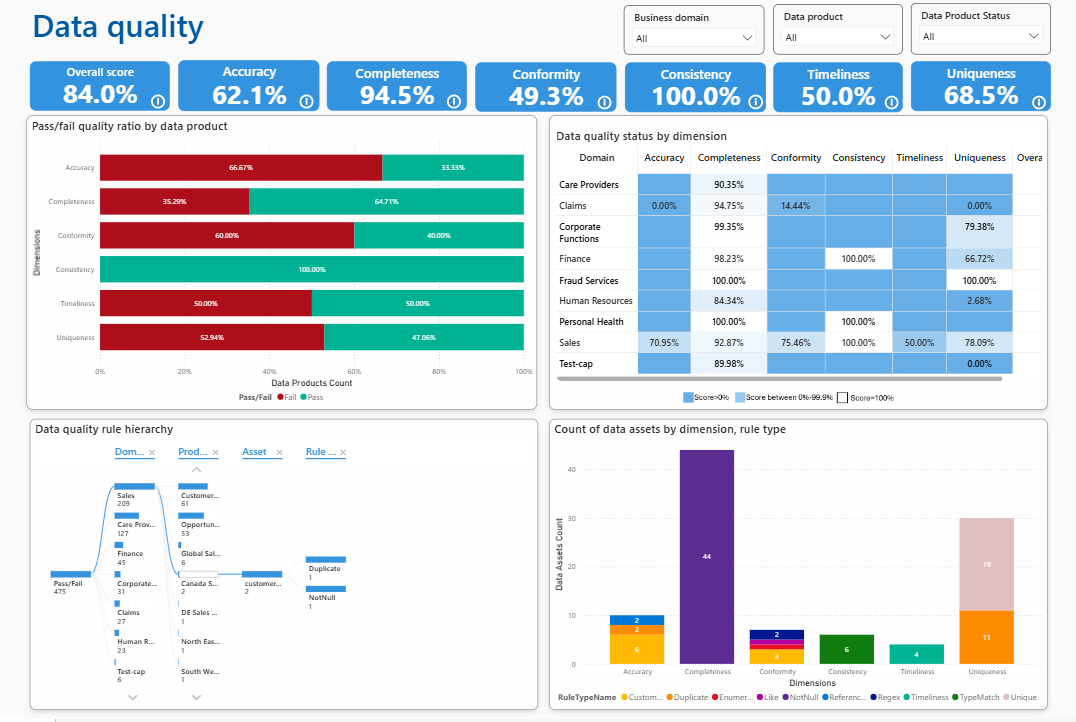
The overview page of the report covers data quality dimensions scores, data quality rule hierarchy, data quality status by dimension, and data quality dimensions & rule types used for different data assets. The top controls help you understand your overall health management at a glance.
Use the filters to see information for specific governance domains, data products, or data products in a certain status (for example: draft).
| Data Quality Dimension | Description |
|---|---|
| Accuracy | Data should accurately represent real-world entities. Context matters! For example, if you’re storing customer addresses, ensure they match the actual locations. |
| Completeness | The objective of this rule is to identify the empty, null, or missing data. This rule validates that all values are present (though not necessarily correct). |
| Conformity | This rule ensures that the data follows data formatting standards such as representation of dates, addresses, and allowed values. |
| Consistency | This rule checks that different values of the same record are in conformity with a given rule and there are no contradictions. Data consistency ensures that the same information is represented uniformly across different records. For instance, if you have a product catalog, consistent product names and descriptions are crucial. |
| Timeliness | This rule aims to ensure that the data is accessible in as short a time as possible. It ensures that the data is up to date. |
| Uniqueness | This rule checks that values aren't duplicated, for example, if there's supposed to be only one record per customer, then there aren't multiple records for the same customer. Each customer, product, or transaction should have a unique identifier. |
Data Quality Overall score and dimension scores help data practitioners and data estate owners understand how complete, accurate, consistent, and trustworthy their data is. It also indicates what improvement actions need to be taken to enhance the quality of their data estate.
Tip
If you use the filters, these KPIs will reflect scores for the governance domains or data products selected.
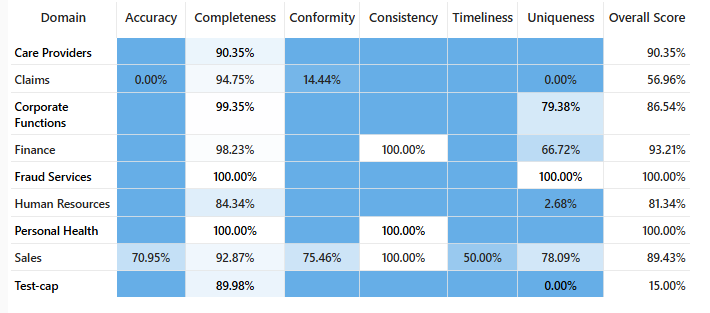
Data quality status by dimensions
Data quality dimensions scores are calculated for each governance domain. Dimensions mapped with rules, and the score rolled up all the way from data asset columns to data asset, and from data asset to data product and Governance domain level for each industry standard dimension. You can filter out dimensions level score per governance domain to investigate more details.
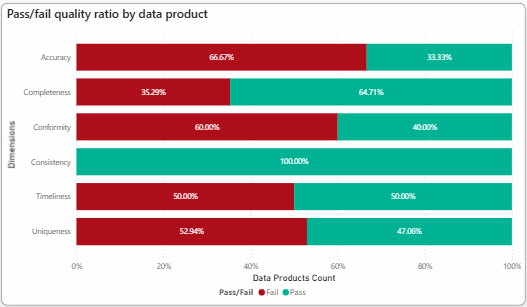
Data Quality rules pass and fail ratio
The pass and fail ratio of data quality rules has been measured for each DQ dimension for data products. This measure helps data owners and data practitioners to understand what percentage of data in a data product is inaccurate, inconsistent, incomplete, duplicate, or not fresh enough as expected. This measure also helps to investigate and understand whether the applied rules are incorrect or the data is incorrect.
Data quality details report
This report helps to understand how many rules are applied to data products, data assets, and critical data elements to measure and monitor the quality of the entire data estate of the organization. You can drill down to see how many records of a data asset failed for a rule type, which rule type is performing better, and which governance domain and data products are publishing and maintaining trustworthy data. You can filter the measures by governance domain and data product to understand the current state and to plan improvement actions.
Note
- The Data Quality Health Report has dependencies on Data Health Controls and Purview Metadata Self-serve analytics model. If customers don't use the Data Health Controls and don't subscribe Purview Unified Catalog metadata then the Data Quality Health Report won't be refreshed. Customers either need to use Data Health Controls or need to subscribe purview metadata for self-serve analytics to refresh Data Quality health report.
- If customers don't use Data Quality feature, the Data Quality Health report will show blank because Data Quality Health report is created using data that are generating from Data Quality scan feature.


