Analyze memory usage by using the .NET Object Allocation tool
Applies to: ![]() Visual Studio
Visual Studio ![]() Visual Studio for Mac
Visual Studio for Mac
Note
This article applies to Visual Studio 2017. If you're looking for the latest Visual Studio documentation, see Visual Studio documentation. We recommend upgrading to the latest version of Visual Studio. Download it here
You can see how much memory your app uses and what code paths allocate the most memory by using the .NET Object Allocation tool.
After running the tool, you can see the function execution paths where objects are being allocated. You can then trace back to the root of the call tree that is taking up the most memory.
Setup
Select Alt+F2 to open the Performance Profiler in Visual Studio.
Select the .NET Object Allocation Tracking check box.
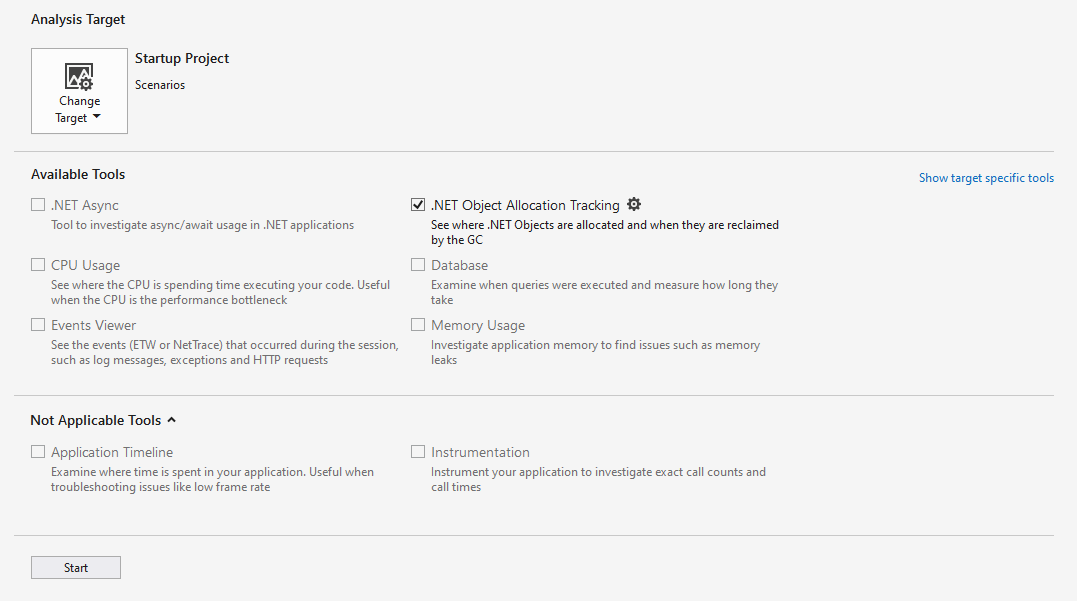
Select the Start button to run the tool.
After the tool starts running, go through the scenario you want to profile in your app. Then select Stop collection or close your app to see your data.
Select the Allocation tab. Window contents similar to the following screenshot appear.
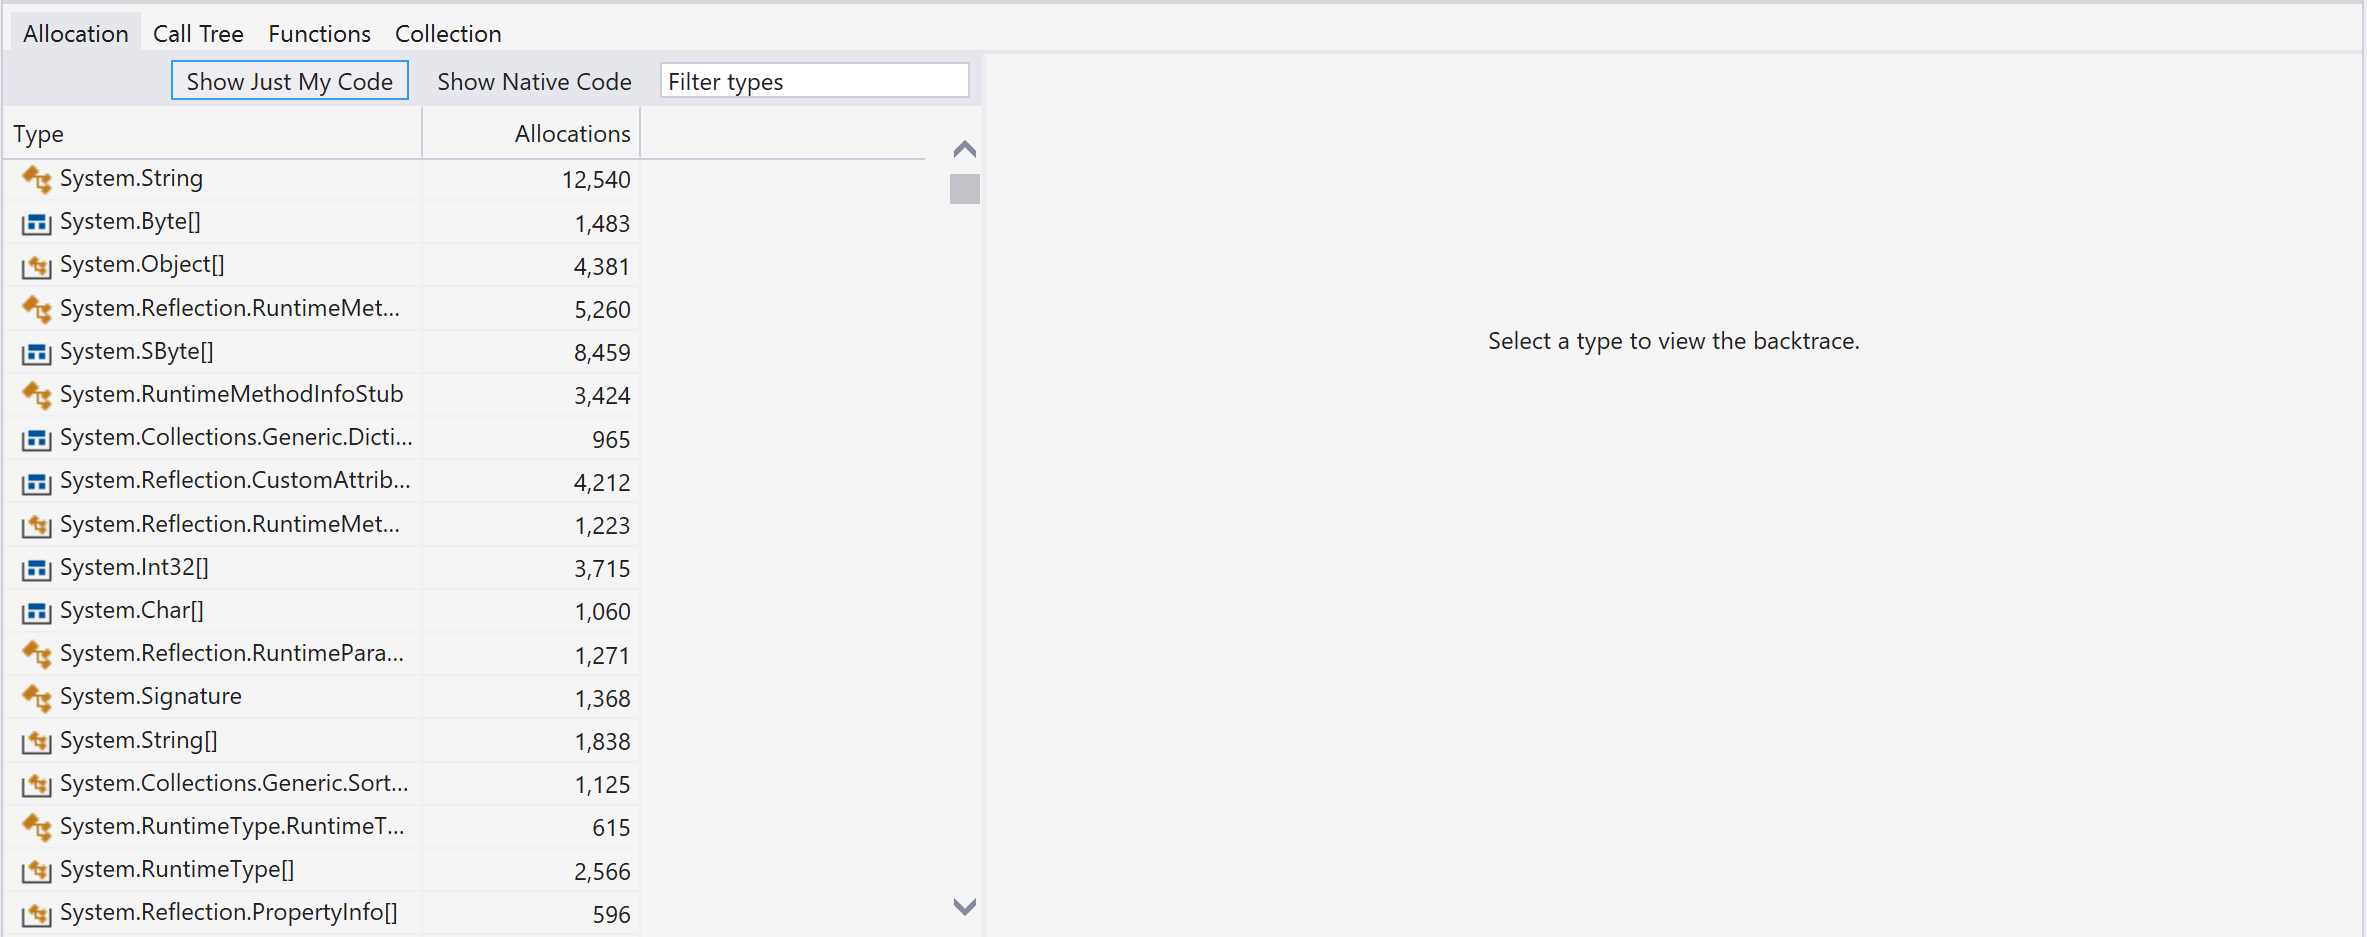
You can now analyze the memory allocation of the objects.
During collection, the tracking tool can slow down the profiled app. If performance of the tracking tool or the app is slow, and if you don't need to track every object, you can adjust the sampling rate. To do so, select the gear symbol next to the tracking tool in the profiler summary page.
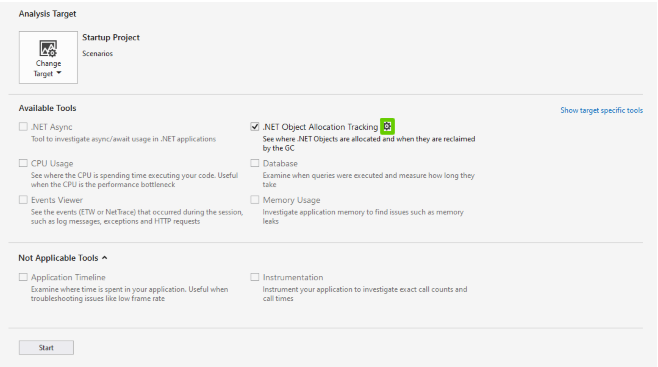
Adjust the sampling rate to the rate you want. This change helps speed up performance of your app during collection and analysis.
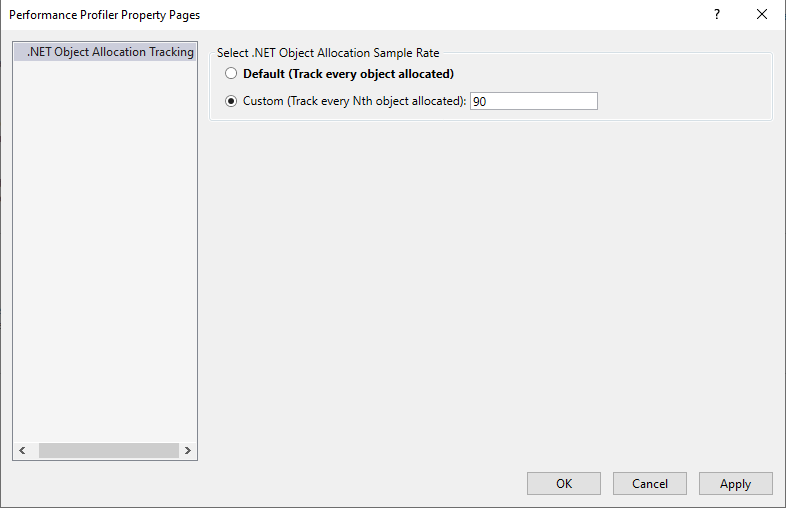
For more information on how to make the tool more efficient, see Optimizing Profiler settings.
Understand your data

In the preceding graphical view, the top graph shows the number of live objects in your app. The bottom Object delta graph shows the percentage change of app objects. Red bars denote when garbage collection took place.

You can filter the tabular data to display activity for only a specified time range. You can also zoom into or out of the graph.
Allocation
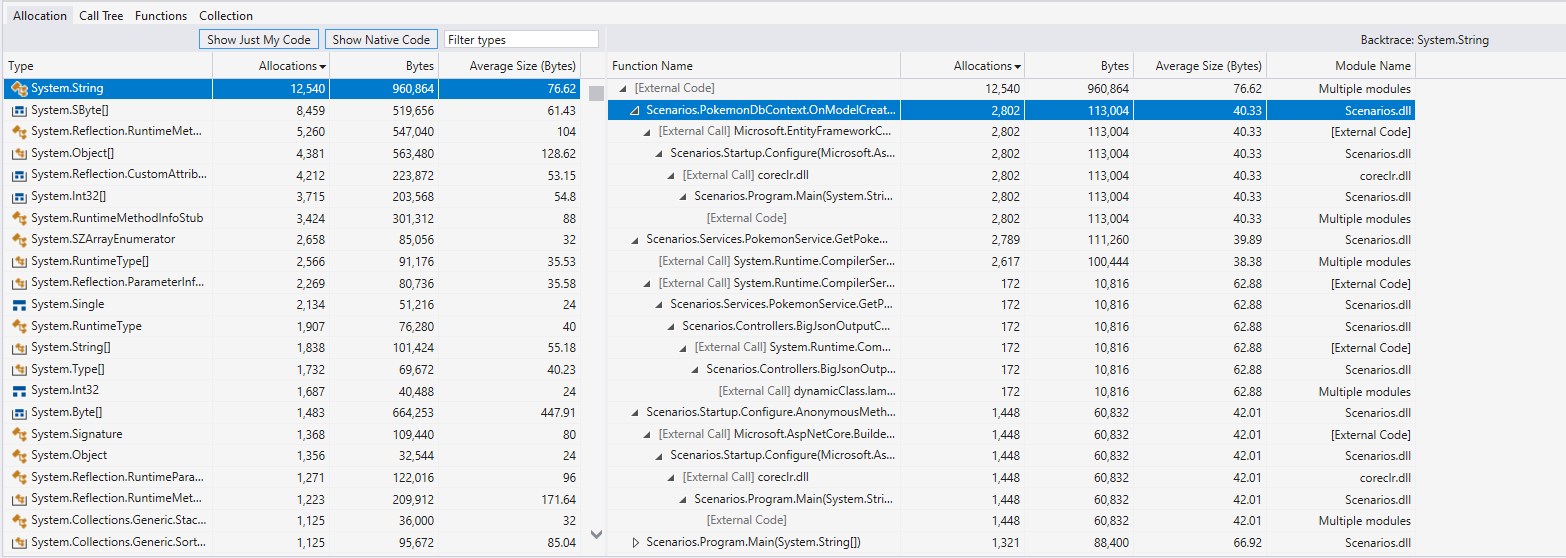
The Allocation view shows the location of objects that are allocating memory and how much memory those objects are allocating.
The Type column is a list of classes and structures that take up memory. Double-click a type to view its backtrace as an inverted call tree. In the Allocation view only, you can see items within the selected category that take up memory.
The Allocations column shows the number of objects that take up memory within a particular allocation type or function. This column appears only in the Allocation, Call Tree, and Functions views.
The Bytes and Average Size (Bytes) columns don't appear by default. To show them, right-click the Type or Allocations column, and then select the Bytes and Average Size (Bytes) options to add them to the chart.
The two columns are similar to Total (Allocations) and Self (Allocations), except they show the amount of memory taken up instead of the number of objects taking up memory. These columns appear only in the Allocation view.
The Module name column shows the module that contains the function or process that is calling.
All of these columns are sortable. For the Type and Module Name columns, you can sort items alphabetically in either ascending or descending order. For Allocations, Bytes and Average Size (Bytes), you can sort items by increasing or decreasing numeric value.
Symbols
The following symbols appear in the Allocation, Call Tree, and Functions tabs:
 - A value type like integer
 - A value-type collection like array of integers
 - A reference type like string
 - A reference-type collection like array of strings
Call Tree
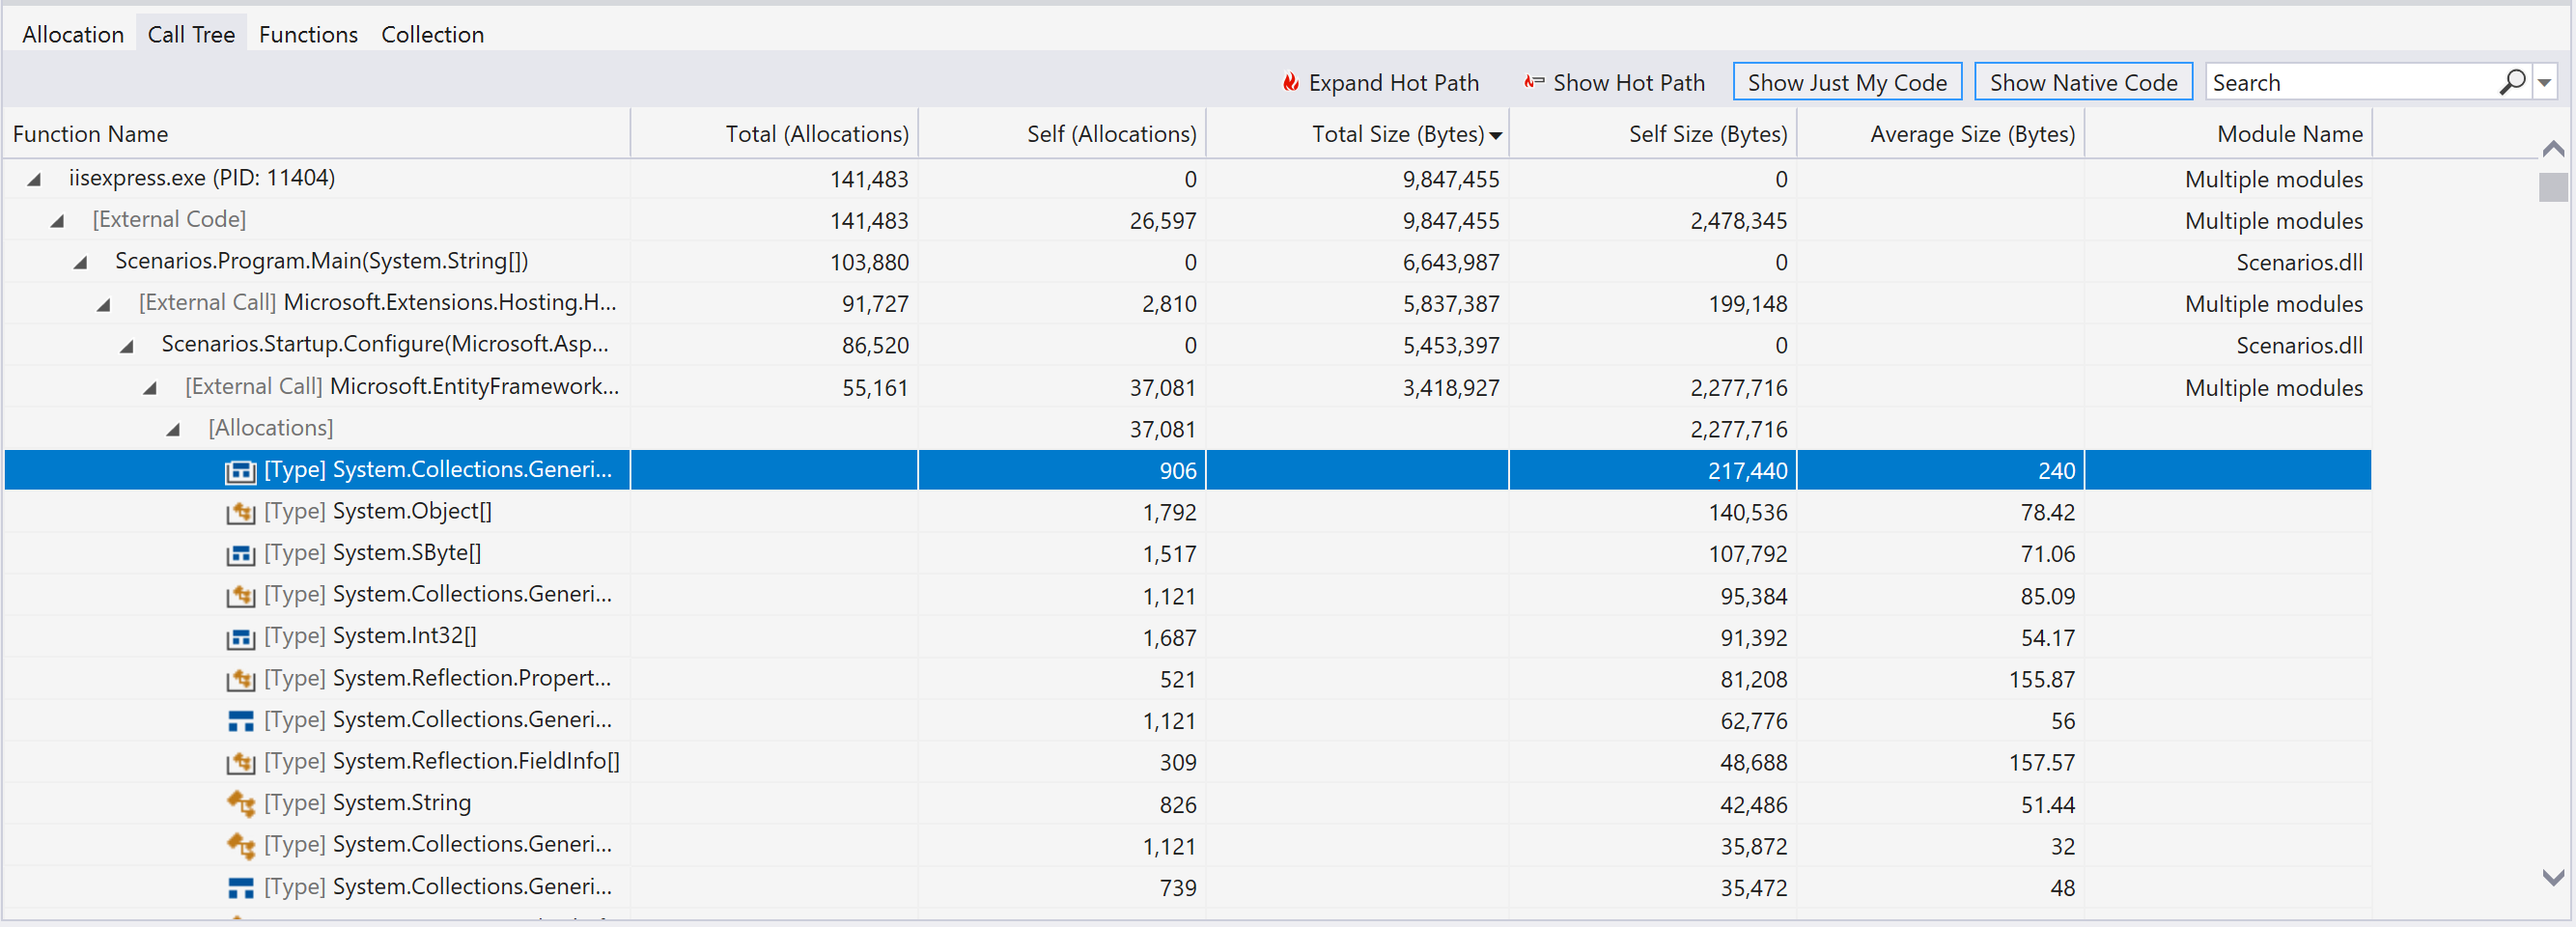
The Call Tree view shows the function execution paths that contain objects allocating much memory.
The Function Name column shows the process or name of the function containing objects that allocate memory. The display is based on the level of the node you're inspecting.
The Total (Allocations) and Total Size (Bytes) columns show the number of allocated objects and the amount of memory that is used by a function and all other functions it calls.
The Self (Allocations) and Self-Size (Bytes) columns show the number of allocated objects and the amount of memory that is used by a single selected function or allocation type.
The Average Size (Bytes) column shows the same information as it does in the Allocations view.
The Module name column shows the module that contains the function or process that is calling.
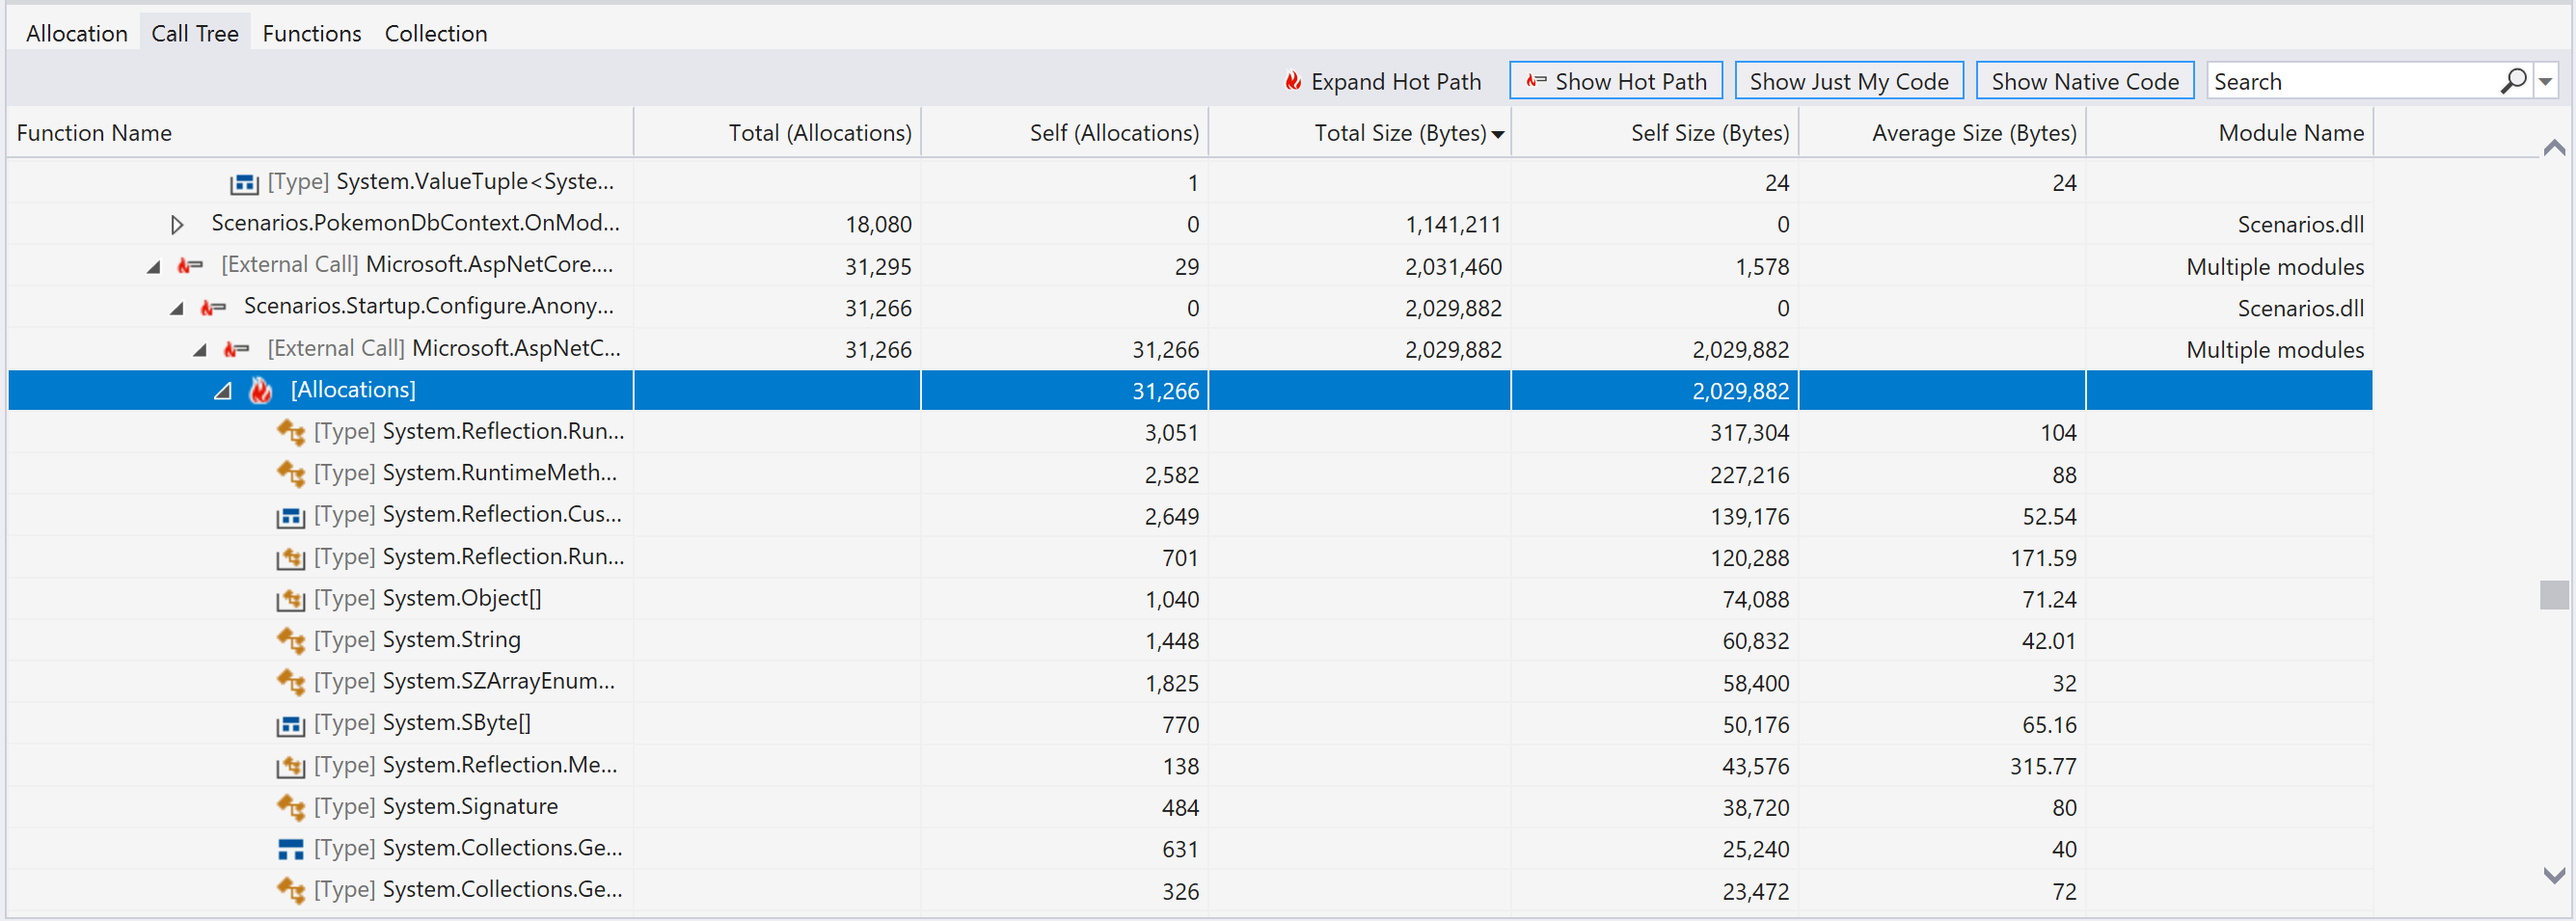
The Expand Hot Path button highlights a function execution pathway that contains many objects that are allocating memory. The algorithm starts at a node you select and highlights the path of the most allocations, guiding you in your investigation.
The Show Hot Path button shows or hides the flame symbols that indicate which nodes are part of the hot path.
Functions
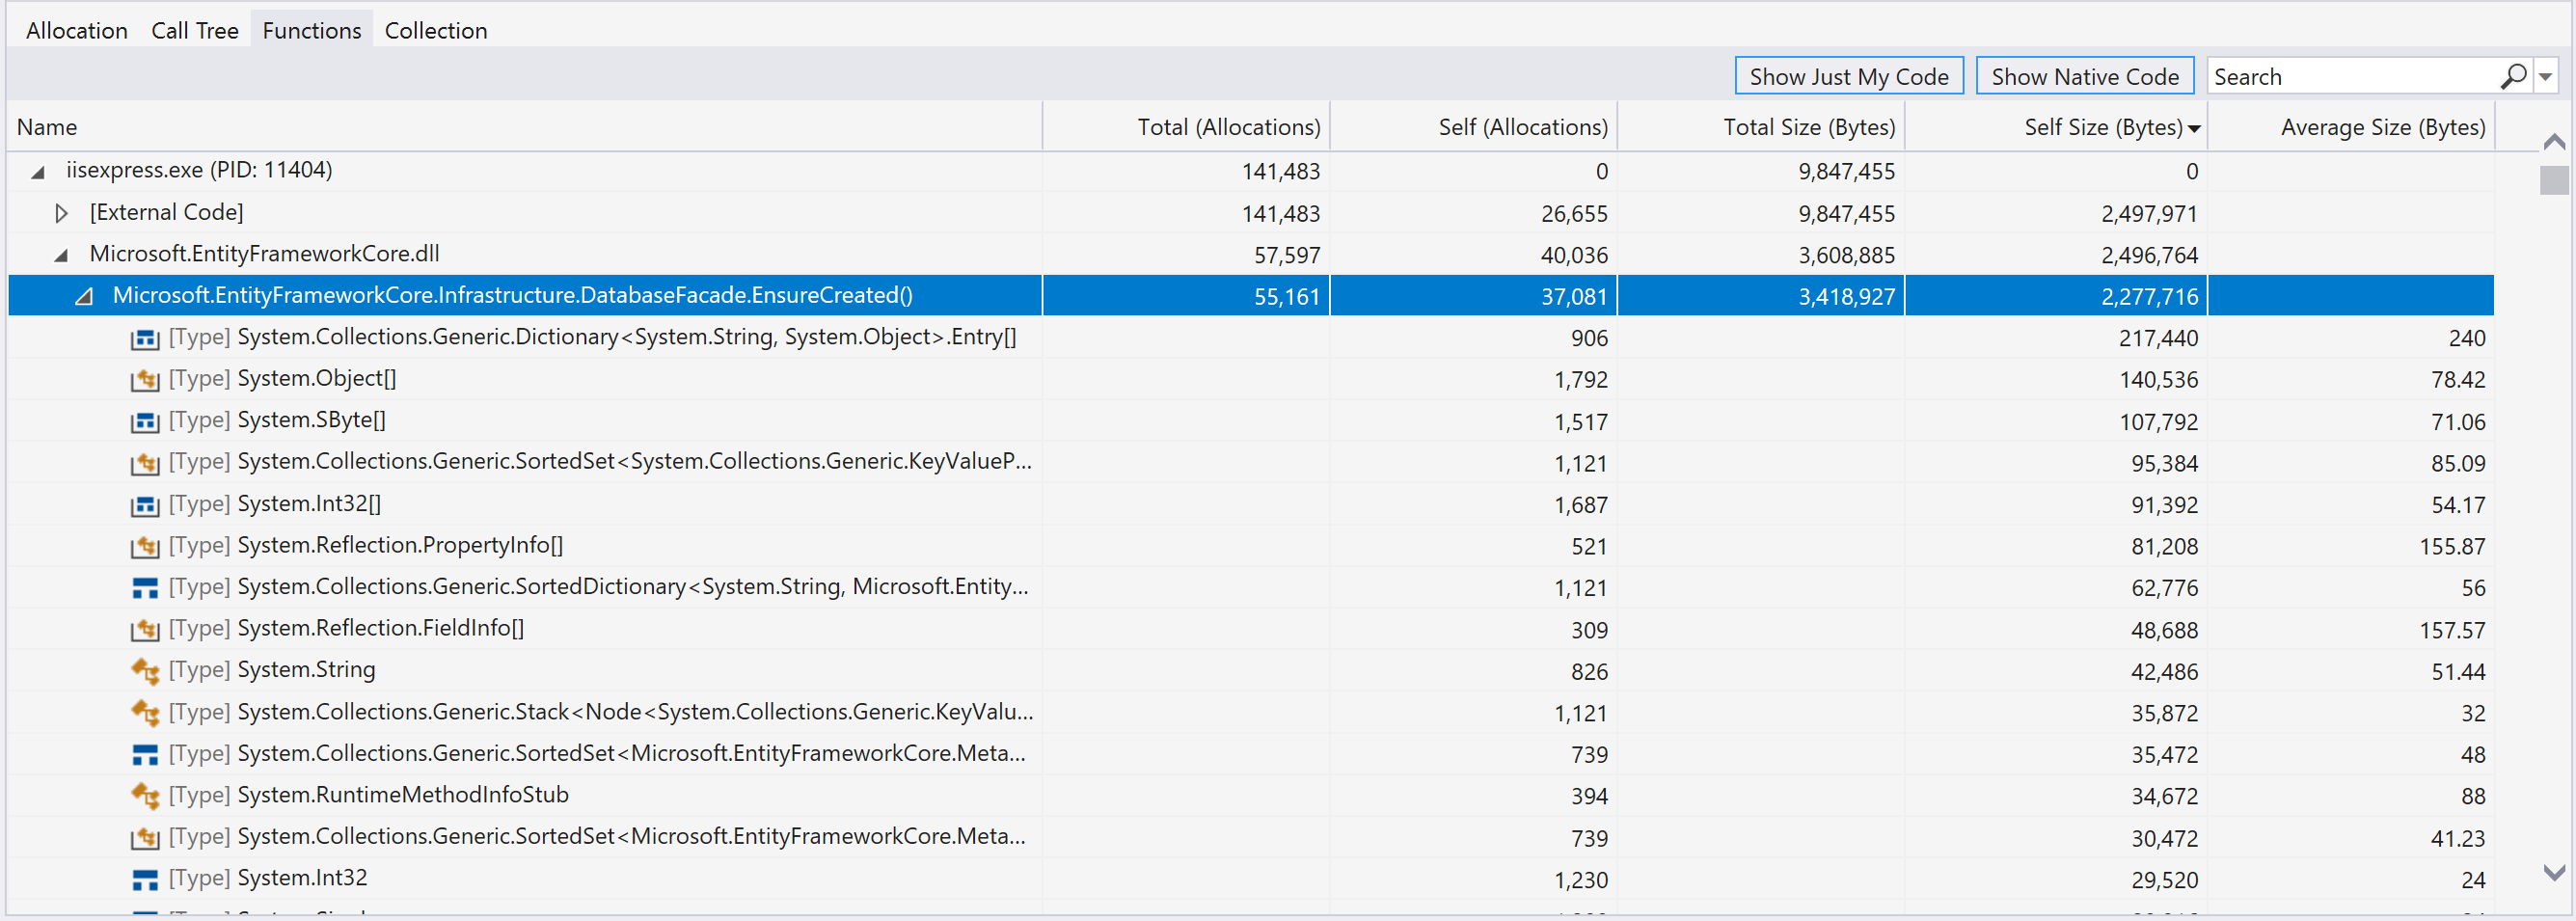
The Functions view shows processes, modules, and functions that are allocating memory.
The Name column shows processes as the highest-level nodes. Underneath processes are modules, and underneath modules are functions.
These columns show the same information as they do in the Allocation and Call tree views:
- Total (Allocations)
- Self (Allocations)
- Total Size (Bytes)
- Self Size (Bytes)
- Average Size (Bytes)
Collection
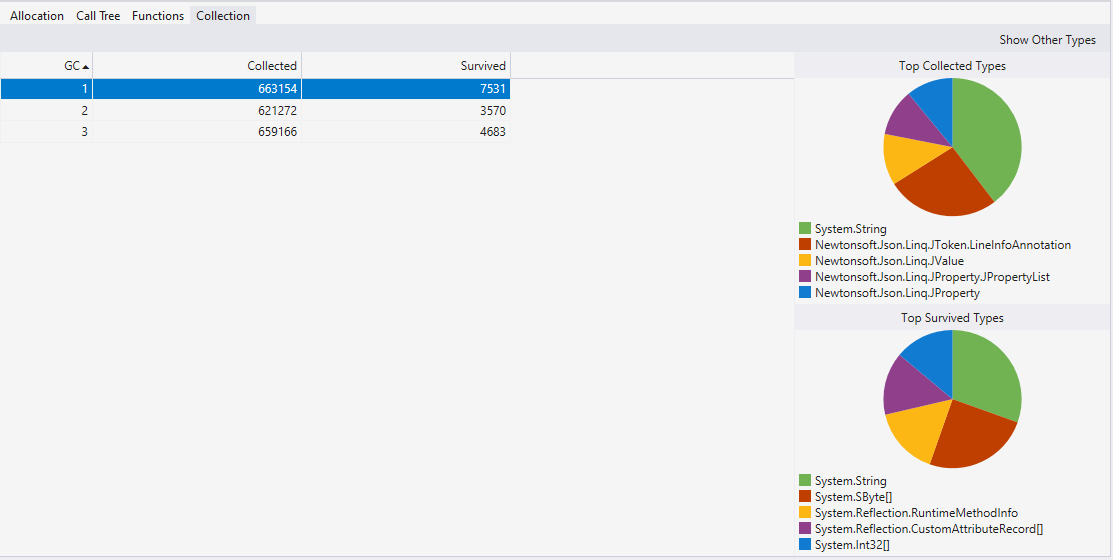
The Collection view shows how many objects were collected or retained during garbage collection. This view also shows pie charts to visualize collected and survived objects by type.
- The Collected column shows the number of objects that the garbage collector collected.
- The Survived column shows the number of objects that survived after the garbage collector was run.
Filtering tools
The Allocations, Call Tree, and Functions views all contain the Show Just My Code and Show Native Code options and a filter box.
- Show Just My Code collapses systems, frameworks, and other nonuser code into [External Code] frames so that you can focus on just your code. For more information, see Debug user code with Just My Code.
- Show Native Code shows native code within the analysis target and can include nonuser code.
- With the filter box, you can filter down the Name or Function name column based on the value you provide. Enter a string value in the box. The table then shows only types that contain that string.