Tutorial: Troubleshoot and fix device issues
In this tutorial, you use the Remote Monitoring solution accelerator to identify and fix issues with your connected IoT devices. You use alerts in the solution accelerator dashboard to identify issues and then run remote jobs to fix those issues.
Contoso is testing a new Prototype device in the field. As a Contoso operator, you notice during testing that the Prototype device is unexpectedly triggering a temperature alert on the dashboard. You must now investigate the behavior of this faulty Prototype device and resolve the issue.
In this tutorial, you:
- Investigate an alert from a device
- Resolve the issue with the device
If you don't have an Azure subscription, create a free account before you begin.
Prerequisites
To follow this tutorial, you need a deployed instance of the Remote Monitoring solution accelerator in your Azure subscription.
Investigate an alert
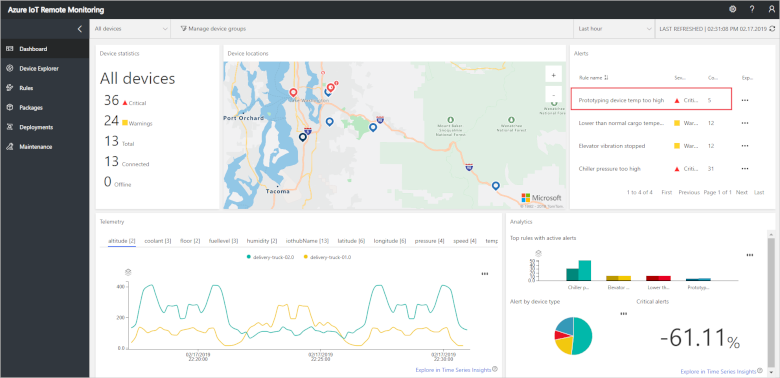
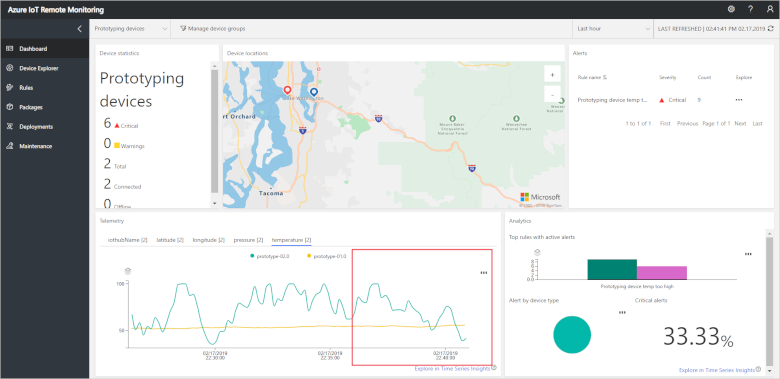
On the Dashboard page you notice there are unexpected temperature alerts coming from the rule associated with the Prototype devices:
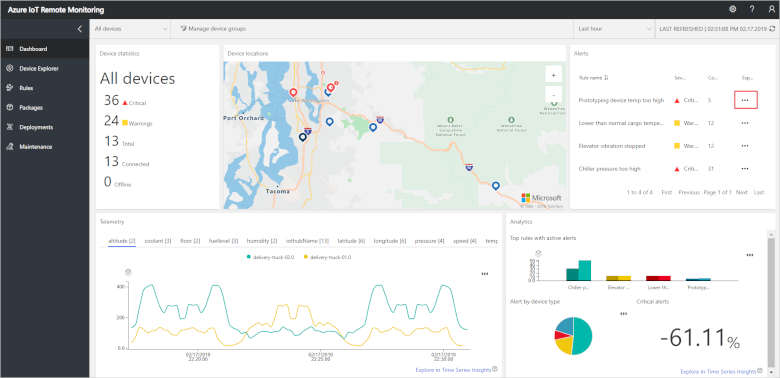
To investigate the issue further, choose the Explore Alert option next to the alert:
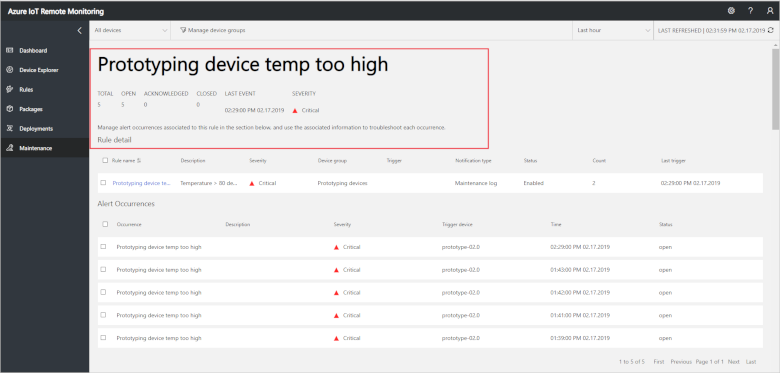
The detail view of the alert shows:
- When the alert was triggered
- Status information about the devices associated with the alert
- Telemetry from the devices associated with the alert
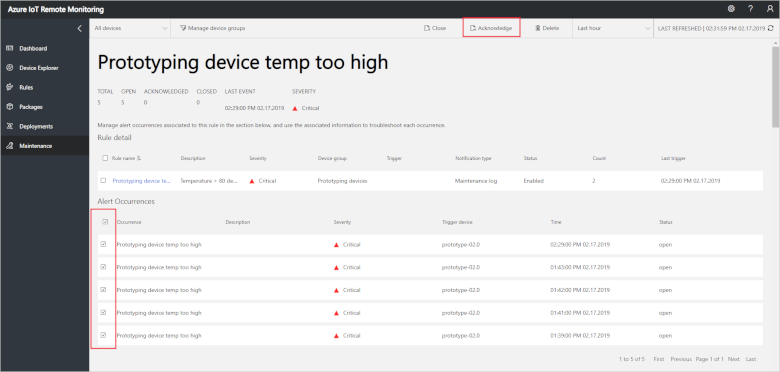
To acknowledge the alert, select all the Alert occurrences and choose Acknowledge. This action lets other operators know that you have seen the alert and are working on it:
When you acknowledge the alert, the status of the occurrence changes to Acknowledged.
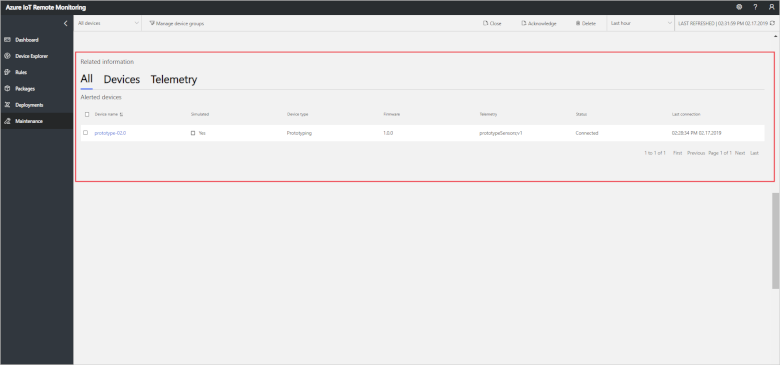
In the list of alerted devices, you can see the Prototype device responsible for firing the temperature alert:
Resolve the issue
To resolve the issue with the Prototype device, you need to call the DecreaseTemperature method on the device.
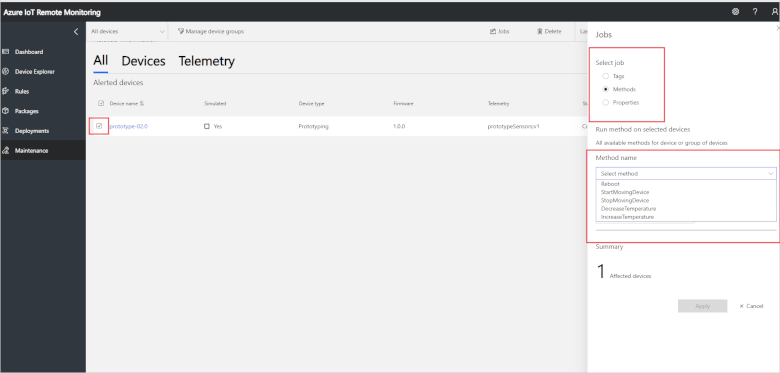
To act on a device, select it in the list of alerted devices and then choose Jobs. The Prototype device model supports six methods:
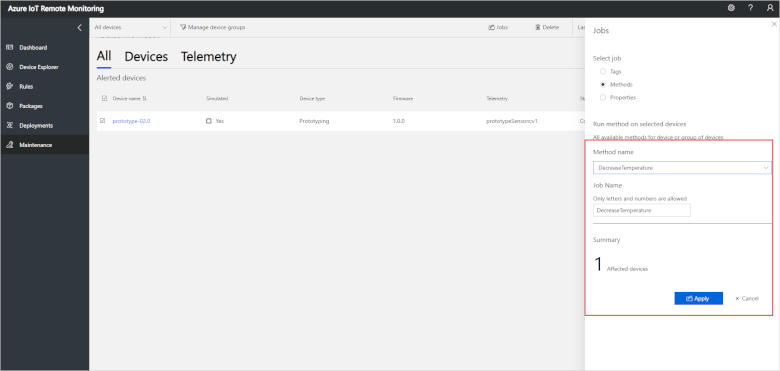
Choose DecreaseTemperature and set the job name to DecreaseTemperature. Then click Apply:
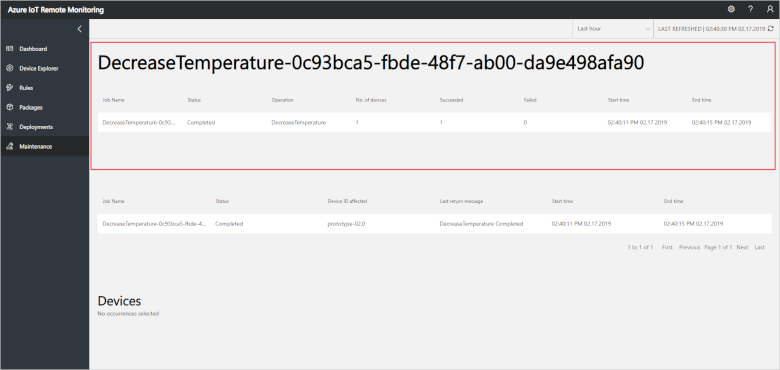
To track the status of the job, click View job status. Use the Jobs view to track all the jobs and method calls in the solution:
You can check that the temperature of the device has fallen by viewing the telemetry on the Dashboard page:
Clean up resources
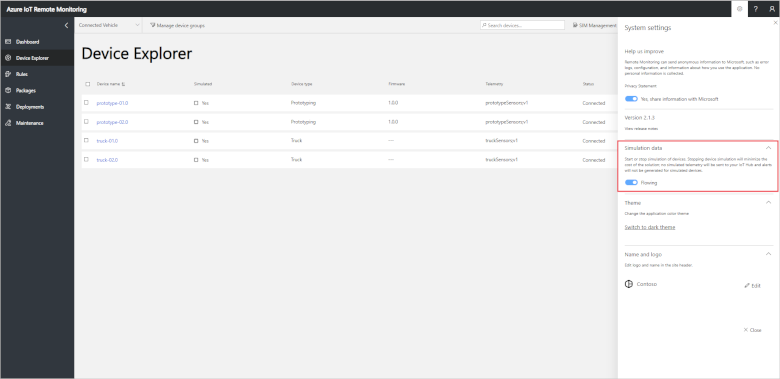
If you plan to move on to the next tutorial, leave the Remote Monitoring solution accelerator deployed. To reduce the costs of running the solution accelerator while you're not using it, you can stop the simulated devices in the settings panel:
You can restart the simulated devices when you're ready to start the next tutorial.
If you no longer need the solution accelerator, delete it.
Next steps
This tutorial showed you how to use alerts to identify issues with your devices and how to act on those devices to resolve the issues. To learn how to connect a real device to your solution accelerator, continue to the how-to articles.
Now you have learned how to manage device issues, the suggested next step is to learn how to Connect your device to the Remote Monitoring solution accelerator.
