Tutorial: Review usage and costs
Cloudyn shows you usage and costs so that you can track trends, detect inefficiencies, and create alerts. All usage and cost data is displayed in Cloudyn dashboards and reports. The examples in this tutorial walk you though reviewing usage and costs using dashboards and reports.
Azure Cost Management offers similar functionality to Cloudyn. Azure Cost Management is a native Azure cost management solution. It helps you analyze costs, create and manage budgets, export data, and review and act on optimization recommendations to save money. For more information, see Azure Cost Management.
In this tutorial, you learn how to:
- Track usage and cost trends
- Detect usage inefficiencies
- Create alerts for unusual spending or overspending
- Export data
If you don't have an Azure subscription, create a free account before you begin.
Note
Cloudyn was deprecated on June 30, 2021 and is no longer available.
Customers can use Azure Cost Management to view, analyze and optimize their cloud costs.
Prerequisites
- You must have an Azure account.
- You must have either a trial registration or paid subscription for Cloudyn.
Open the Cloudyn portal
You review all usage and costs in the Cloudyn portal. Open the Cloudyn portal from the Azure portal or navigate to https://azure.cloudyn.com and sign in.
Track usage and cost trends
You track actual money spent for usage and costs with Over Time reports to identify trends. To start looking at trends, use the Actual Cost Over Time report. On the top left of the portal, click Costs > Cost Analysis > Actual Cost Over Time. When you first open the report, no groups or filters are applied to it.
Here is an example report:
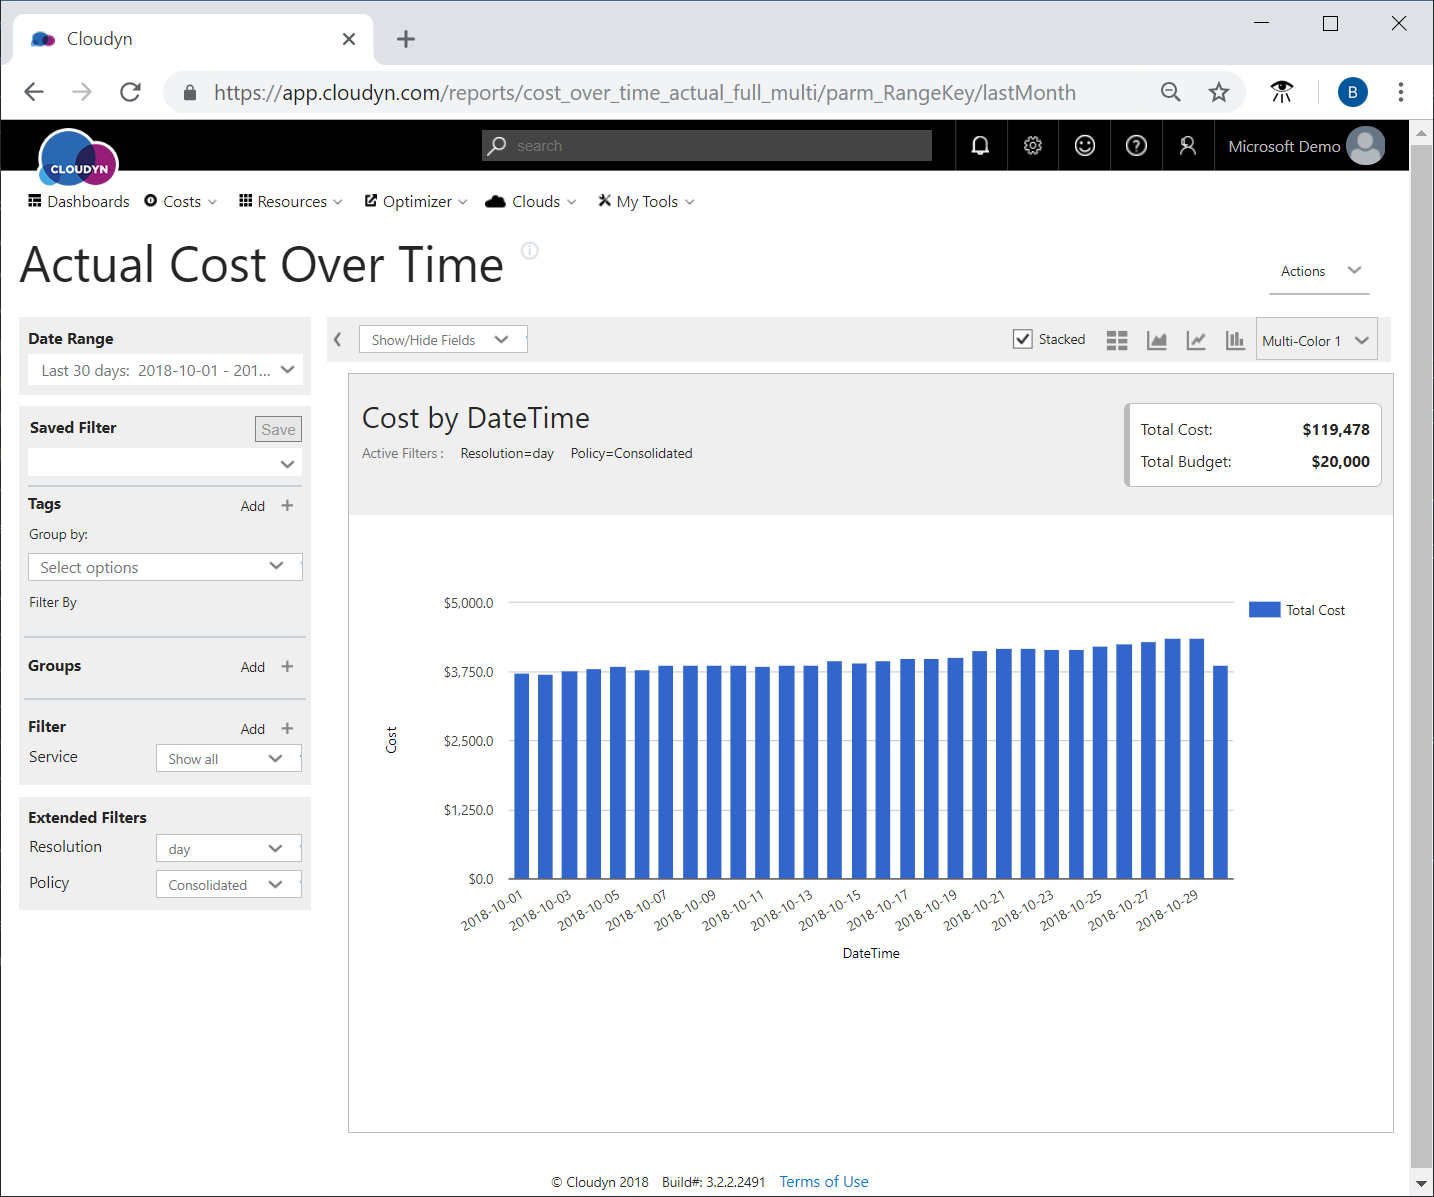
The report shows all spending over the last 30 days. To view only spending for Azure services, apply the Service group and then filter for all Azure services. The following image shows the filtered services.
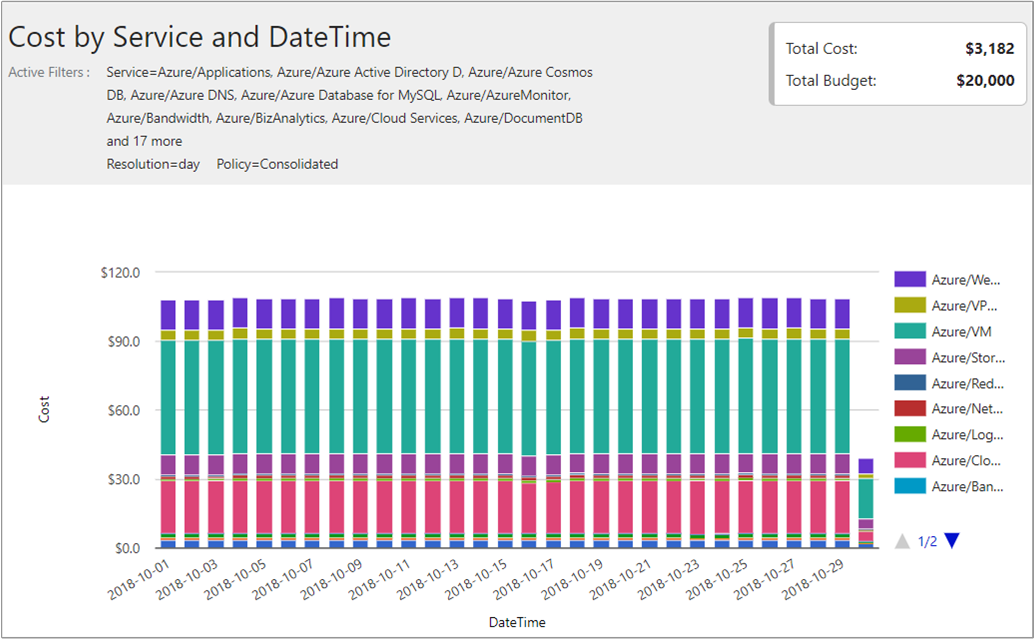
In the preceding example, less money was spent starting on 2018-10-29. But, too many columns can obscure an obvious trend. You can change the report view to a line or area chart to see the data displayed in other views. The following image shows the trend more clearly.
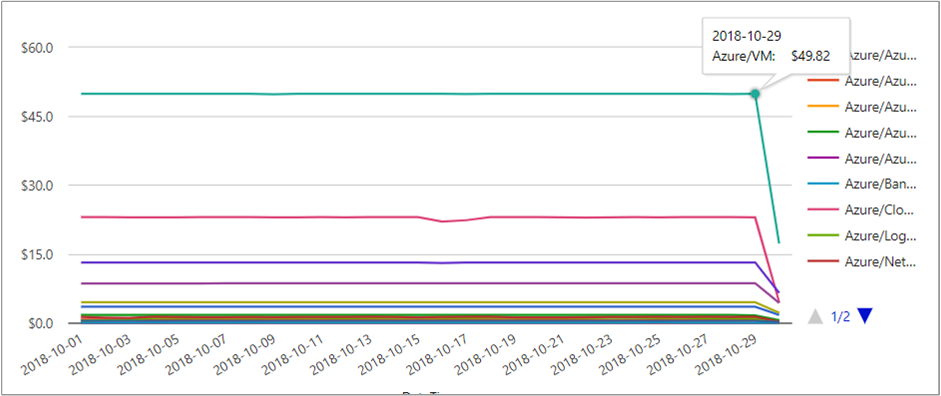
Continuing with the example, you can see that the cost for Azure VM dropped. Costs for other Azure services also started dropping on that day. So, what caused that reduction in spending? In this example, a large work project was completed so consumption of many Azure services also dropped.
To watch a tutorial video about tracking usage and cost trends, see Analyzing your cloud billing data vs. time with Cloudyn.
Detect usage inefficiencies
Optimizer reports improve efficiency, optimize usage, and identify ways to save money spent on your cloud resources. They are especially helpful with cost-effective sizing recommendations intended to help reduce idle or expensive VMs.
A common problem that affects organizations when they initially move resources in to the cloud is their virtualization strategy. They often use an approach similar to the one they used for creating virtual machines for the on-premises virtualization environment. And, they assume that costs are reduced by moving their on-premises VMs to the cloud, as-is. However, that approach is not likely to reduce costs.
The problem is that their existing infrastructure was already paid for. Users could create and keep large VMs running if they liked—idle or not and with little consequence. Moving large or idle VMs to the cloud is likely to increase costs. Cost allocation for resources is important when you enter into agreements with cloud service providers. You must pay for what you commit to whether you use the resource fully or not.
The Cost Effective Sizing Recommendations report identifies potential annual savings by comparing VM instance type capacity to their historical CPU and memory usage data.
On the menu at the top of the portal, click Optimizer > Sizing Optimization > Cost Effective Sizing Recommendations. If useful, apply a filter to reduce results. Here's an example image.
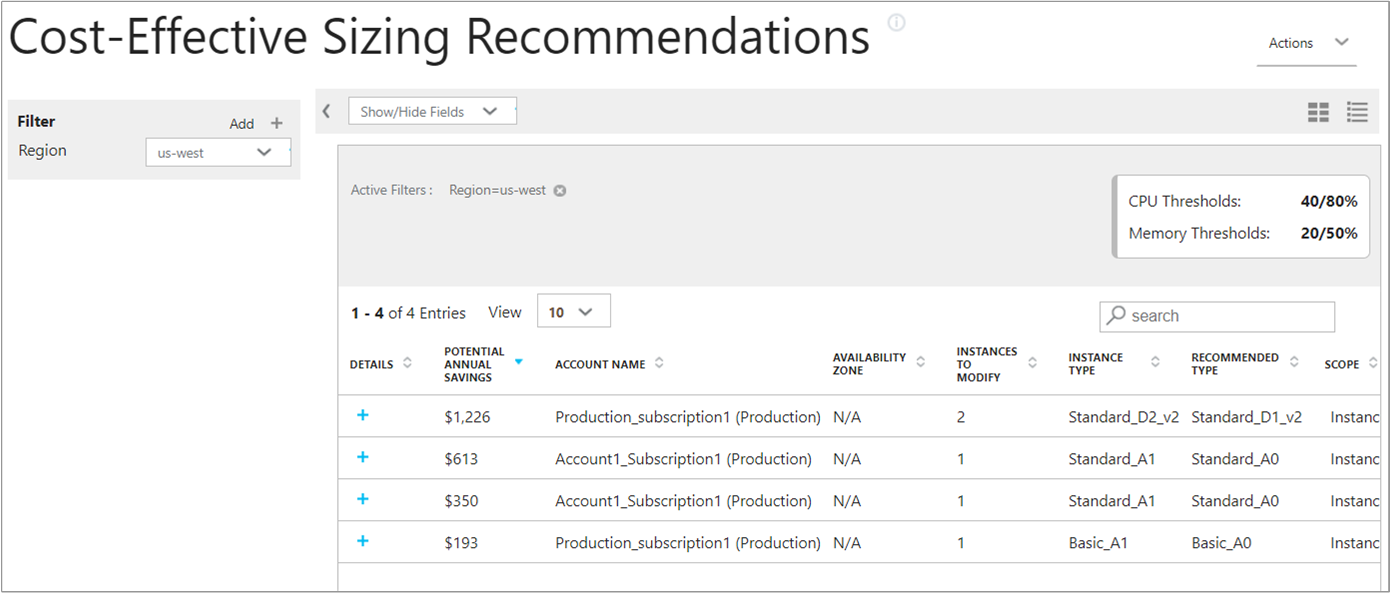
In this example, $2,382 could be saved by following the recommendations to change the VM instance types. Click the plus symbol (+) under Details for the first recommendation. Here are details about the first recommendation.
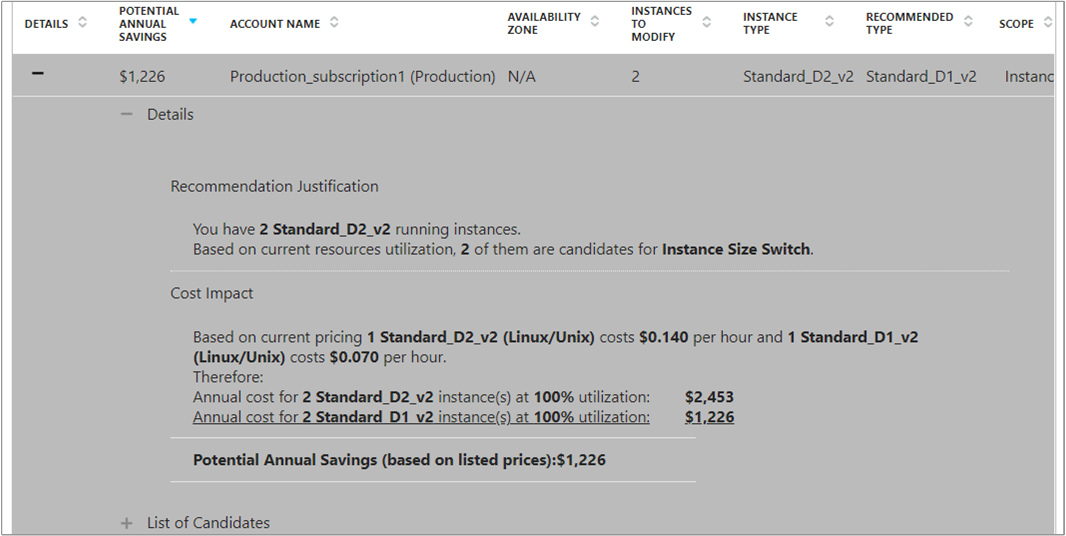
View VM instance IDs by clicking the plus symbol next to List of Candidates.

To watch a tutorial video about detecting usage inefficiencies, see Optimizing VM Size in Cloudyn.
Azure Cost Management also provides cost-saving recommendations for Azure services. For more information, see Tutorial: Optimize costs from recommendations.
Create alerts for unusual spending
Alerts allow you to automatically notify stakeholders of spending anomalies and overspending risks. You can create alerts using reports that support alerts based on budget and cost thresholds.
This example uses the Actual Cost Over Time report to send a notification when your spending on an Azure VM nears your total budget. In this scenario, you have a total budget of $20,000 and you want to receive a notification when costs are approaching half of your budget, $9,000, and an additional alert when costs reach $10,000.
- From the menu at the top of the Cloudyn portal, select Costs > Cost Analysis > Actual Cost Over Time.
- Set Groups to Service and set Filter on the service to Azure/VM.
- In the top right of the report, select Actions and then select Schedule report.
- To send yourself an email of the report at scheduled interval, select the Scheduling tab in the Save or Schedule this report dialog. Be sure to select Send via email. Any tags, grouping, and filtering you use are included in the emailed report.
- Select the Threshold tab and then select Actual Cost vs. Threshold.
- In the Red alert threshold box enter 10000.
- In the Yellow alert threshold box enter 9000.
- In the Number of consecutive alerts box, enter the number of consecutive alerts to receive. When you receive the total number of alerts that you specified, no additional alerts are sent.
- Select Save.
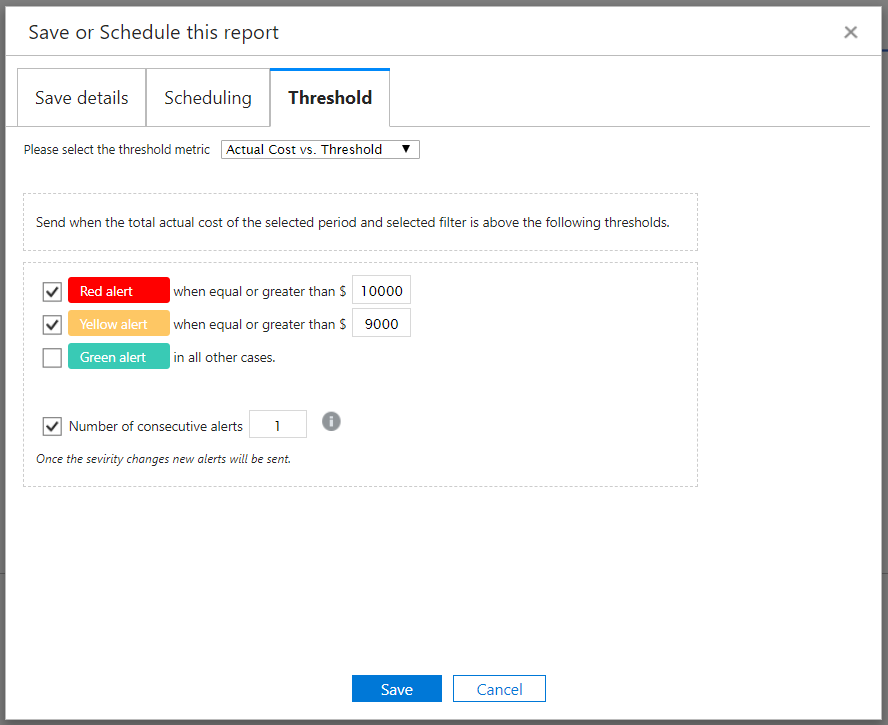
You can also choose the Cost Percentage vs. Budget threshold metric to create alerts. This allows you to specify the thresholds as percentages of your budget instead of currency values.
Export data
Similar to way you create alerts for reports, you can also export data from any report. For example, you might want to export a list of Cloudyn accounts or other user data. To export any report, open the report and then in the top right of the report, click Actions. Some of the actions you might want to take are Export all report data so that you can download or print the information. Or, you can select Schedule report to schedule the report to get sent as an email.
Next steps
In this tutorial, you learned how to:
- Track usage and cost trends
- Detect usage inefficiencies
- Create alerts for unusual spending or overspending
- Export data
Advance to the next tutorial to learn how to forecast spending using historical data.