Best practices for creating a dimensional model using dataflows
Designing a dimensional model is one of the most common tasks you can do with a dataflow. This article highlights some of the best practices for creating a dimensional model using a dataflow.
Staging dataflows
One of the key points in any data integration system is to reduce the number of reads from the source operational system. In the traditional data integration architecture, this reduction is done by creating a new database called a staging database. The purpose of the staging database is to load data as-is from the data source into the staging database on a regular schedule.
The rest of the data integration will then use the staging database as the source for further transformation and convert it to the dimensional model structure.
We recommend that you follow the same approach using dataflows. Create a set of dataflows that are responsible for just loading data as-is from the source system (and only for the tables you need). The result is then stored in the storage structure of the dataflow (either Azure Data Lake Storage or Dataverse). This change ensures that the read operation from the source system is minimal.
Next, you can create other dataflows that source their data from staging dataflows. The benefits of this approach include:
- Reducing the number of read operations from the source system, and reducing the load on the source system as a result.
- Reducing the load on data gateways if an on-premises data source is used.
- Having an intermediate copy of the data for reconciliation purposes, in case the source system data changes.
- Making the transformation dataflows source-independent.
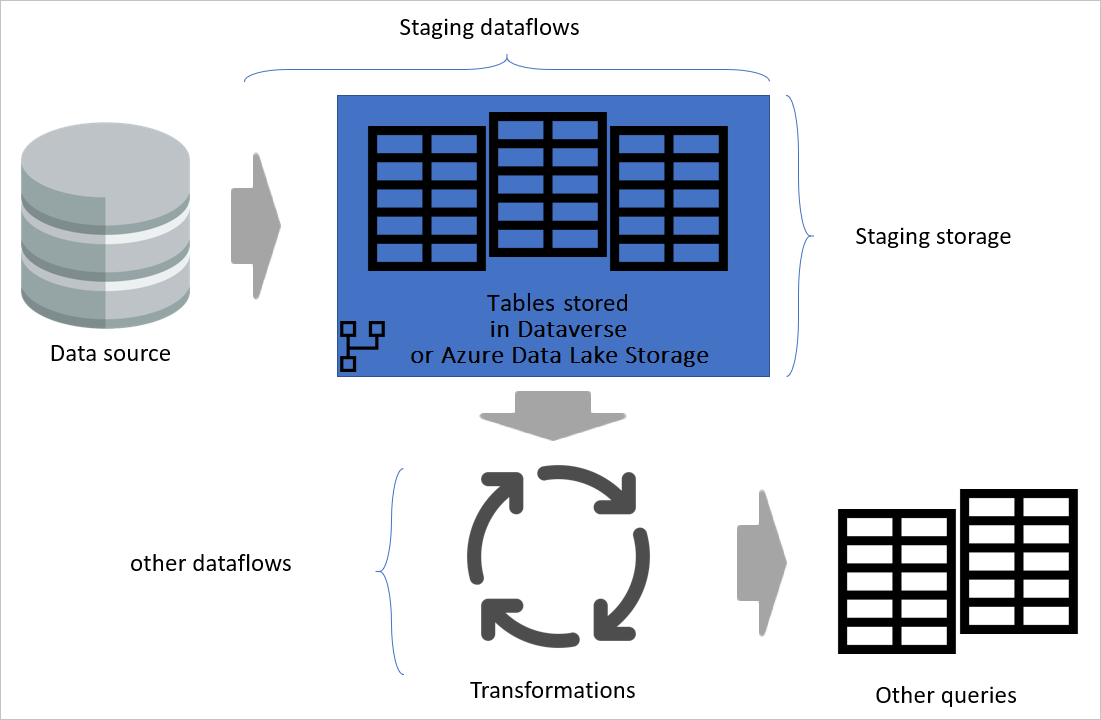
Image emphasizing staging dataflows and staging storage, and showing the data being accessed from the data source by the staging dataflow, and tables being stored in either Cadavers or Azure Data Lake Storage. The tables are then shown being transformed along with other dataflows, which are then sent out as queries.
Transformation dataflows
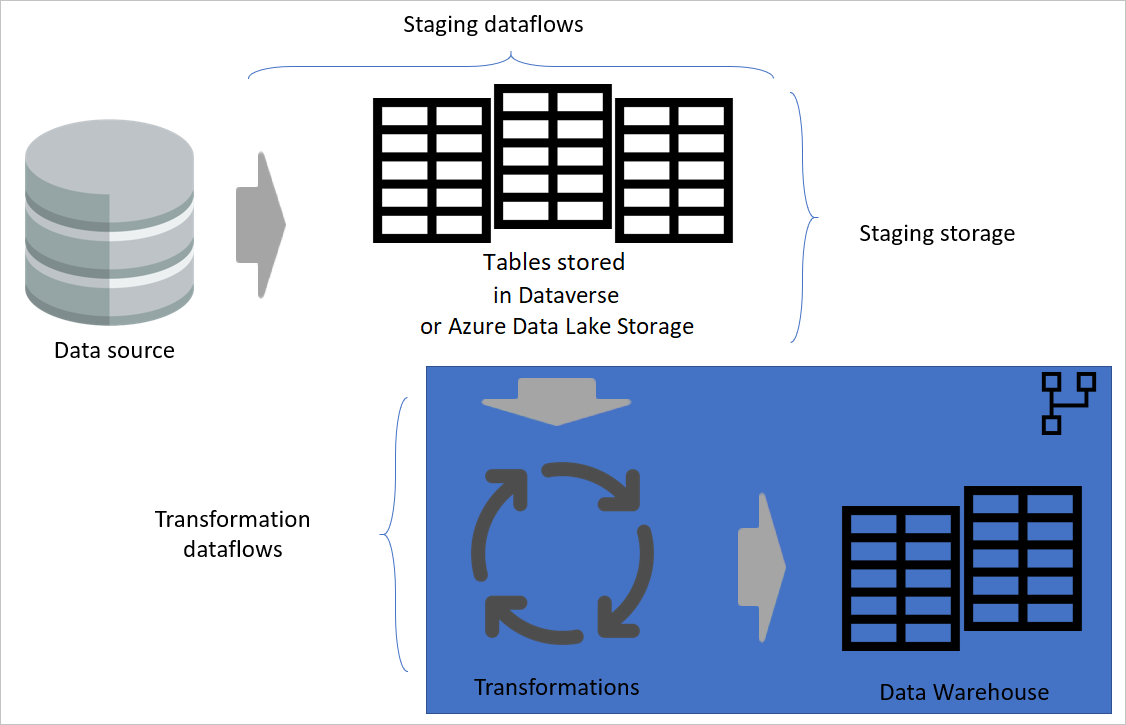
When you've separated your transformation dataflows from the staging dataflows, the transformation will be independent of the source. This separation helps if you're migrating the source system to a new system. All you need to do in that case is to change the staging dataflows. The transformation dataflows are likely to work without any problem because they're sourced only from the staging dataflows.
This separation also helps in case the source system connection is slow. The transformation dataflow won't need to wait for a long time to get records coming through a slow connection from the source system. The staging dataflow has already done that part, and the data will be ready for the transformation layer.
Layered Architecture
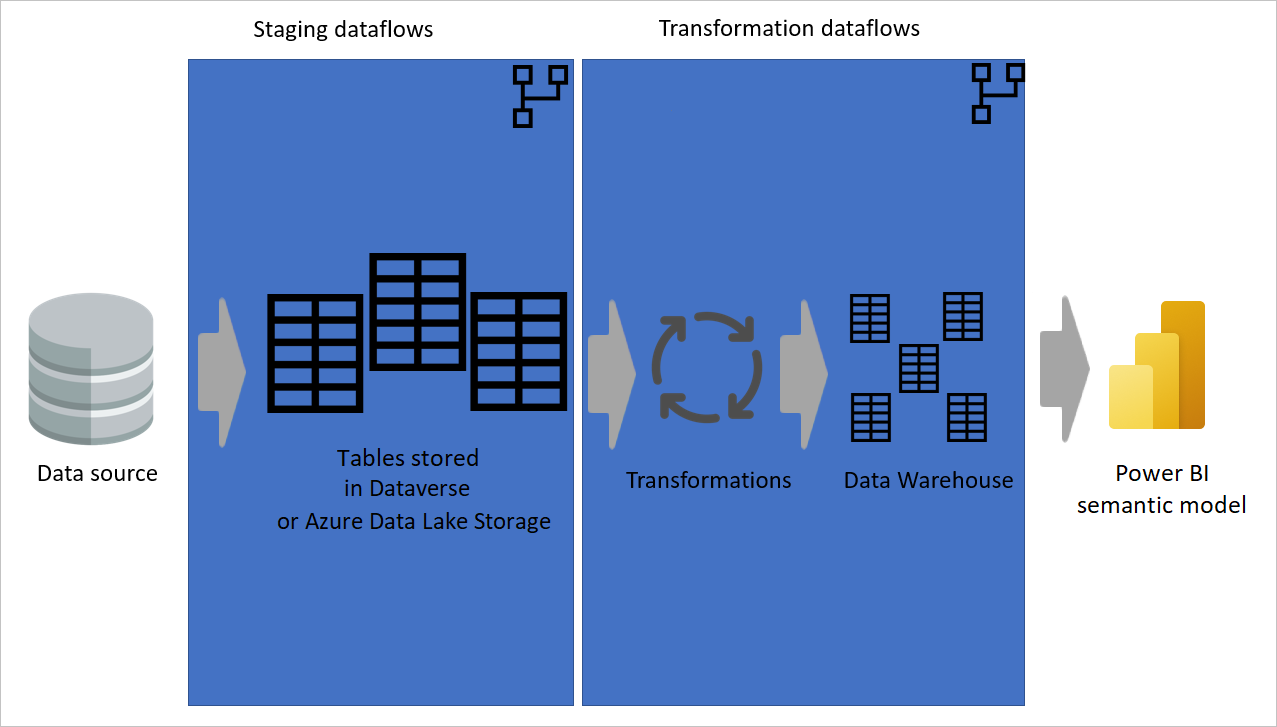
A layered architecture is an architecture in which you perform actions in separate layers. The staging and transformation dataflows can be two layers of a multi-layered dataflow architecture. Trying to do actions in layers ensures the minimum maintenance required. When you want to change something, you just need to change it in the layer in which it's located. The other layers should all continue to work fine.
The following image shows a multi-layered architecture for dataflows in which their tables are then used in Power BI semantic models.
Use a computed table as much as possible
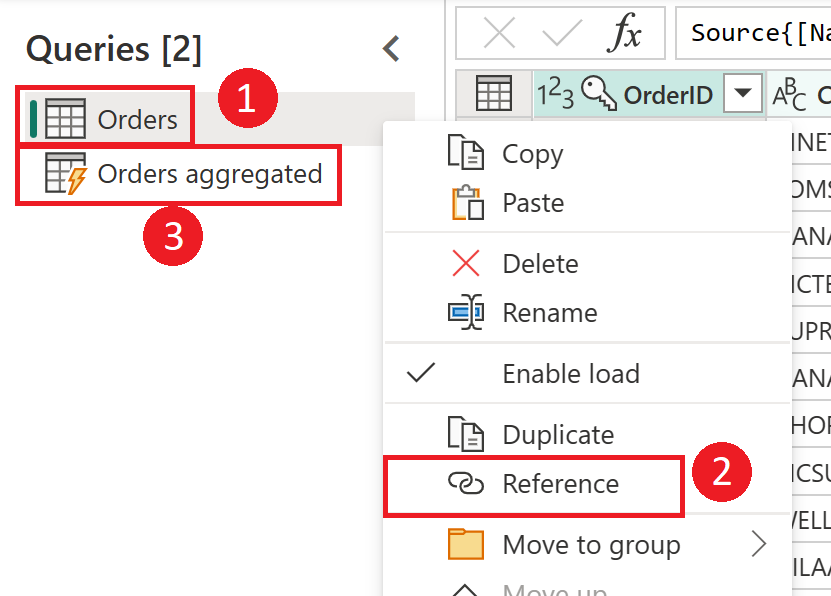
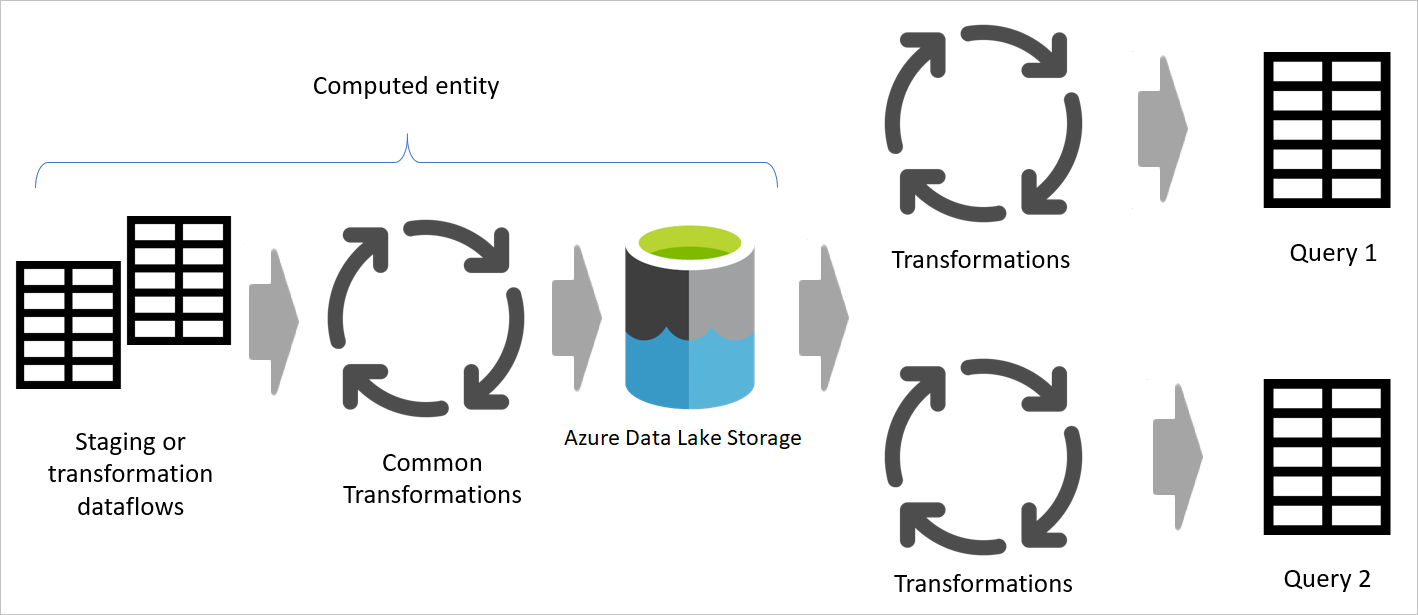
When you use the result of a dataflow in another dataflow, you're using the concept of the computed table, which means getting data from an "already-processed-and-stored" table. The same thing can happen inside a dataflow. When you reference a table from another table, you can use the computed table. This is helpful when you have a set of transformations that need to be done in multiple tables, which are called common transformations.
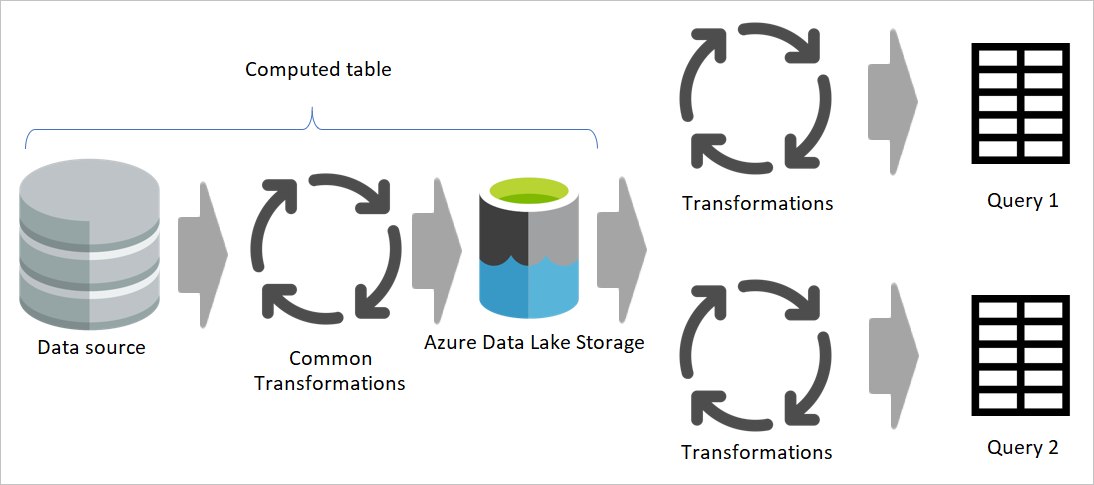
In the previous image, the computed table gets the data directly from the source. However, in the architecture of staging and transformation dataflows, it's likely that the computed tables are sourced from the staging dataflows.
Build a star schema
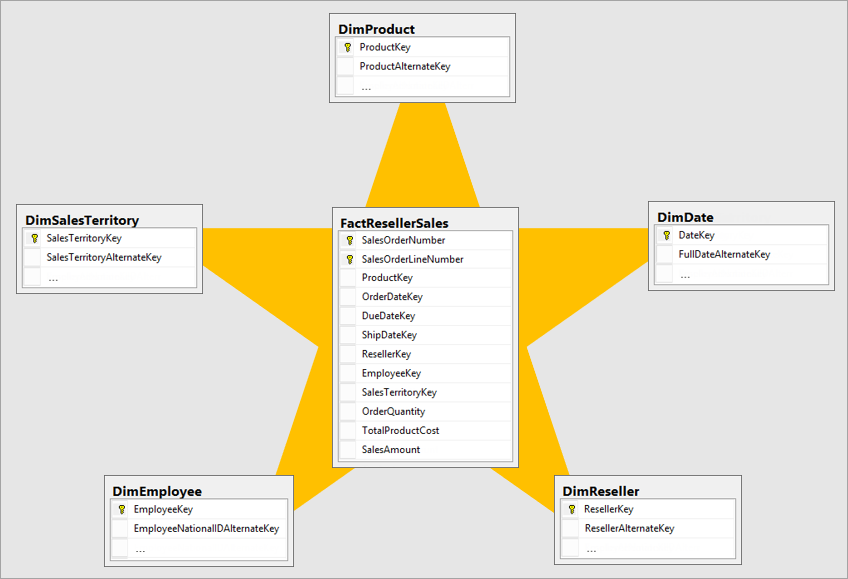
The best dimensional model is a star schema model that has dimensions and fact tables designed in a way to minimize the amount of time to query the data from the model and also makes it easy to understand for the data visualizer.
It isn't ideal to bring data in the same layout of the operational system into a BI system. The data tables should be remodeled. Some of the tables should take the form of a dimension table, which keeps the descriptive information. Some of the tables should take the form of a fact table, to keep the aggregatable data. The best layout for fact tables and dimension tables to form is a star schema. More information: Understand star schema and the importance for Power BI
Use a unique key value for dimensions
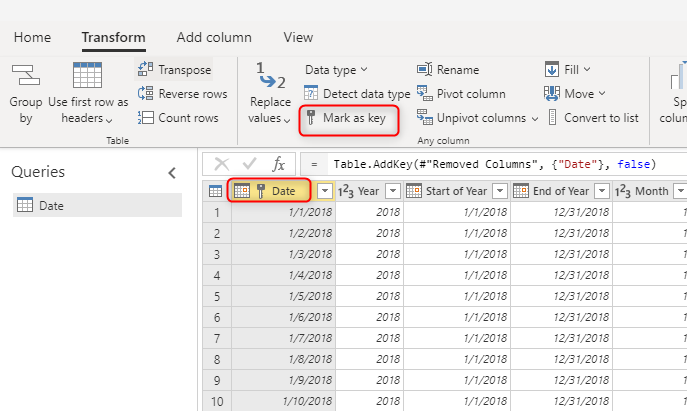
When building dimension tables, make sure you have a key for each one. This key ensures that there are no many-to-many (or in other words, "weak") relationships among dimensions. You can create the key by applying some transformation to make sure a column or a combination of columns is returning unique rows in the dimension. Then that combination of columns can be marked as a key in the table in the dataflow.
Do an incremental refresh for large fact tables
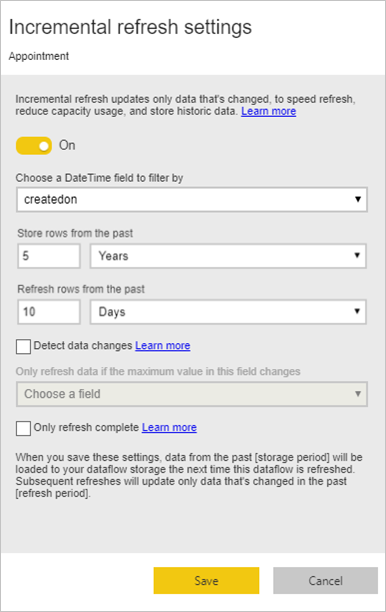
Fact tables are always the largest tables in the dimensional model. We recommend that you reduce the number of rows transferred for these tables. If you have a very large fact table, ensure that you use incremental refresh for that table. An incremental refresh can be done in the Power BI semantic model, and also the dataflow tables.
You can use incremental refresh to refresh only part of the data, the part that has changed. There are multiple options to choose which part of the data to be refreshed and which part to be persisted. More information: Using incremental refresh with Power BI dataflows
Referencing to create dimensions and fact tables
In the source system, you often have a table that you use for generating both fact and dimension tables in the data warehouse. These tables are good candidates for computed tables and also intermediate dataflows. The common part of the process—such as data cleaning, and removing extra rows and columns—can be done once. By using a reference from the output of those actions, you can produce the dimension and fact tables. This approach will use the computed table for the common transformations.
