Understanding visual calculations
Important
This content is archived and is not being updated. For the latest documentation, go to What is Power BI?. For the latest release plans, go to Dynamics 365, Power Platform, and Cloud for Industry release plans.
| Enabled for | Public preview | General availability |
|---|---|---|
| Admins, makers, marketers, or analysts, automatically |  Mar 13, 2024
 |
- |
Business value
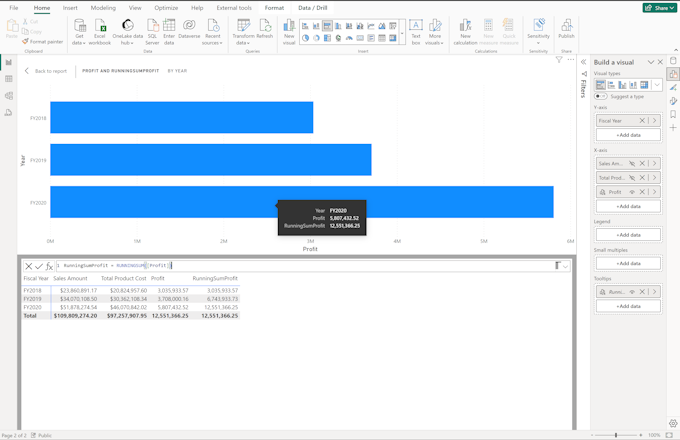
Visual calculations allow users to create new calculations on a visual, using a simple interface based on a table of data, supported by powerful, easy to use formulas and Excel-like capabilities.
Feature details
Visual calculations allow users to build new calculations from any visual inside Power BI using an Excel grid-like interface. They allow users to use a grid to express their new formula and allow reference to other cells in the grid in order to derive a calculation. Most users today struggle to write and create DAX calculations of this nature, for example, running totals. In Excel, a user would simply reference the previous value from the cell. With these new visual calculation abilities, users would be able to leverage previous values, easily allowing them to build very complex formulas, very quickly.
