Manage and monitor capacity (preview)
[This topic is prerelease documentation and is subject to change.]
The Power Pages capacity management experience in the Power Platform admin center allows administrators to manage Power Pages capacity and monitor capacity consumption. This experience also provides an overview of the different licensing models in use.
Important
- This feature is a preview feature.
- Preview features aren’t meant for production use and may have restricted functionality. These features are available before an official release so that customers can get early access and provide feedback.
The capacity management features allow administrators to assign prepurchased capacity between the environments in the tenant based on the expected usage of the websites in that environment. The capacity management panel provides daily consumption data at the environment level for up to three full months, which helps determine the required capacity for the environments.
The consumption monitoring views of the capacity management experience provide daily data for the month to date, the past two full months, and monthly data for the past 12 months to help with the license budgeting and planning.
The licensing summary view includes information about production websites using legacy licensing models as well, which helps with planning the licensing model migration from legacy to current licensing models.
The Power Pages capacity management experience allows pivoting between the two supported capacity categories: authenticated MAU (monthly active users) and anonymous MAU.
More information: Power Platform licensing FAQs
These views and features can be used in addition to the website capacity consumption reports; however, for monitoring the consumption of current capacity (authenticated MAU and anonymous MAU), it's recommended to use these new views.
Licensing summary view
The licensing summary view is located under Billing (preview) > Licenses (preview). Once Power Pages is selected from the product selector, the tenant-level licensing summary view displays.
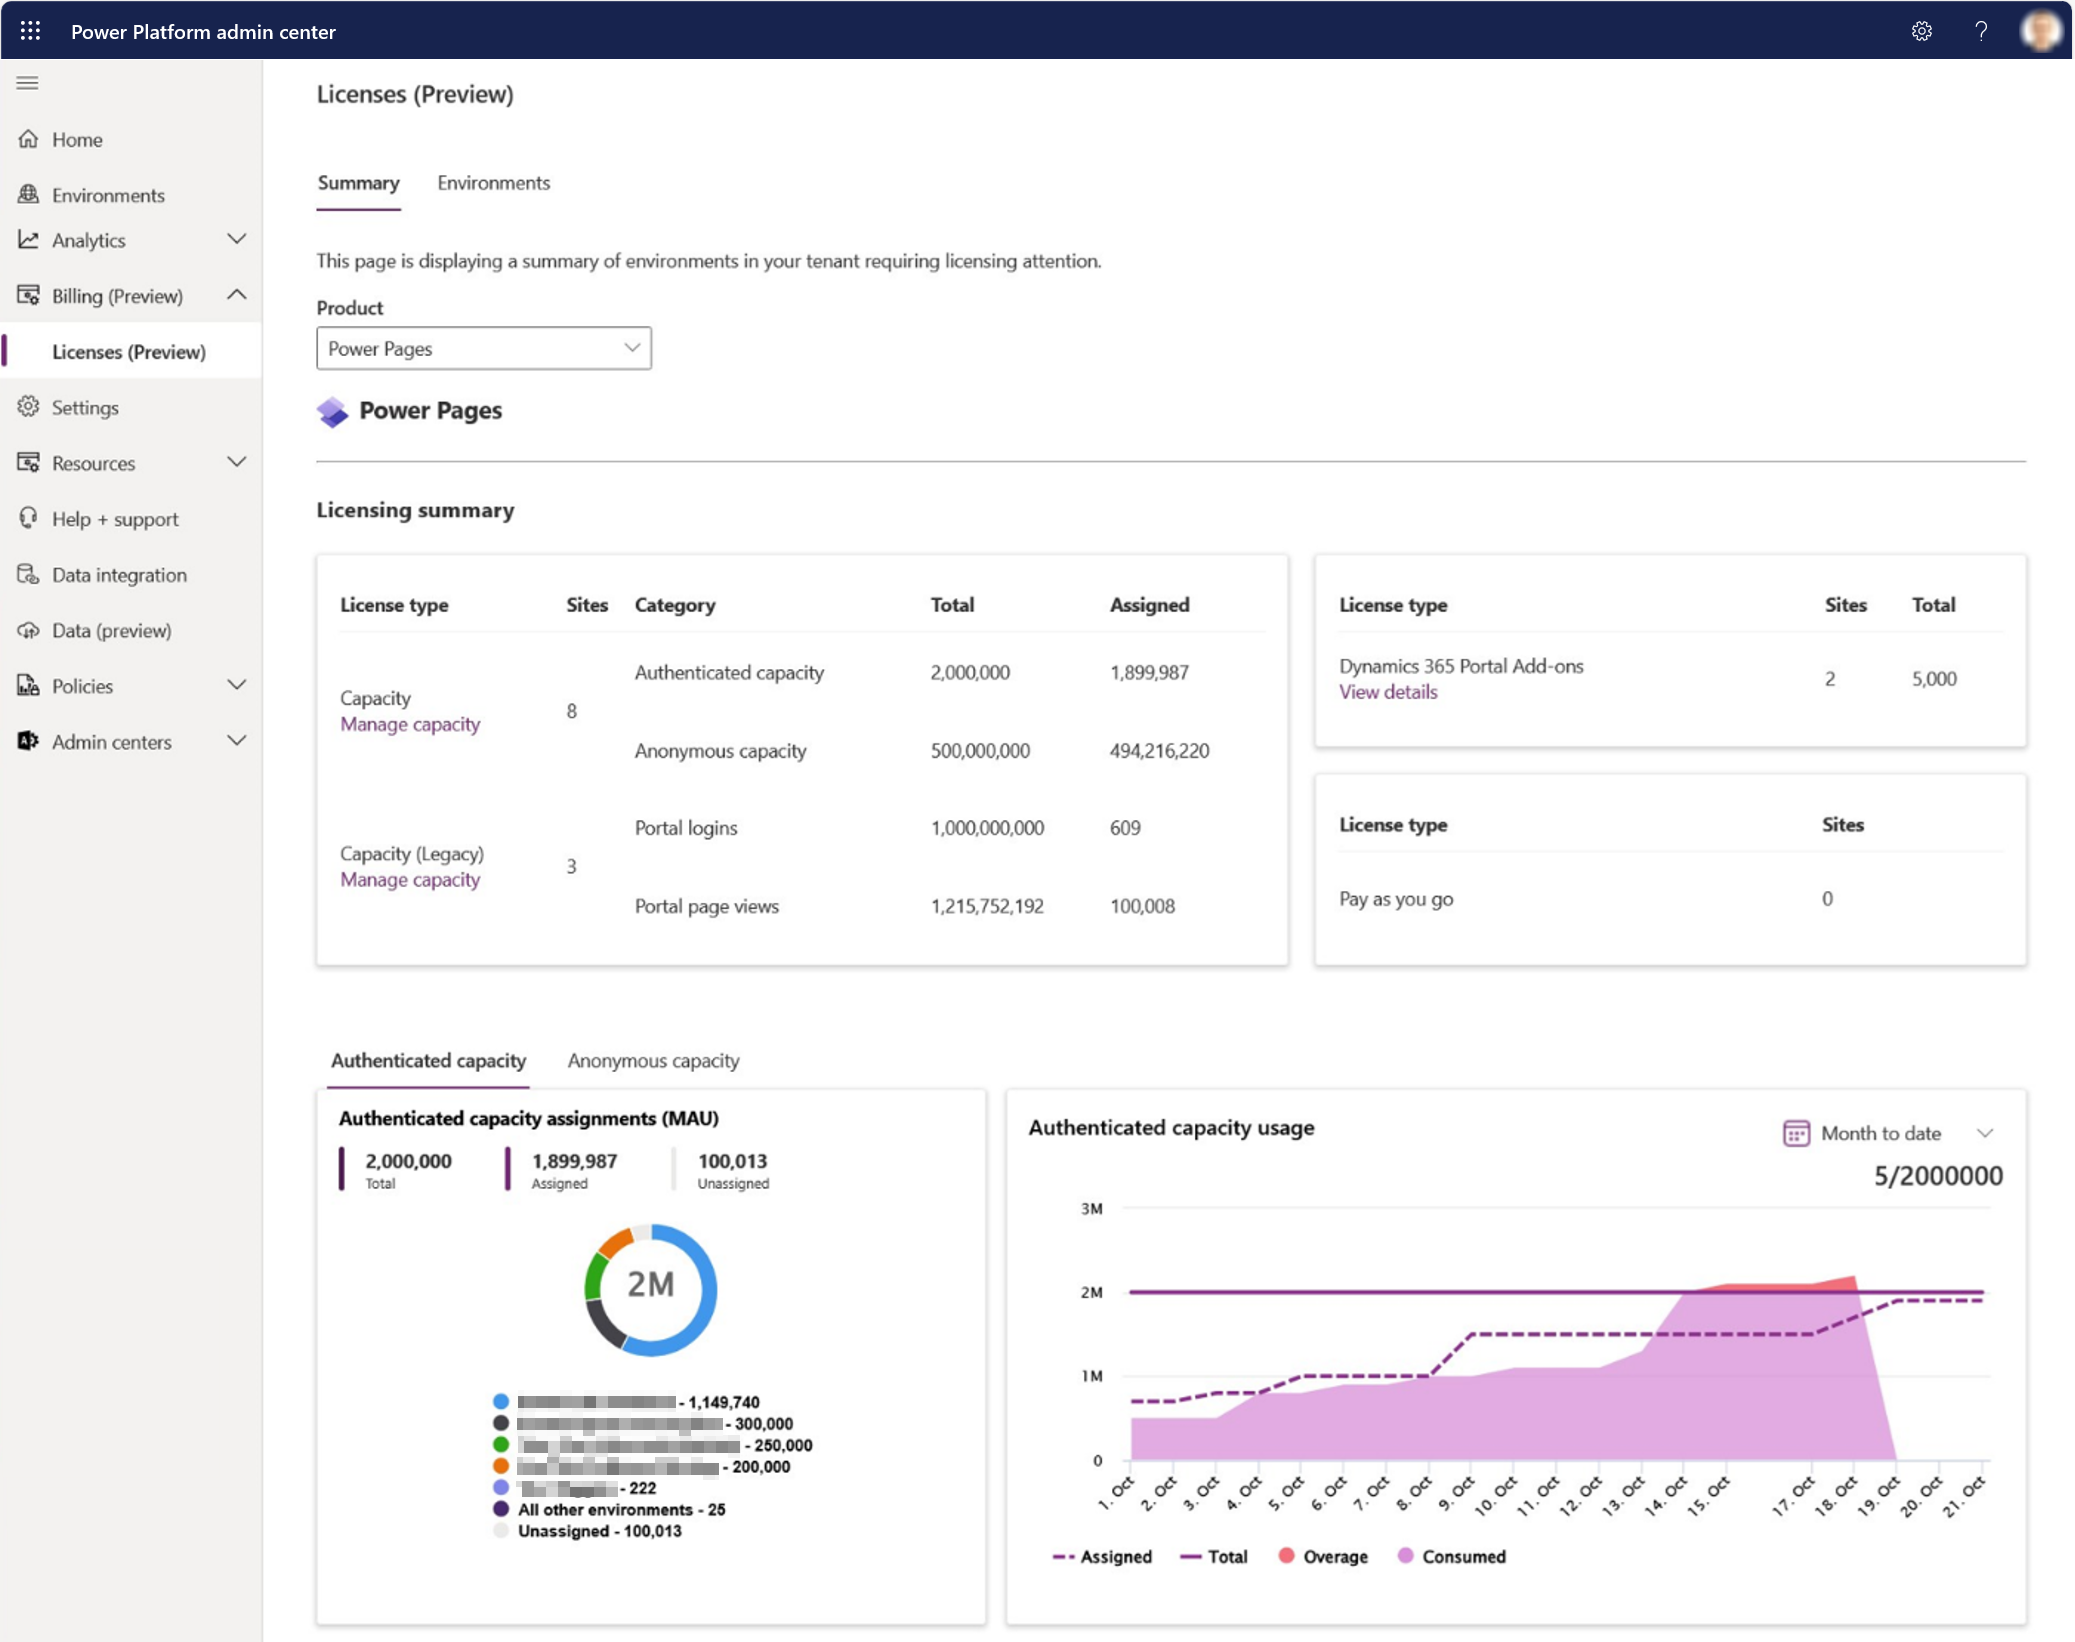
License type cards
License type cards are shown at the top of the view. The cards provide information about different license types in use in production and relevant metrics such as Total (capacity available), and Assigned (capacity assigned).
For capacity-based licensing models, the card has a link to either the capacity management experience or the legacy capacity management panel, depending on the license type.
For Dynamics 365 Portal Add-ons (legacy license type), View details shows the production websites that are using the add-ons licensing model. View details for a pay-as-you-go license type shows a list of websites in production using a pay-as-you-go license model.
The license cards have information about the legacy licensing models to help administrators with licensing model migration planning. The rest of the views and features only support the current capacity-based licensing model (Authenticated MAU and Anonymous MAU).
More information: Power Platform licensing FAQs
Capacity category pivot
The capacity category pivot allows switching between authenticated capacity and anonymous capacity. This tab controls both the pie chart and graph.
Assignments pie chart
The assignments pie chart always shows the current data for total available prepurchased capacity, the amount of assigned capacity and the amount of unassigned capacity. Any changes the administrator makes are reflected in this control. The pie chart represents the top environments in the tenant by assigned capacity, including all other environments and unassigned capacity as well. The legend below the pie shows the top five environment names. Administrators can use this view to confirm when the new capacity is available after procurement, if there's capacity available to be assigned to an environment nearing its assigned capacity, and if any of the top environments have unused capacity that could be reassigned.
Consumption history graph
The consumption graph visualizes the data for assigned capacity, total available capacity, consumed capacity, and overage at the tenant level, if any. Administrators can use the consumption graph to determine when new capacity needs to be procured to cover the growth.
- Time ranges available are month to date, daily data for the past two full months, and monthly data for the past 12 months.
- Licensing capacity consumption resets in the beginning of each month and grows as unique users access the websites and licensing capacity is consumed.
- Daily views are cumulative.
There's a delay of up to 24 hours for the data shown in the graph.
Migration view
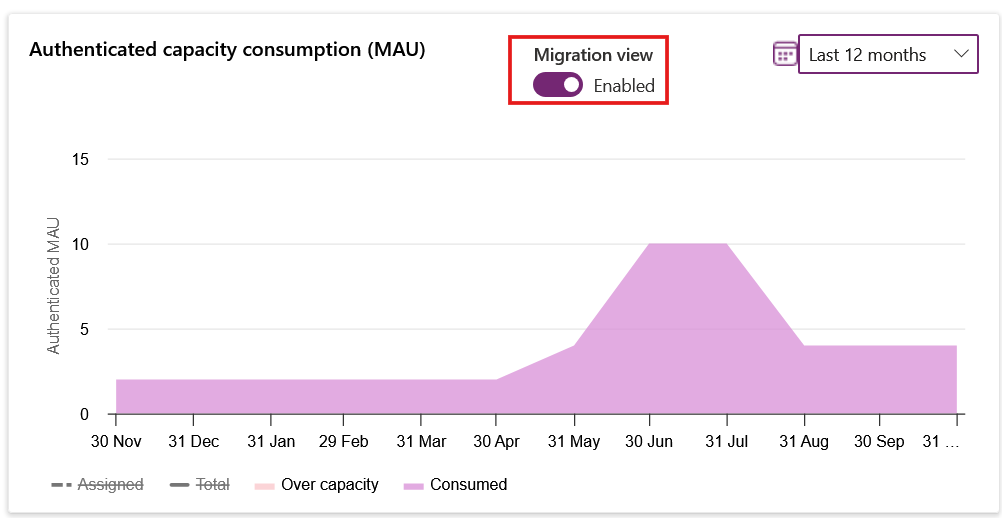
In the consumption history graph, there's a toggle control called Migration view. When you enable it, the graph displays the total consumption in the tenant, including sites using legacy license models, which is converted to authenticated and anonymous capacity. This information is useful for planning the migration from legacy licensing models to the current capacity model. The migration view supports all views: month-to-date, past two full months, and last 12 months.
Notification cards
Notification cards appear above the licensing summary view when something requires attention.
Capacity management
To manage prepurchased authenticated and anonymous capacity, administrators should select Manage capacity in the licensing summary below Capacity. The capacity management pane opens on the right side of the view.
The capacity management pane allows administrators to view and manage the environments that are either already using this licensing type, and environments without any kind of license or capacity assigned.
At the top of the capacity management pane, administrators can see the total capacity available for the tenant, assigned capacity, and how much of the capacity is unassigned and available to be assigned. The capacity category (authenticated, anonymous) can be controlled with the tab control on the top.
Select an environment from the list to display details of the environment on the bottom of the pane, such as region and the type of the environment. Capacity assignment for the selected environment can be changed by entering the new amount in the Assigned units textbox and selecting Apply.
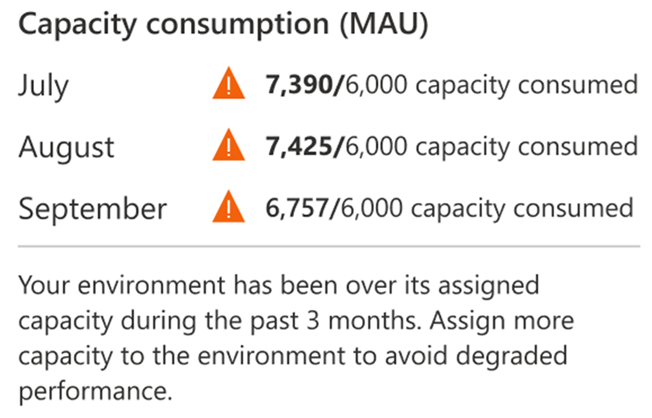
If the environment is nearing or over its assigned capacity, an icon is shown and the status field indicates this status. Hover over the icon to see the consumption history from the past three months to the amount of capacity required.
Legacy capacity and license management
Legacy capacity refers to the previous Power Pages capacity-based licensing model using portal logins and portal page views as metrics. Legacy license refers to Dynamics 365 Portal add-ons. Legacy capacity or legacy licenses are no longer available for purchase and new versions are available.
More information: Power Pages licensing
The licensing summary view also shows any legacy capacity in use, Dynamics 365 Portal add-ons, and pay-as-you-go sites. This information can be used for license model migration planning.
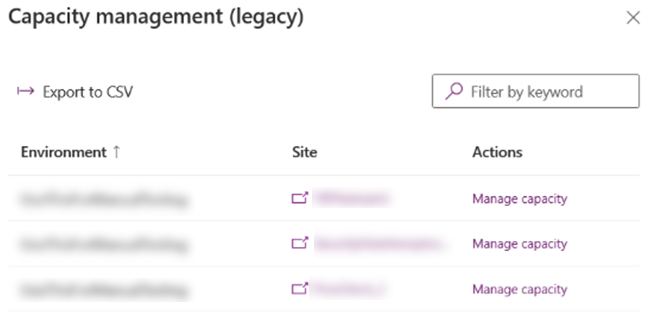
For legacy capacity, Manage capacity, displayed under the license type, opens the legacy capacity management view on the right side of the screen. This view lists the environments and sites in this licensing model and the Manage capacity action link next to the environment, and the site opens the Manage add-ons view with the environment preselected. The Manage add-ons view allows changes to be made to the legacy capacity (page views, logins).
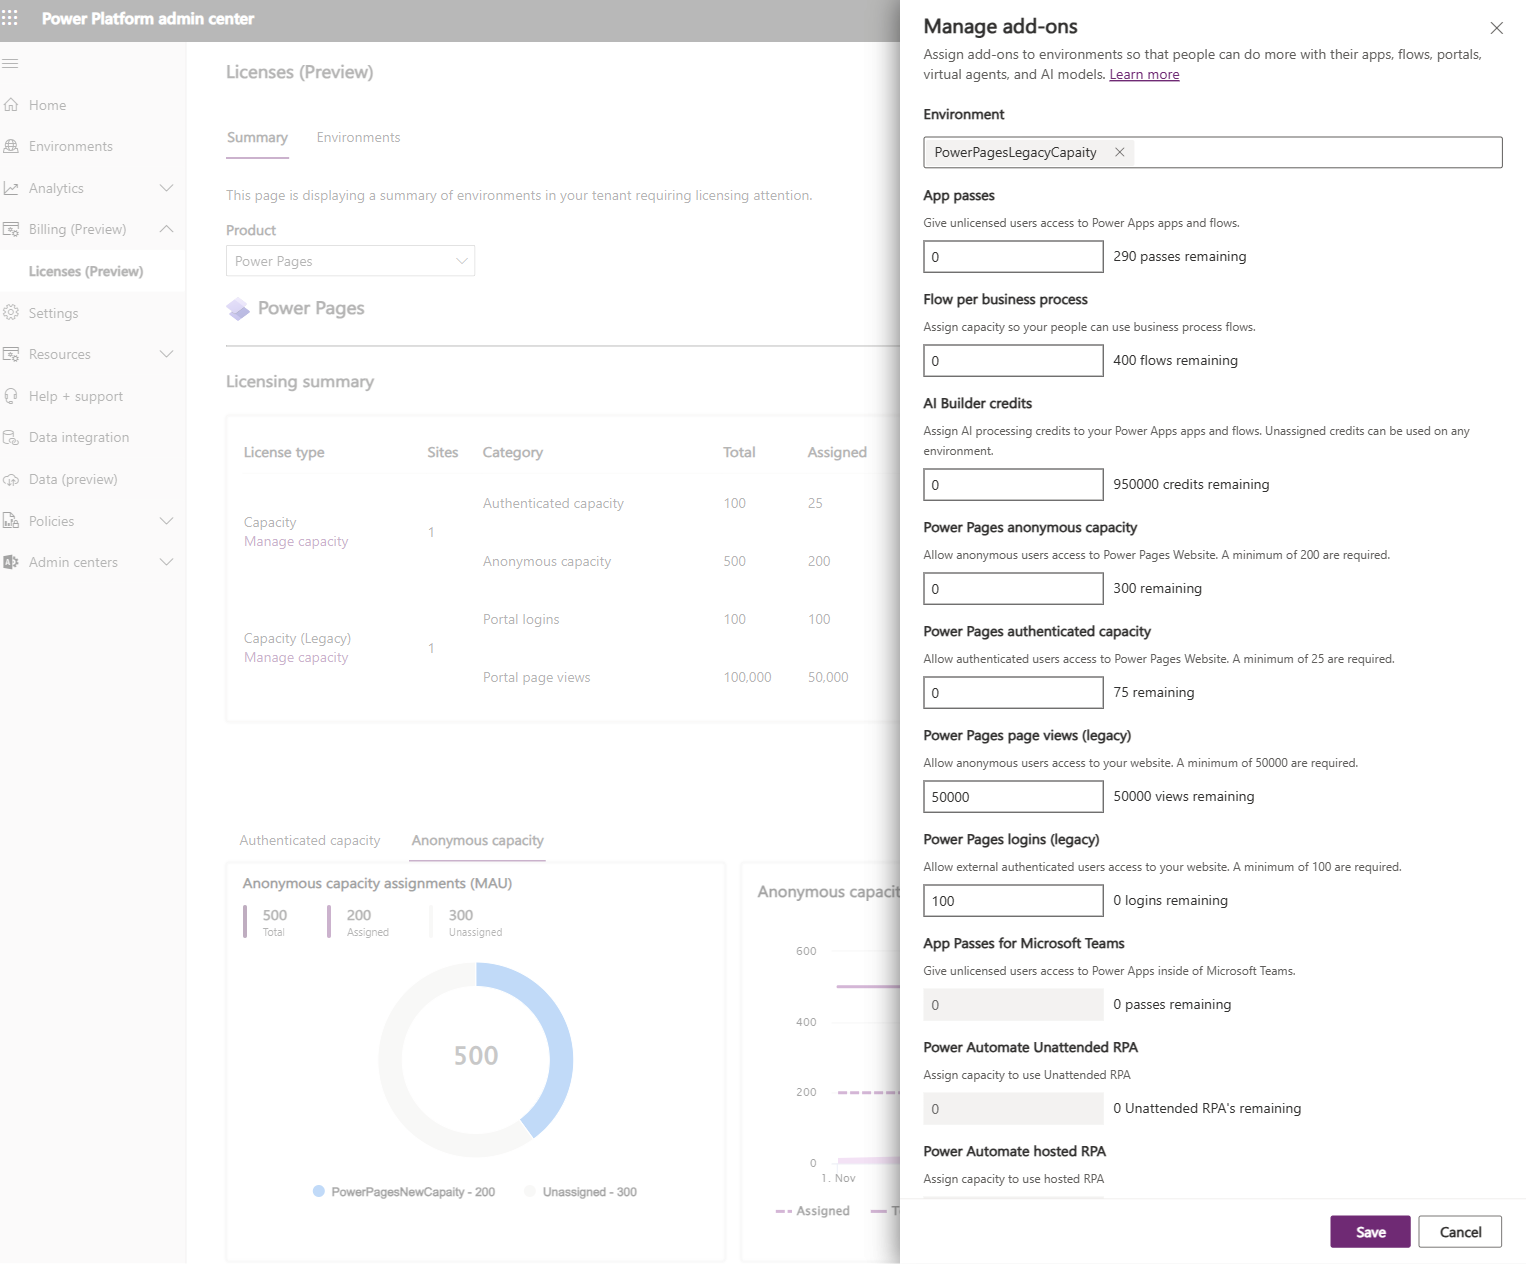
For Dynamics 365 Portal add-ons, a list of sites is shown to help plan the migration to current licensing models.
More information: Convert an existing website to capacity-based model
For the pay-as-you-go model, a list of sites is shown. Usage tracking for these sites is available directly from the Azure portal.
More information: View usage and billing information
Environment and site level capacity monitoring
Similar to the licensing summary view (tenant-level view), the environment-level view can be accessed from Billing > Licenses. To access the environment-level view, select the Environments tab and choose an environment.
The environment-level view extends the licensing dashboard to include detailed information about environment-level capacity consumption. Administrators can see how much capacity is assigned to the environment and how it's consumed by the sites within it. Like the tenant-level view, daily data for the past two months is available and monthly data for the last 12 months.
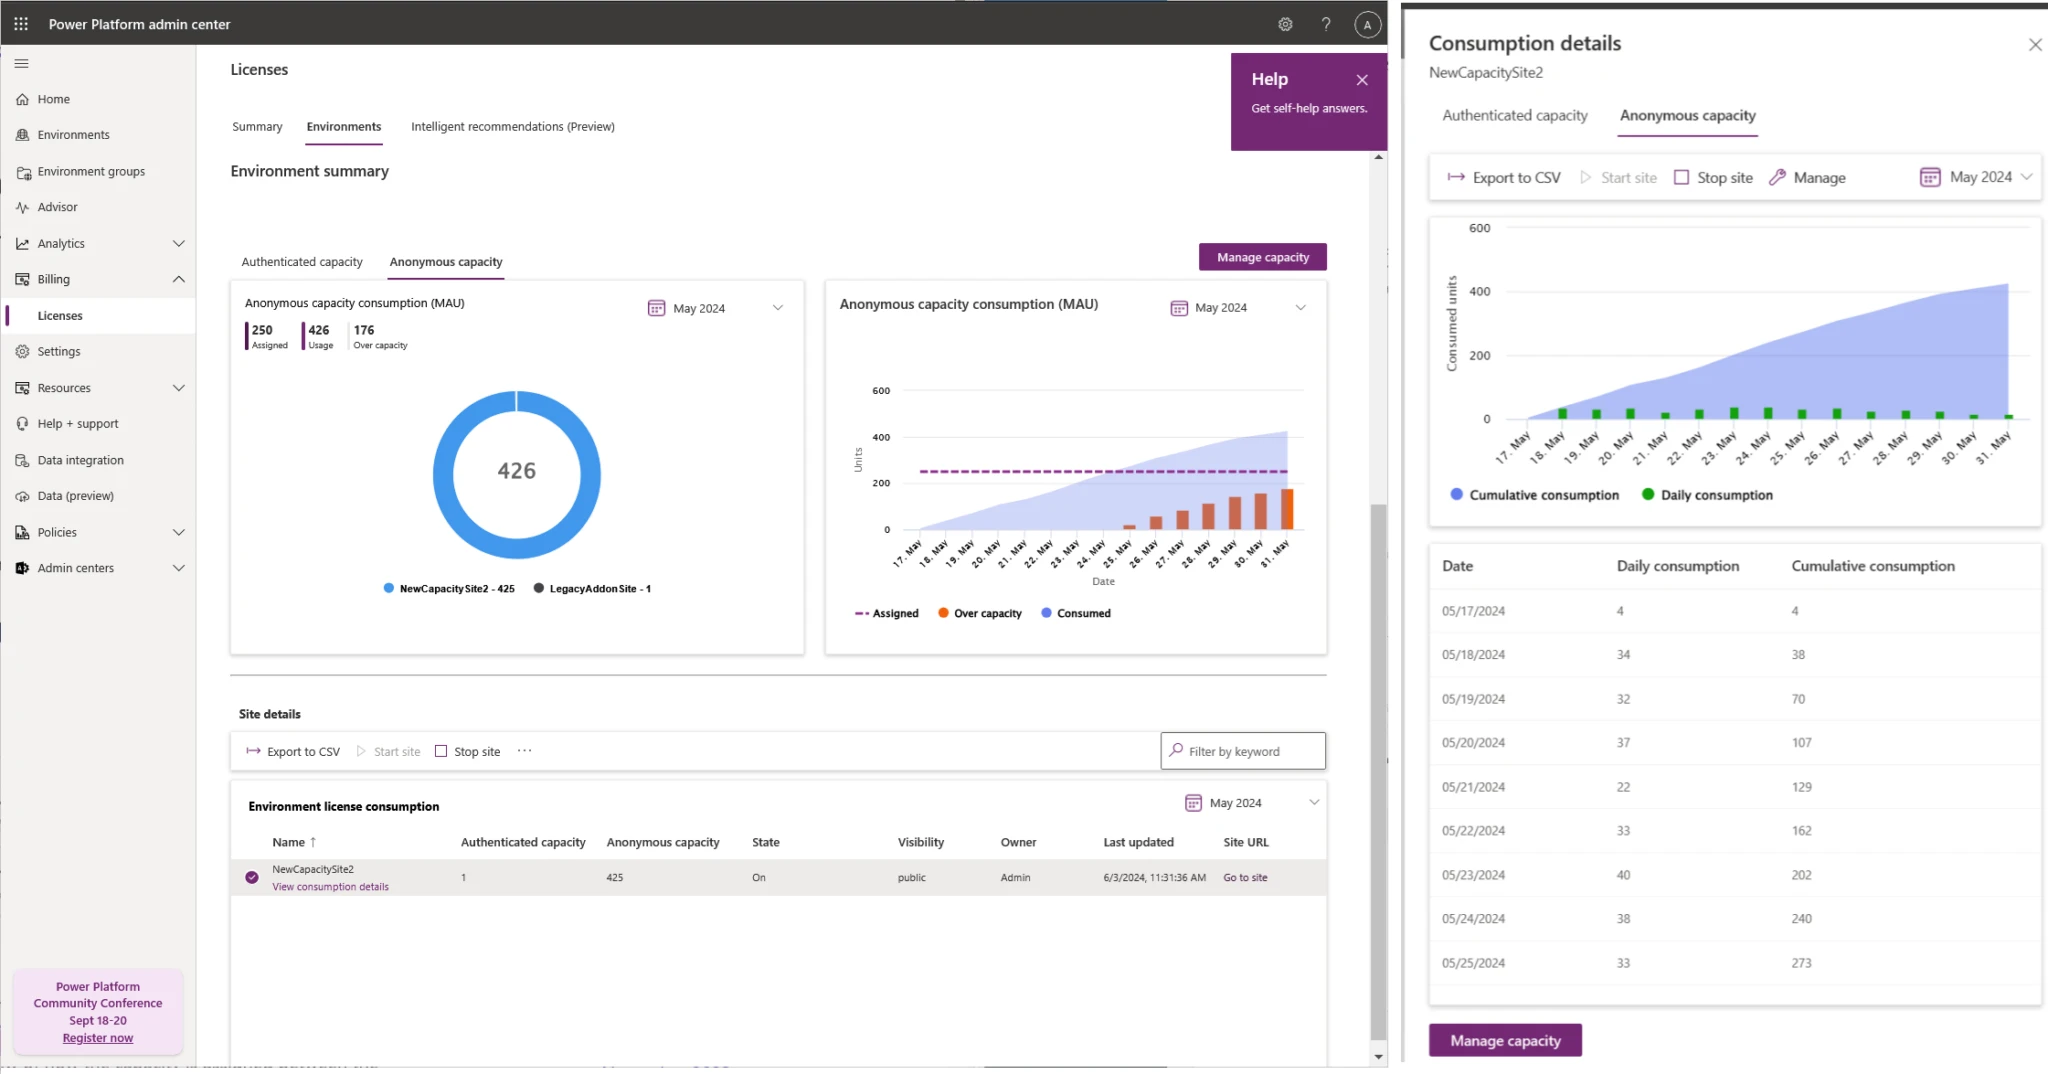
The following are the three main elements on the environment summary page.
Consumption pie chart
The consumption pie chart, located at the top left, shows how the consumption of capacity is divided among the sites in the selected environment. The capacity type can be selected from the capacity category pivot, and the time range can be controlled from the time range dropdown on the top right of the chart.
Consumption history graph
The consumption history graph, situated to the right of the consumption pie chart, visualizes the capacity assigned to the environment and its consumption over time. The time range can be changed between month-to-date (from the first of the current month to the current date), past two months, and monthly data for the past 12 months.
Site details
The site details list at the bottom of the view lists all the production sites in the environment that are using the current capacity model. The list includes consumption data for all the sites, for both authenticated and anonymous capacity type for the selected time range. The list also includes the state (whether enabled or not), visibility, owner, and last update date for the site. The rightmost column has a link to the actual site if the visible information alone isn't sufficient to identify a site.
The command bar at the top of the site details section includes links to site management and shortcuts for starting and stopping the selected site. The View consumption details link, under the site name, opens a pane with more details on the license consumption of that specific site, including daily consumption and cumulative consumption data, with capacity type selectors and time range controls.