Troubleshoot report performance in Power BI
This article provides guidance that enables developers and administrators to troubleshoot slow report performance. It applies to Power BI reports, and also Power BI paginated reports.
Slow reports can be identified by report users who experience reports that are slow to load, or slow to update when interacting with slicers or other features. When reports are hosted on a Premium capacity or Fabric capacity, slow reports can also be identified by monitoring the Fabric Capacity Metrics app. This app helps you to monitor the health and capacity of your Power BI Premium subscription.
Important
At times this article refers to Power BI Premium or its capacity subscriptions (P SKUs). Be aware that Microsoft is currently consolidating purchase options and retiring the Power BI Premium per capacity SKUs. New and existing customers should consider purchasing Fabric capacity subscriptions (F SKUs) instead.
For more information, see Important update coming to Power BI Premium licensing and Power BI Premium FAQ.
Follow flowchart steps
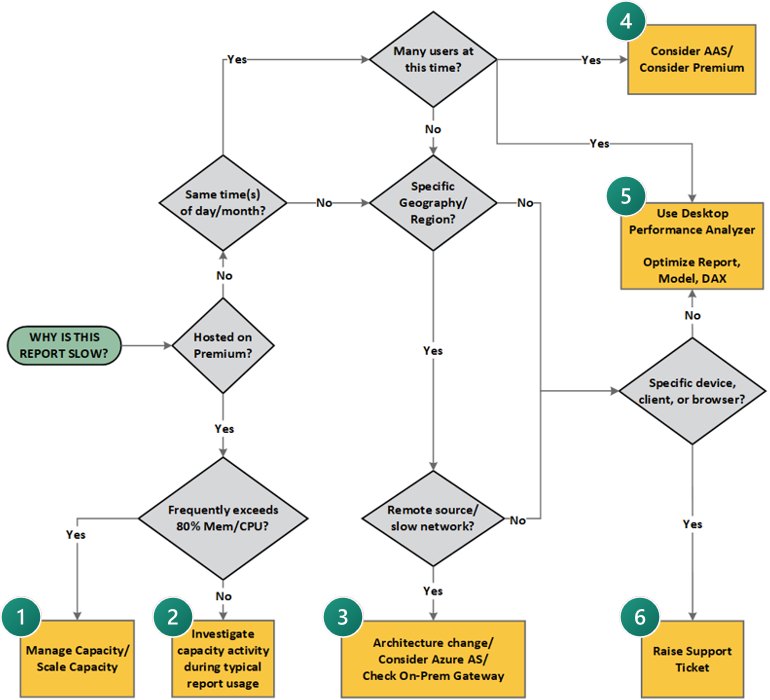
Use the following flowchart to help understand the cause of slow performance, and to determine what action to take.

There are six flowchart terminators, each describing action to take:
| Terminator | Action(s) |
|---|---|
 |
• Manage capacity. • Scale capacity. |
 |
• Investigate capacity activity during typical report usage. |
 |
• Architecture change. • Consider Azure Analysis Services. • Check on-premises gateway. |
 |
• Consider Azure Analysis Services. • Consider Power BI Premium. |
 |
• Use Power BI Desktop Performance Analyzer. • Optimize report, model, or DAX. |
 |
• Raise support ticket. |
Take action
The first consideration is to understand if the slow report is hosted on a Premium capacity.
Premium capacity
When the report is hosted on a Premium capacity, use the Fabric Capacity Metrics app to determine if the report-hosting capacity frequently exceeds capacity resources. When there's pressure on resources, it may be time to manage or scale the capacity (flowchart terminator 1). When there are adequate resources, investigate capacity activity during typical report usage (flowchart terminator 2).
Shared capacity
When the report is hosted on shared capacity, it's not possible to monitor capacity health. You'll need to take a different investigative approach.
First, determine if slow performance occurs at specific times of the day or month. If it does—and many users are opening the report at these times—consider two options:
- Increase query throughput by migrating the semantic model to Azure Analysis Services, or a Premium capacity (flowchart terminator 4).
- Use Power BI Desktop Performance Analyzer to find out how each of your report elements—such as visuals and DAX formulas—are doing. It's especially useful to determine whether it's the query or visual rendering that's contributing to performance issues (flowchart terminator 5).
If you determine there's no time pattern, next consider if slow performance is isolated to a specific geography or region. If it is, it's likely that the data source is remote and there's slow network communication. In this case, consider:
- Changing architecture by using Azure Analysis Services (flowchart terminator 3).
- Optimizing on-premises data gateway performance (flowchart terminator 3).
Finally, if you determine there's no time pattern and slow performance occurs in all regions, investigate whether slow performance occurs on specific devices, clients, or web browsers. If it doesn't, use Power BI Desktop Performance Analyzer, as described earlier, to optimize the report or model (flowchart terminator 5).
When you determine specific devices, clients, or web browsers contribute to slow performance, we recommend creating a support ticket through the Power BI support page (flowchart terminator 6).
Related content
For more information about this article, check out the following resources: