Tutorial: Connect to a GitHub repo with Power BI
In this tutorial, you connect to real data: the Power BI content public repository (also known as a repo) in the GitHub service. Power BI automatically creates a dashboard and report with the data. You see answers to questions like: How many people contribute to the Power BI public repo? Who contributes the most? Which day of the week has the most contributions? And other questions.
You can connect to your own private or public GitHub repos too. To use a Power BI template app to connect to your repos, see Connect to GitHub with Power BI.
In this tutorial, you complete the following steps:
- Sign up for a GitHub account, if you don't have one yet.
- Sign in to your Power BI account, or sign up, if you don't have one yet.
- Open the Power BI service.
- Find the GitHub app.
- Enter the information for the Power BI public GitHub repo.
- View the dashboard and report with GitHub data.
- Clean up resources by deleting the app.
If you're not signed up for Power BI, sign up for a free trial before you begin.
Prerequisites
To complete this tutorial, you need a GitHub account, if you don't already have one.
- Sign up for a GitHub account.
How to connect
Sign in to the Power BI service (app.powerbi.com).
In the nav pane, select Apps, then Get apps.
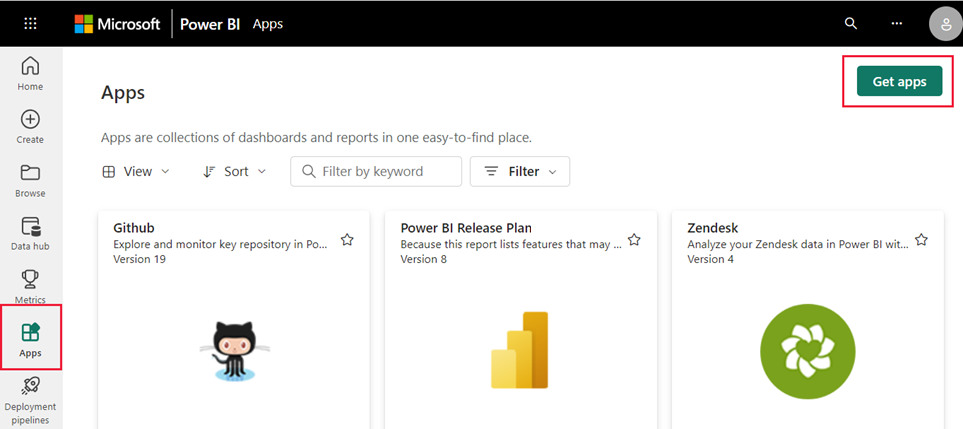
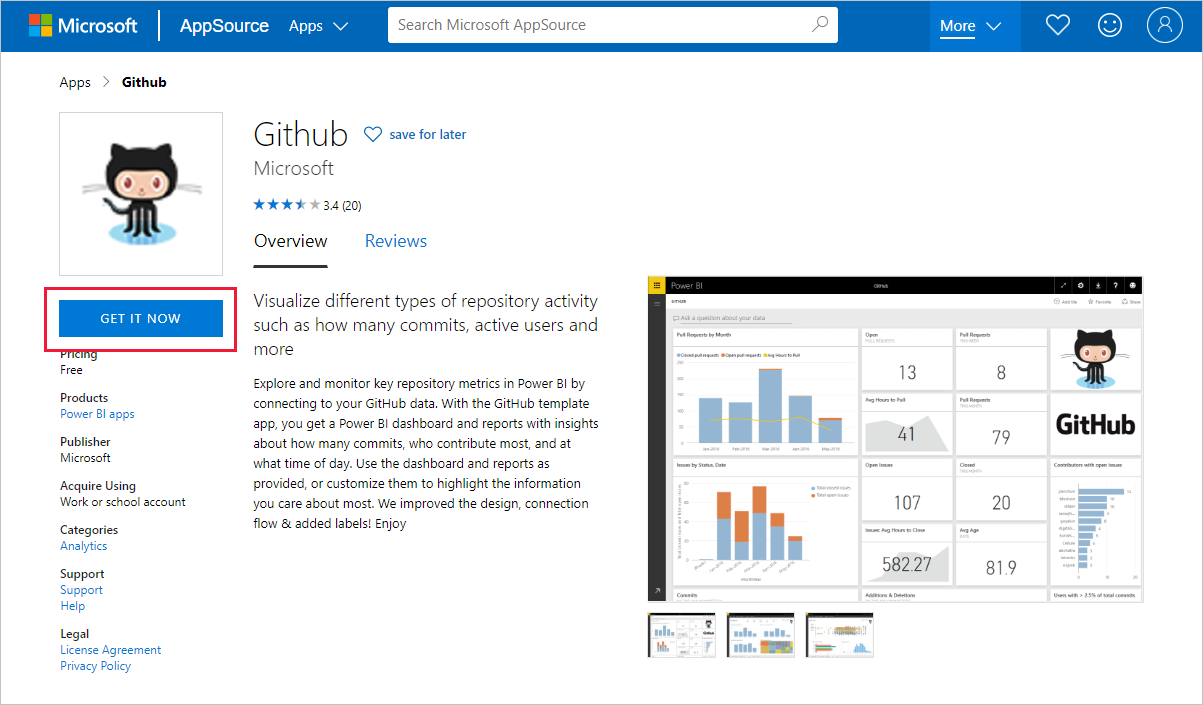
Enter GitHub in the search box. Select the app, and then choose Get it now.
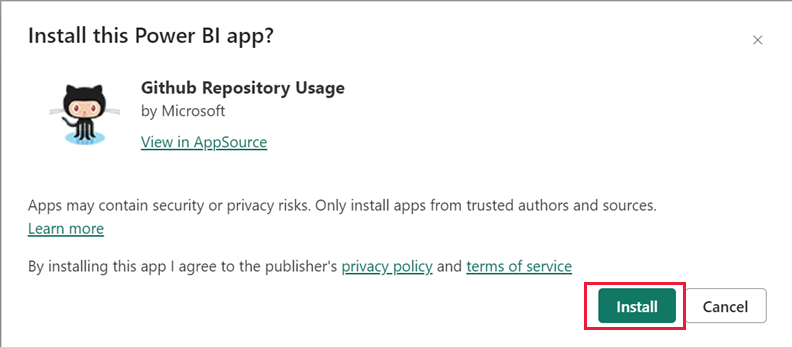
Select Install.
When you see the notification, Your new app is ready!, select Go to app.
On the app landing page, select Connect your data.

In the connect dialog, enter the repository name and repository owner of the repo. The URL for this repo is
https://github.com/MicrosoftDocs/powerbi-docs. EnterMicrosoftDocsas the repository Owner, andpowerbi-docsas the Repo name. Select Next.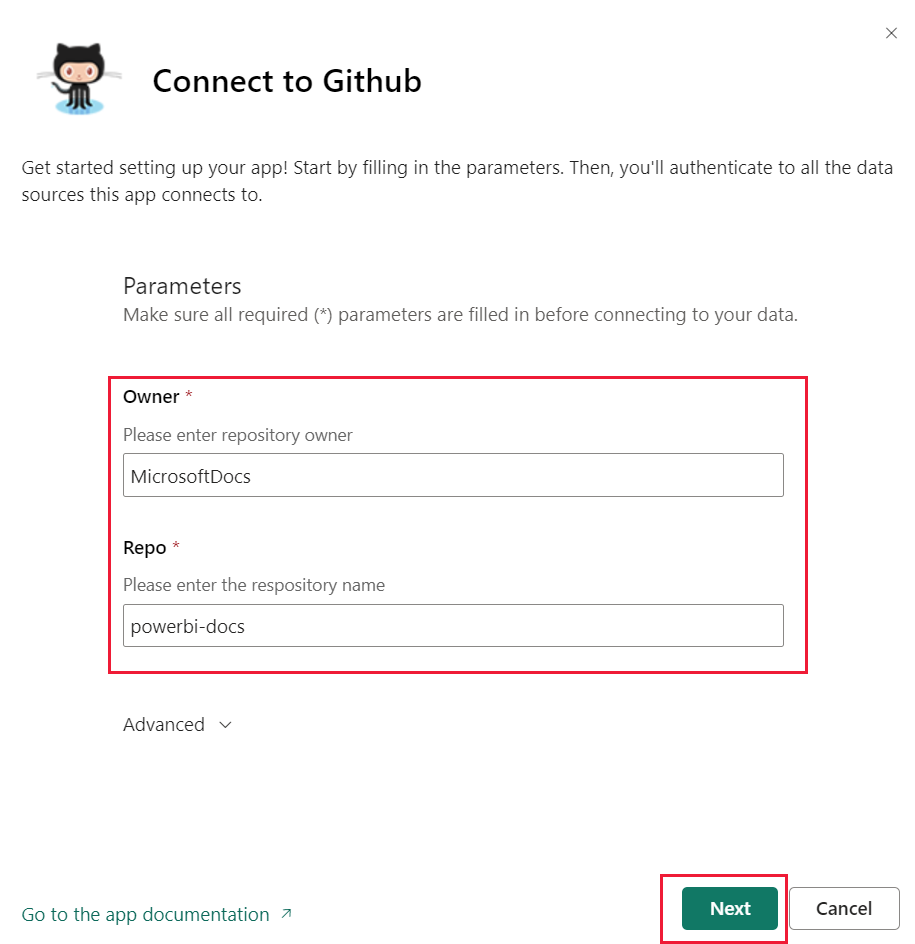
Make sure that Authentication Method is set to
OAuth2, and then select Sign in and connect.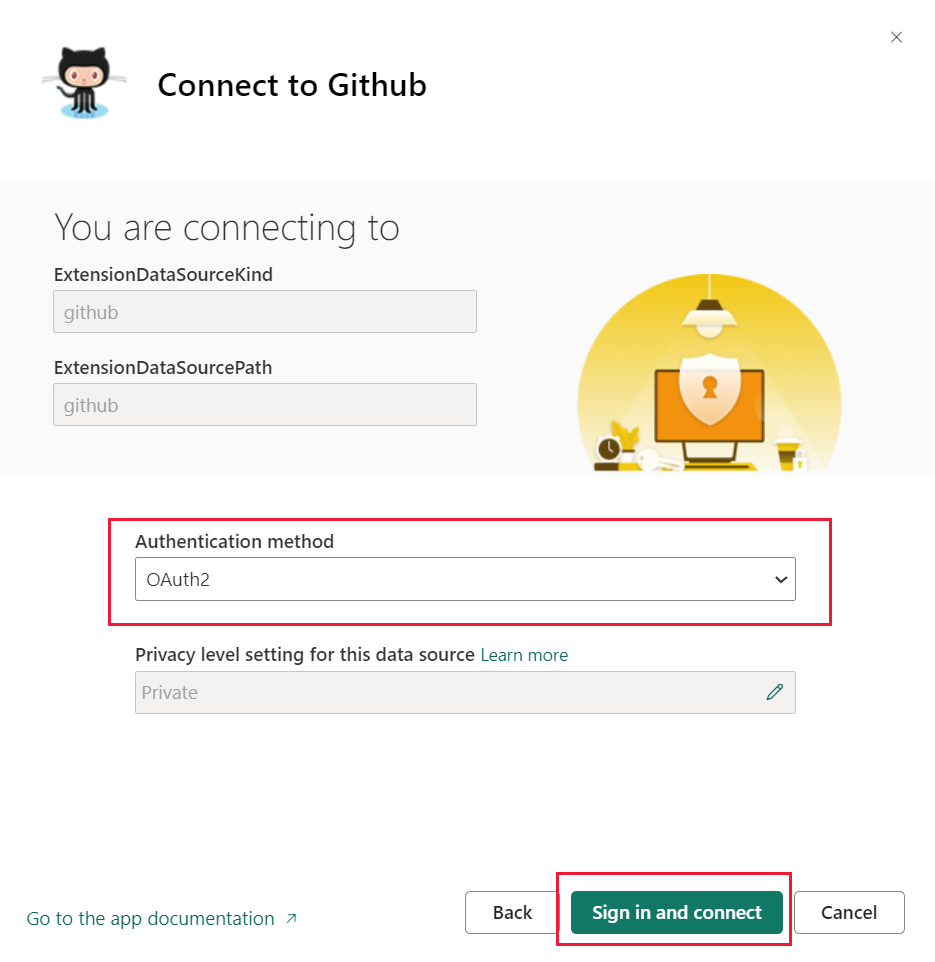
If prompted, follow the GitHub authentication instructions and give Power BI permission to access your data.
- After Power BI can connect with GitHub, the data in your Power BI semantic model is refreshed once a day.
- After Power BI imports the data, you see the contents in your new GitHub workspace.
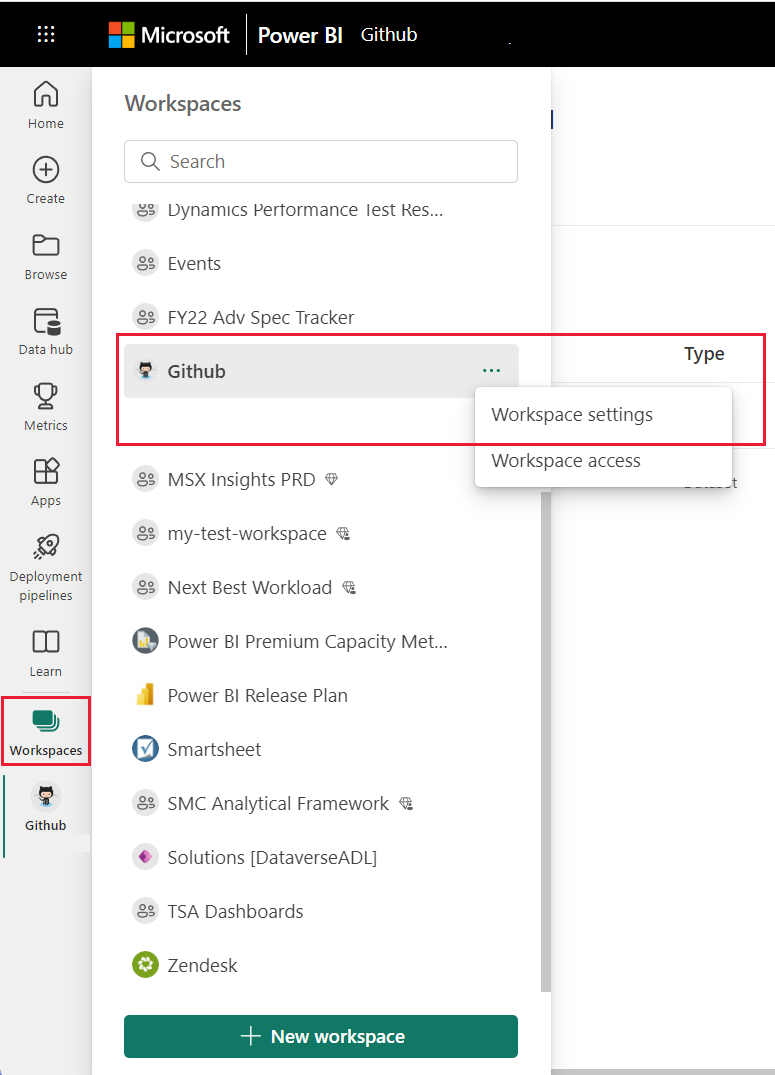
Select Workspaces in the nav pane to see the dashboard, reports, and semantic models. You can select More options (...) to view settings.
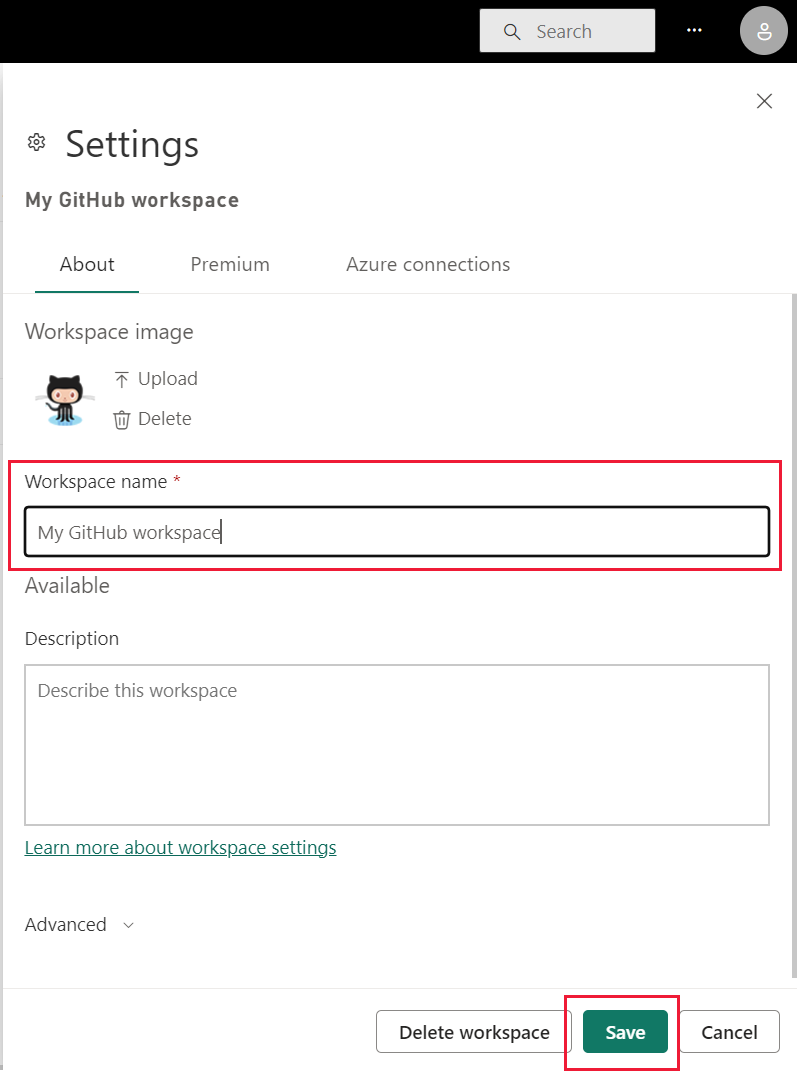
In workspace Settings, you can rename or delete the workspace.
Select your GitHub dashboard. You can minimize or expand the nav pane, so you have more room to see your data.
The GitHub dashboard contains live data, so the values you see may be different.

Ask a question
Select the Ask a question about your data text box. Power BI opens the Q&A window and offers some sample questions.
Enter how many users, Power BI offers a list of questions.
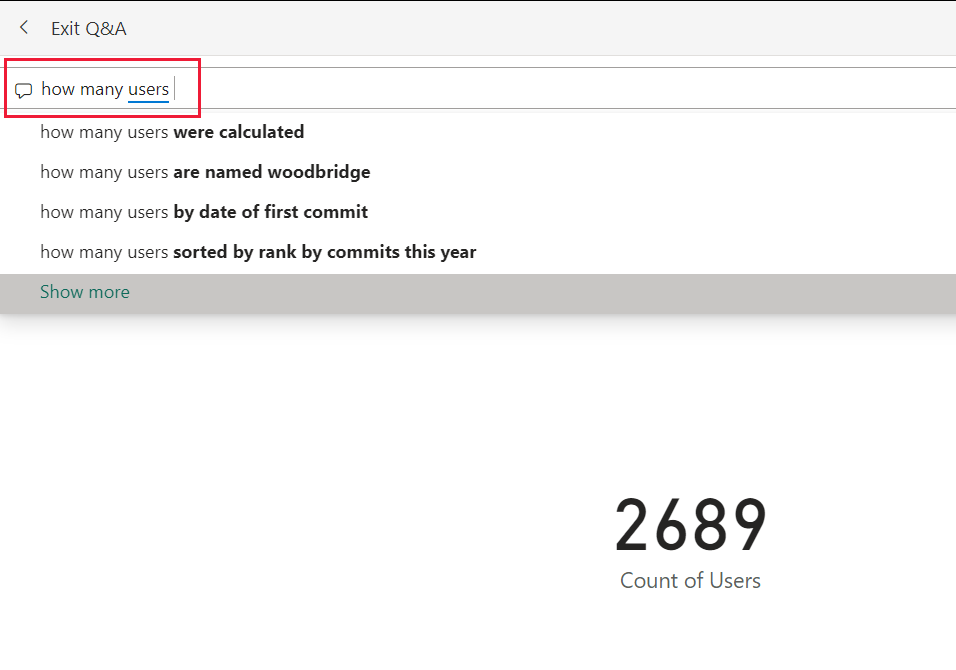
You can edit your question, for example, in between how many and users, type pull requests per.
Power BI creates a bar chart visual that shows the number of pull requests per person.
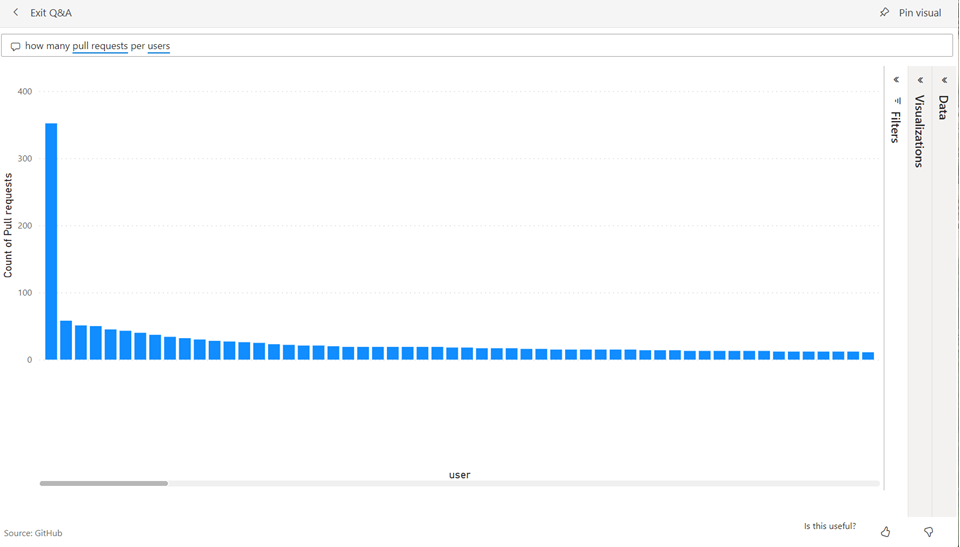
Select the pin icon to pin the visual to your dashboard, then Exit Q&A.
View the GitHub report
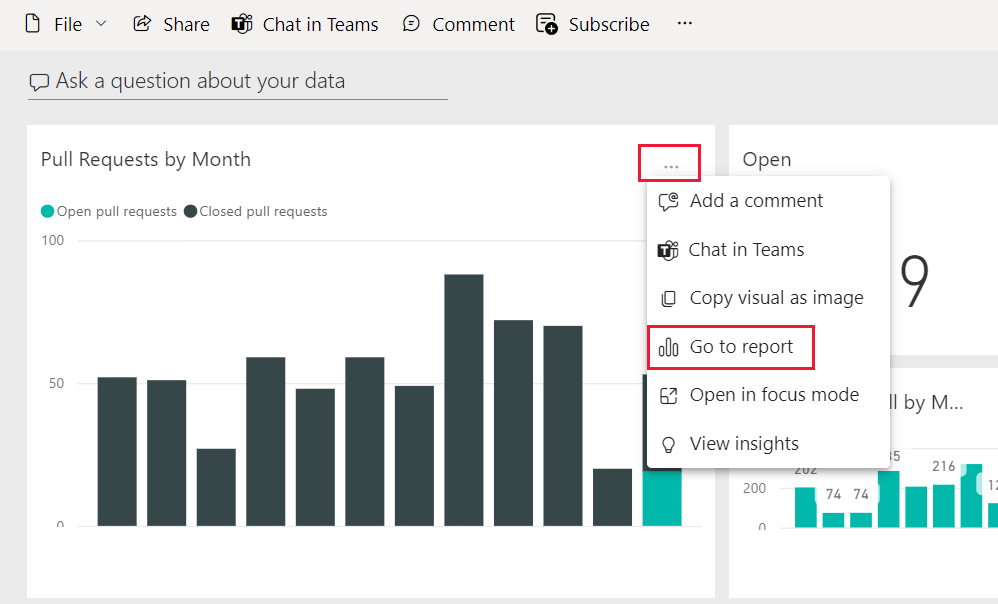
On the GitHub dashboard, select More options (...) on the column chart Pull Requests by Month. Choose Go to report.
Select a user name in the Total pull requests by user chart. A new tile appears with results for one user.
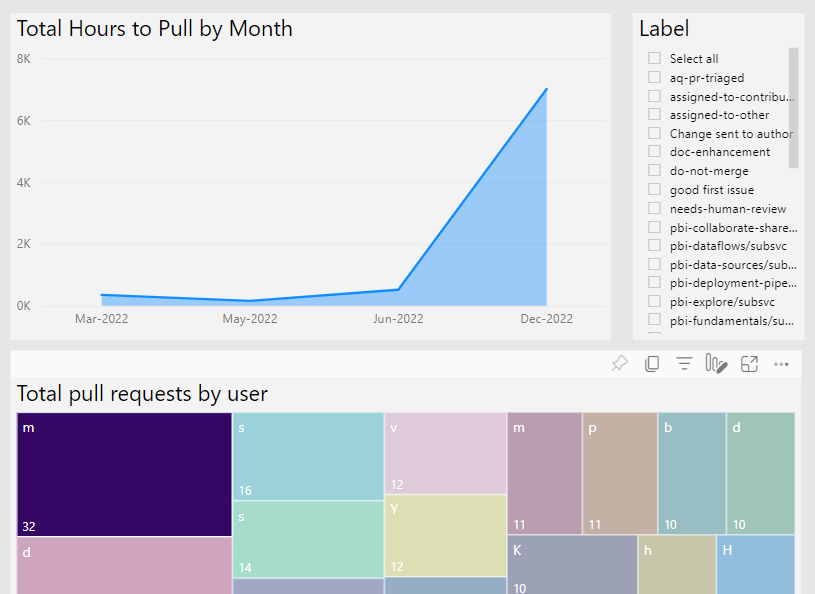
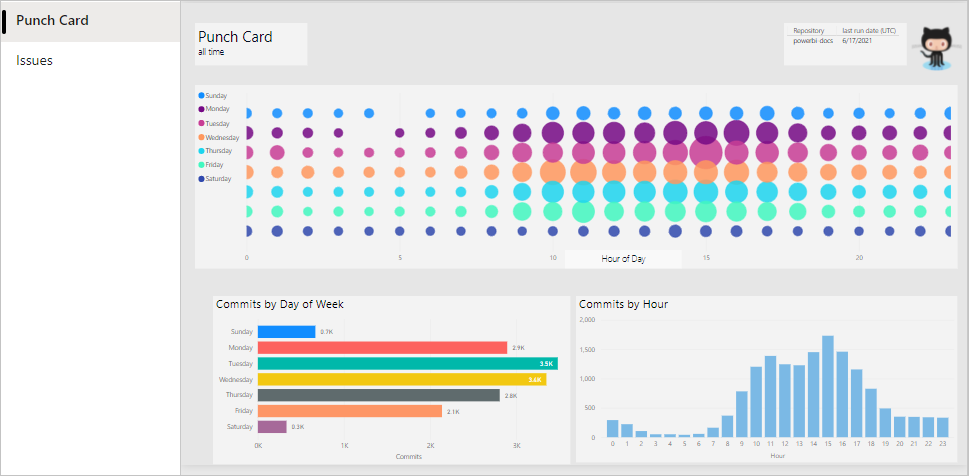
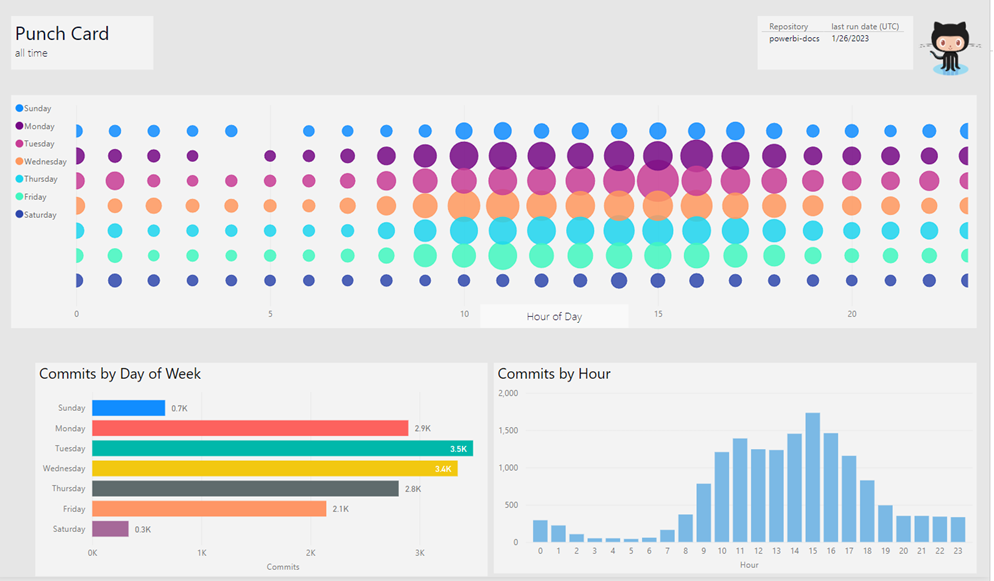
Select the Punch Card tab to view the next page of the report. Now you can see volumes of work by hour of the day and day of the week.
Clean up resources
Now that you've finished the tutorial, you can delete the GitHub app.
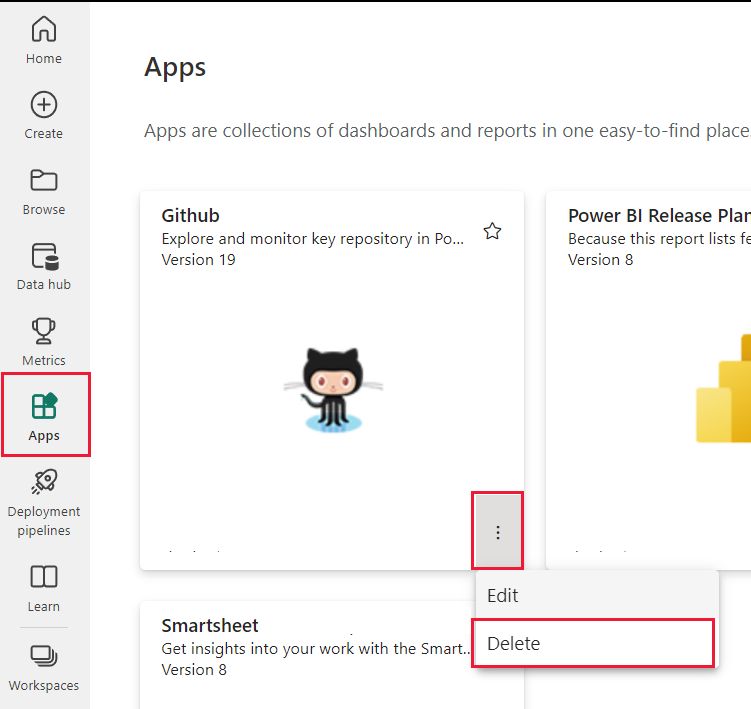
In the nav pane, select Apps.
On the app tile, select More options (...) and then choose Delete.
Related content
In this tutorial, you've connected to a GitHub public repo and gotten data, which Power BI has formatted in a dashboard and report. You've answered some questions about the data by exploring the dashboard and report. Now you can learn more about connecting to other services, such as Salesforce, Microsoft Dynamics, and Google Analytics.