Assessing the business impact of the automation
After you've successfully deployed your automation, you can assess its impact by comparing your original business process against your new process, using the success metrics you defined. Your automation results are stored for 30 days, during which you can view them to analyze the total number of actions and runs in a day.
To view flow analytics
Go to My flows.
Select the flow you want to analyze.
Select Analytics.

Select the Usage tab.
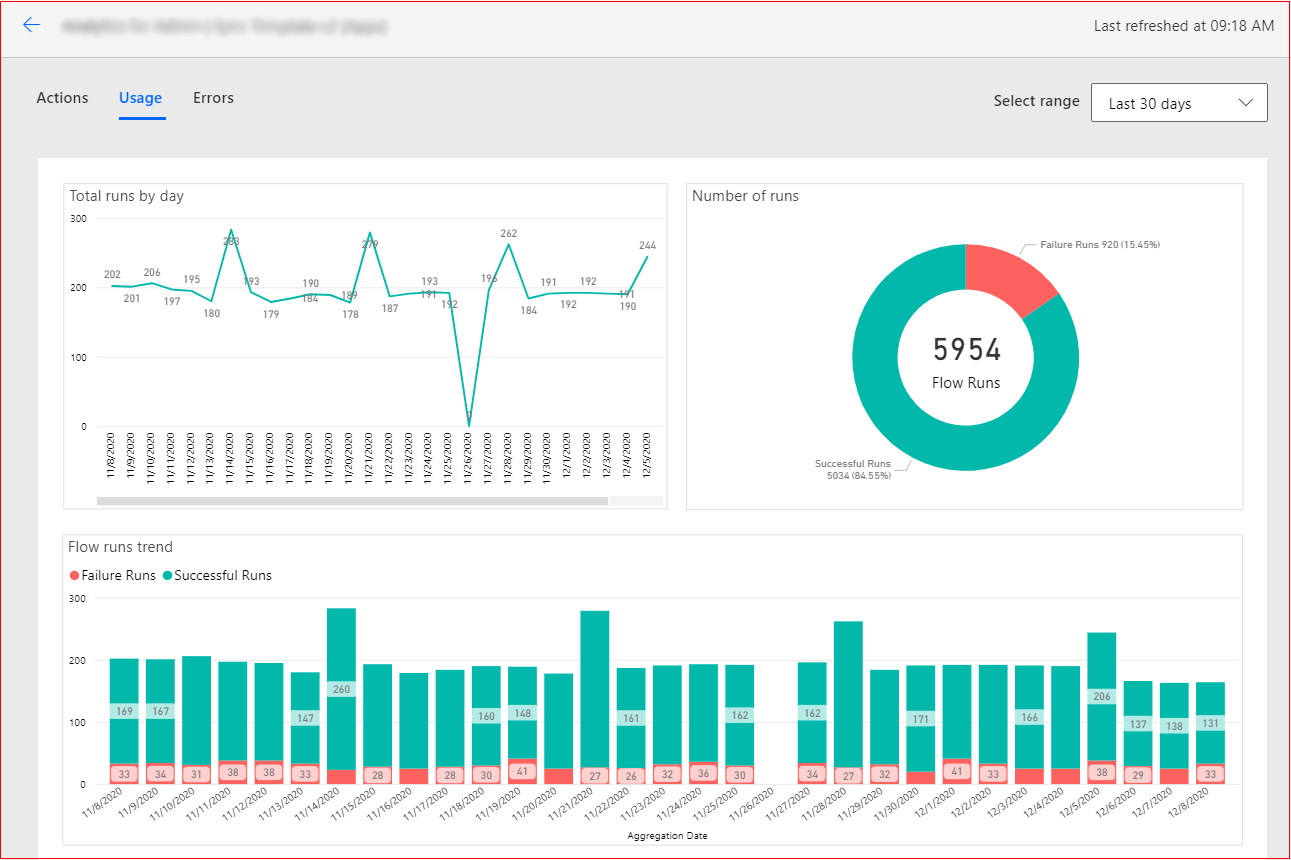
Get the number of flow runs
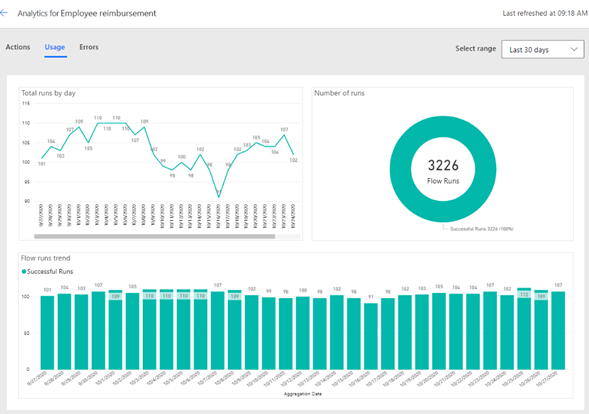
The Usage tab shows you how many times in a day the flow has been used to automate a particular business process.
To export run data to an Excel workbook
Hover over the graph that shows the data you want to export.
Select More Options.
Select Export data.
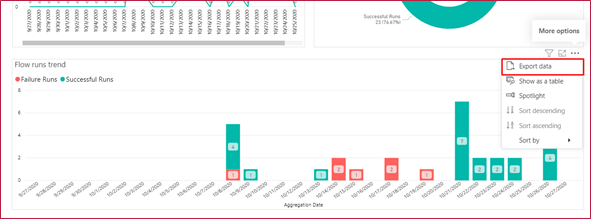
Select the file format you want (Excel workbook or CSV).
Select Export.
Get the flow run duration
To see the duration of each flow run
Go to My flows.
Select the flow you want to analyze.
In the 28-day run history, select All runs.
If you want to export the information, select Get .csv file.
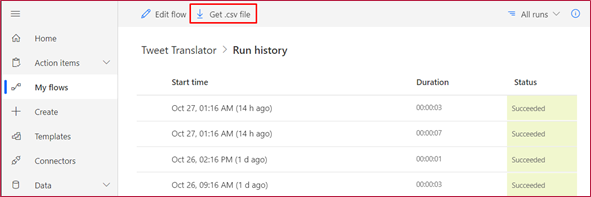
The CSV file includes start time and end time of each run. You can use Excel to recalculate the duration and do additional analysis (such as finding the average duration). To get the duration in seconds, use the following formula:
(Run end time cell − Run start time cell) × 24 × 60 × 60
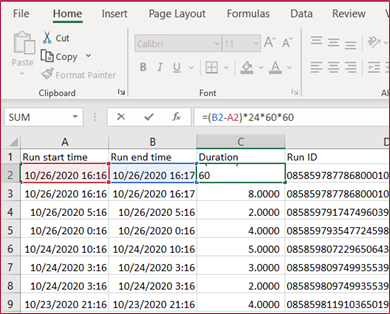
To get the average duration, obtain the total the number of durations, and divide it by number of runs (no. of rows).
Now that you have the number of runs and duration of the runs, you'll be able to find out how much time your automation has saved by comparing it with the previous manual process.
Example scenario
Let's take the scenario from cash reimbursement as an example.
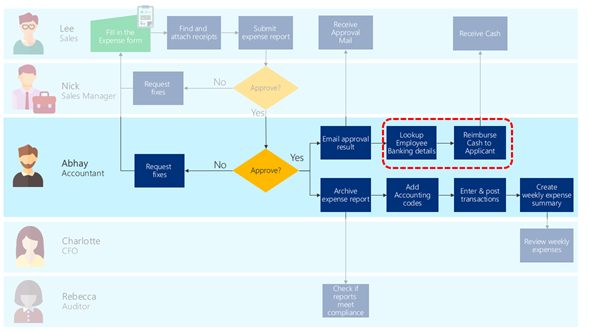
Previously, Abhay's accounting team had to key in accounting codes, enter transactions, and post transactions in the accounting system based on the information they received in the approval email attached to the expense report. Let's say that in the automation planning phase, Abhay measured how long this takes and recorded that it took three minutes to look up the employee's banking details and another five minutes to reimburse the applicant from the online banking website.
Based on the flow run analytics, Abhay can see that the automation ran between 91 to 110 times a day, for an average of 107 runs.
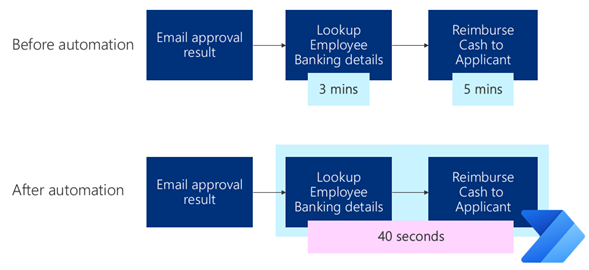
The duration of the automation obtained is 40 seconds on average. Therefore, the time reduced per run is:
Time before automation (3 minutes + 5 minutes) − time after automation (40 seconds) = 440 seconds
Because the automation ran 3,226 times in 30 days, total time saved is:
Reduced time (440 seconds) × number of runs (3,226 times) = 1,419,440 seconds = 394.28 hours