Automation Kit Control Center - Historical Voluminous Data Monitoring
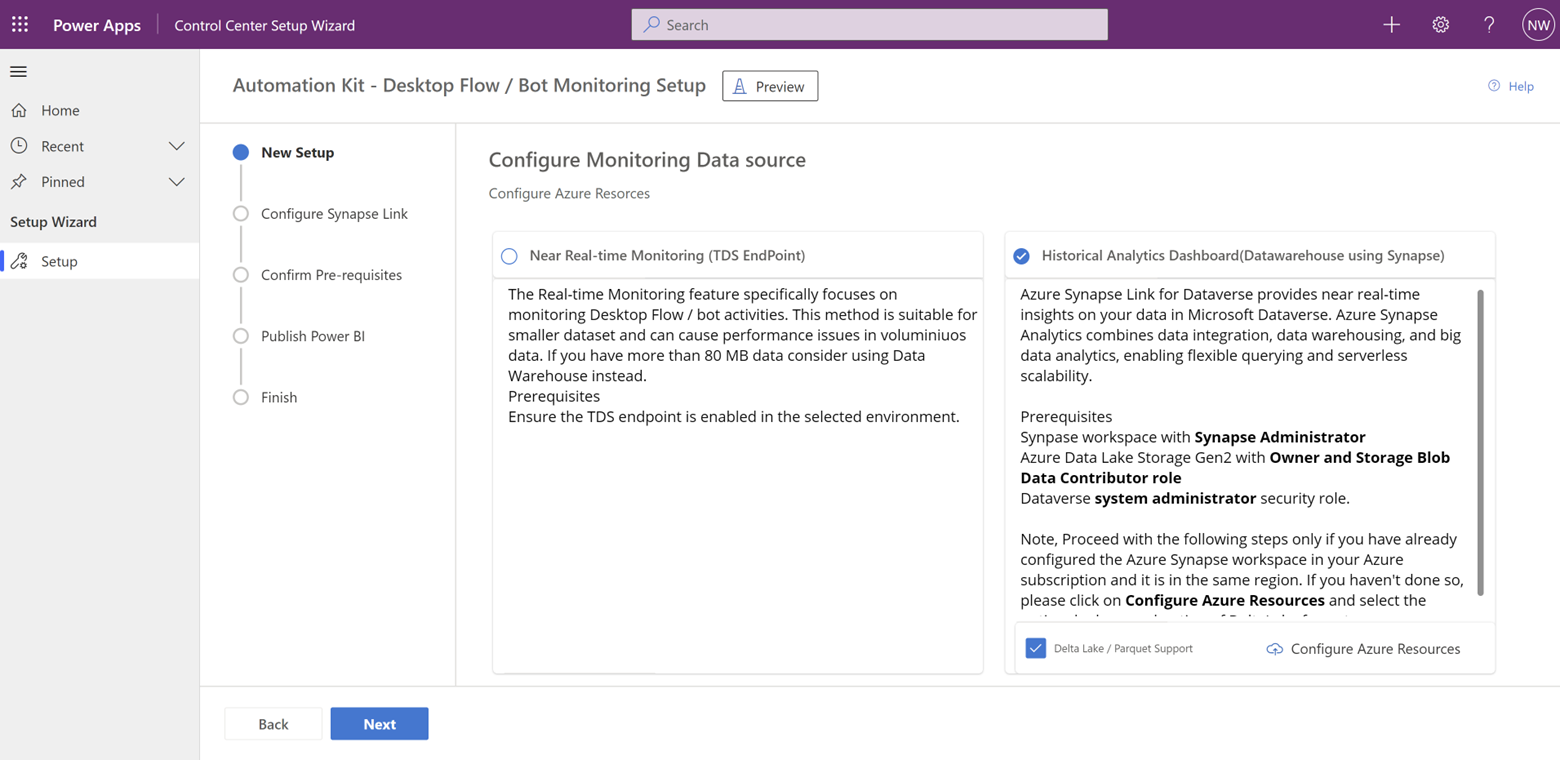
The Automation Kit Control Center offers two powerful options for historical data monitoring: "Historical Analytics Dashboard using Data Warehouse Approach" and "TDS Desktop Flows Monitoring." These options are suitable when monitoring Desktop flows at scale for large volumes of transactional logs.

Historical Analytics Dashboard using Data Warehouse Approach


When you need to monitor Desktop flows at scale and deal with voluminous historical data, the "Historical Analytics Dashboard" is an excellent choice. This option requires a set of prerequisites to be completed:
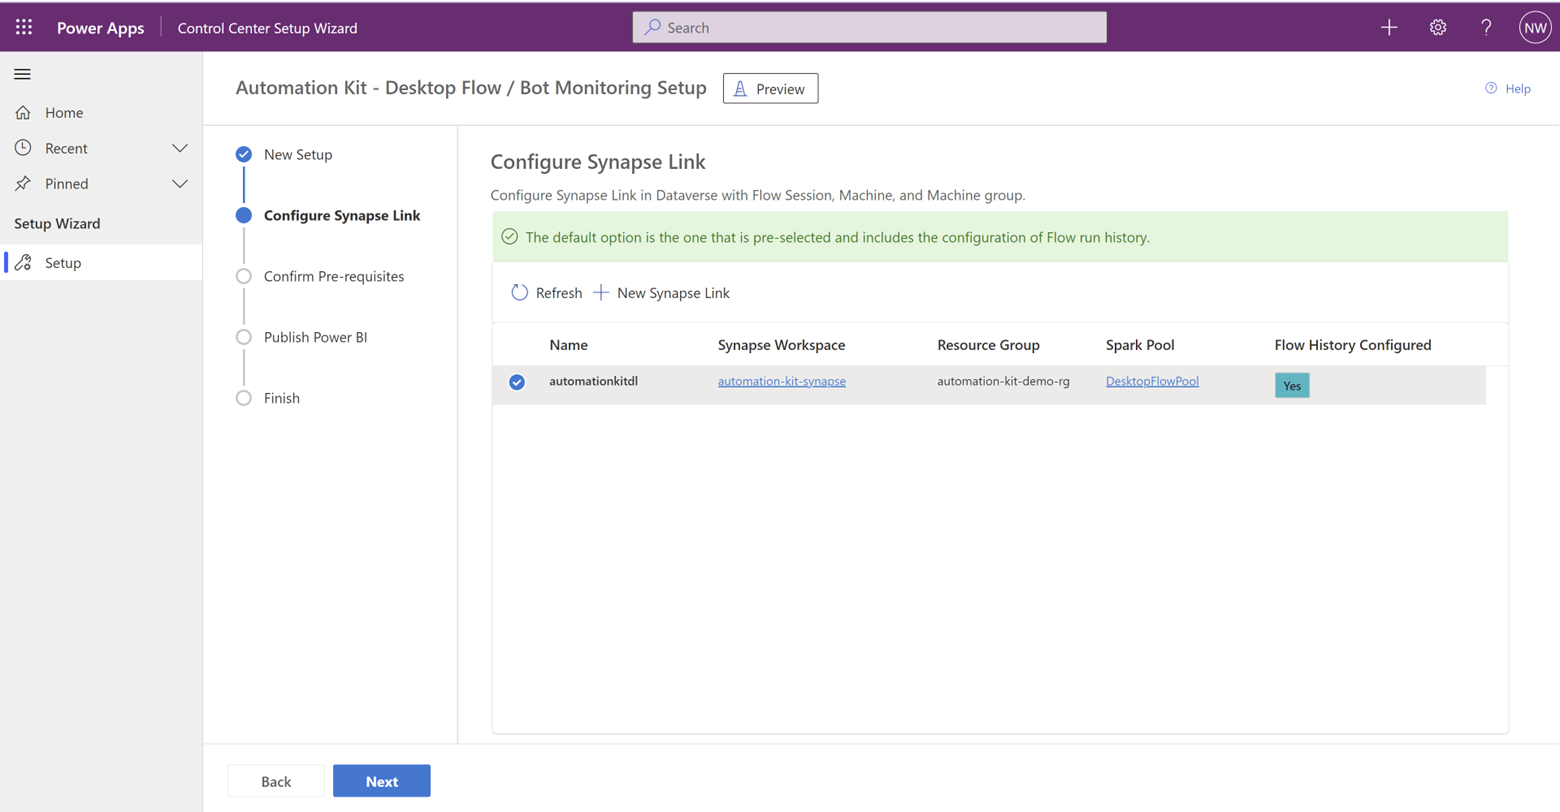
Synapse Link Setup: Configure the Azure Synapse Link to connect your Data Warehouse with the Control Center.
Storage Compression using Delta Lake: Choose Delta Lake as the storage compression option for efficient data management.
Azure Resource Configuration with ARM Deployment: Automate the setup and deployment of all Azure resources required for the monitoring.
Historical Analytics Dashboard

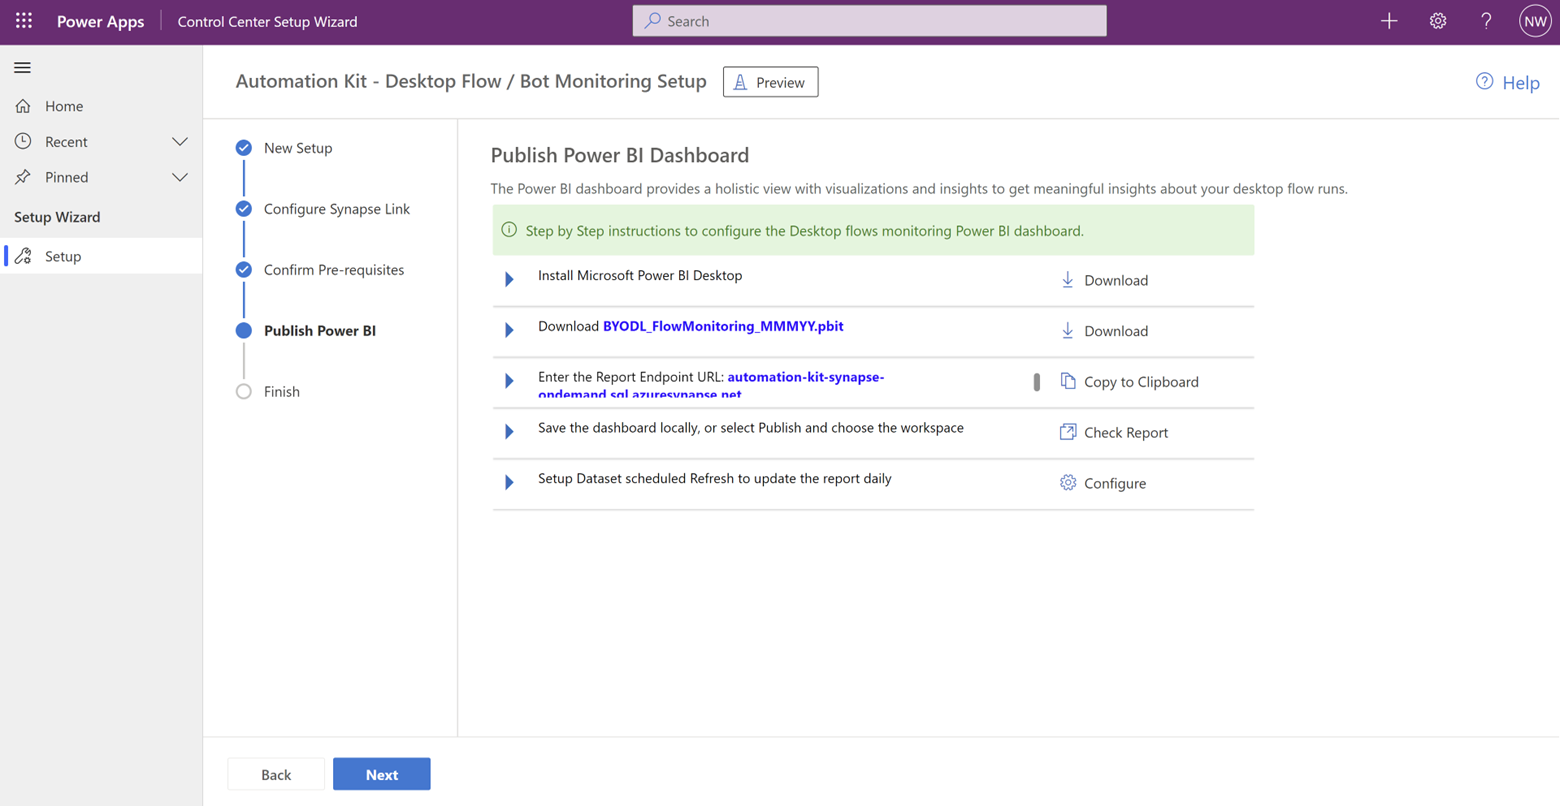
To further enhance the monitoring capabilities, the Power BI dashboard of the BYODL_FlowMonitoring_MMYYYY report should be published with an SQL endpoint and configured with a refresh schedule.
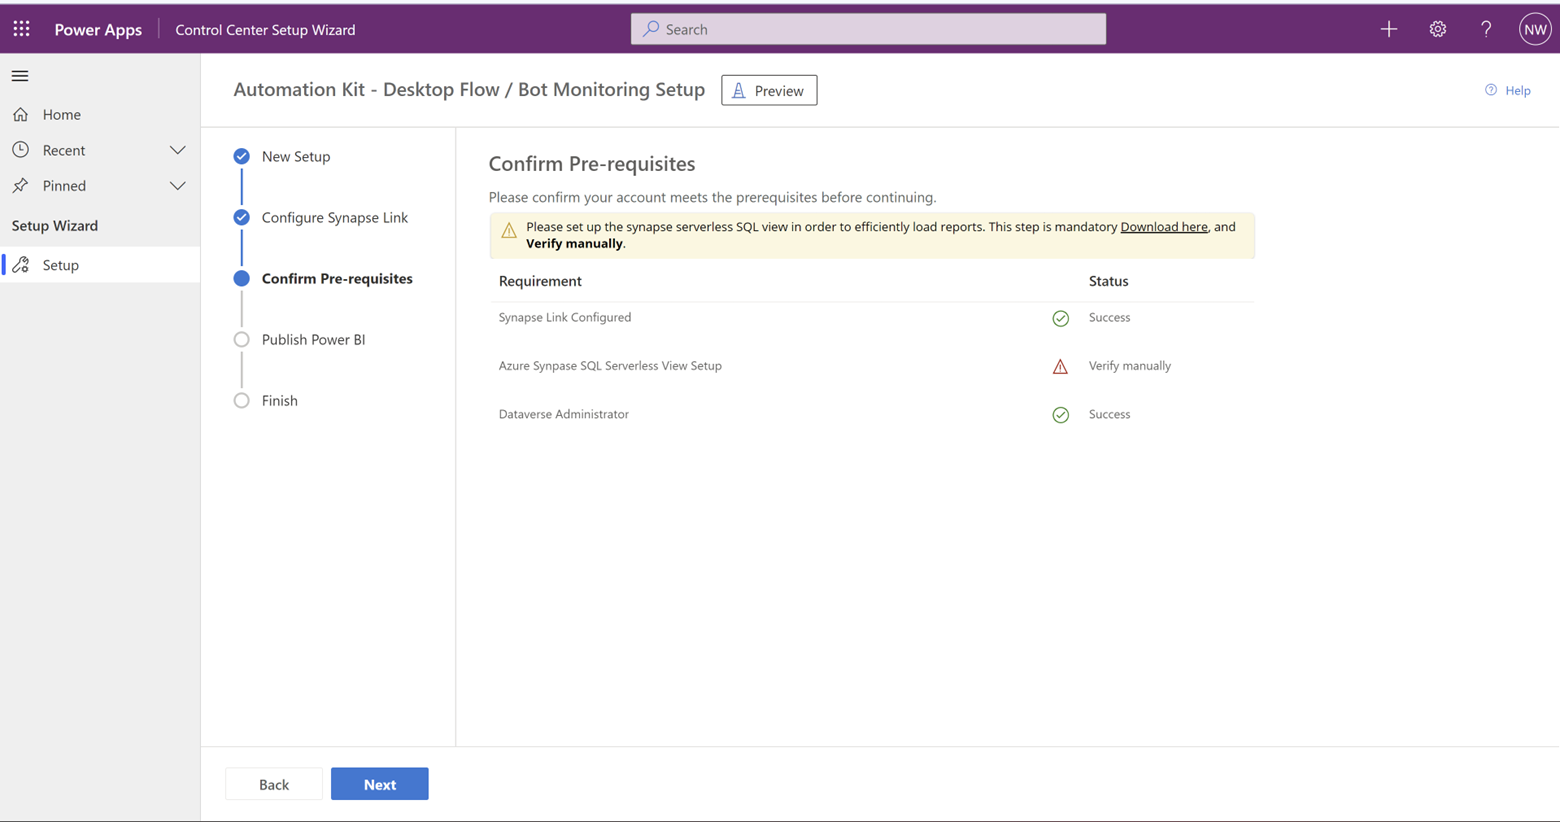
Customized SQL View Script
The wizard provides a customized SQL view script, which, when run in the Synapse SQL DB, enhances performance and reduces the burden of query processing and cost. This optimization is crucial when dealing with vast amounts of historical data.
Azure Synapse SQL Endpoint
With the power of Azure Synapse Link and the efficient BI reporting, the Automation Kit Control Center empowers you to make data-driven decisions and monitor your Desktop flows with ease and accuracy.
Power BI Dashboard
The setup wizard simplifies the installation of Azure resources, configuration of Azure Synapse Link, and customizes the SQL view script to optimize performance and reduce query processing costs.
TDS Desktop Flows Monitoring
The "TDS Desktop Flows Monitoring" option enables you to set up the FlowMonitoring_MMYYYY Power BI report to connect with your environment URL. However, before using this option, ensure that TDS (Tabular Data Stream) is enabled at the environment level.
The setup wizard guides you through the process, making it easier to set up the BI report, configure the Synapse SQL endpoint, and connect with your environment.
By using the "Historical Analytics Dashboard using Data Warehouse Approach" or "TDS Desktop Flows Monitoring" options in the Control Center Setup Wizard, you can effectively monitor your Desktop flows, handle large volumes of historical data, and gain valuable insights for better decision-making and process optimization.