Use Monitor to get insights and recommendations for your canvas app (preview)
Monitor in Power Apps offers insights and recommendations to enhance app performance. It provides makers with detailed information on their app's performance and actionable steps to improve their apps.
Important
- This is a preview feature.
- Preview features aren't meant for production use and might have restricted functionality. These features are subject to supplemental terms of use, and are available before an official release so that customers can get early access and provide feedback.
- This feature is being gradually rolled out across regions and might not be available yet in your region.
Prerequisites
To use this feature, your administrator must enable certain analytics and monitoring settings in the Power Platform Admin Center. More information: Monitoring experiences for makers
Open and pin Monitor
- Sign in to Power Apps.
- On the left navigation, select Apps.
- On the command bar, select Monitor.
- On the left navigation pane, select the
 pin button next to Monitor.
Use Monitor
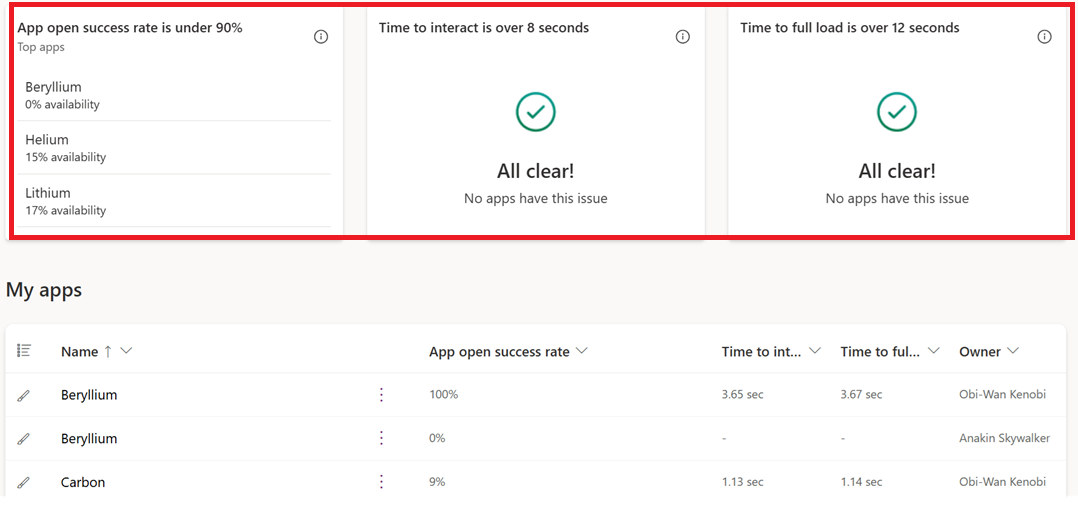
The Monitor page displays metric cards at the top, highlighting the top three underperforming apps for each metric. If all apps perform well on a specific metric, then no apps are listed in the card.

| Metric | Definition |
|---|---|
| App open success rate | Indicates the percentage of app launch attempts that successfully allowed end-users to access the app. This metric is calculated once every 24 hours. |
| Time to interact | Measures the time end-users wait to access the first screen of an app. It doesn't include the time users wait to see all data presented on the first screen, such as filling in rows of a gallery. This metric is calculated every 24 hours and is measured using percentiles, with the 75th percentile being reported. |
| Time to full load | Measures the time end-users wait to see all data displayed on the first screen of an app. In the app launch lifecycle, this metric follows the Time to interact phase. This metric is calculated every 24 hours and is measured using percentiles, with the 75th percentile being reported. |
View metrics and recommendations for an app
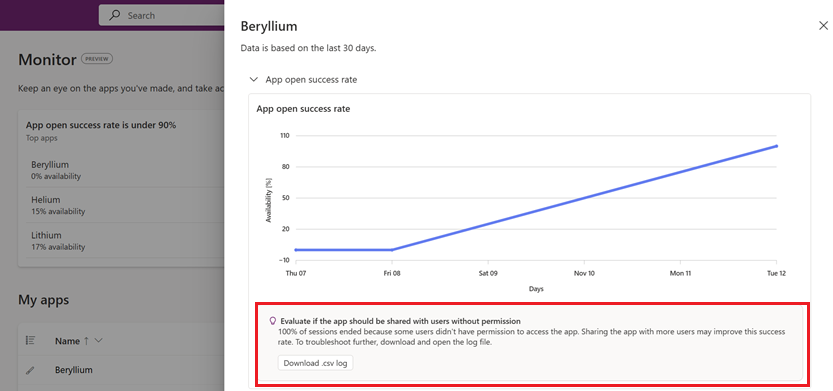
When you select an app on the Monitor page a side pane opens and display more data for each metric, including a data chart for the last 30 days.
On Monitor page, select an app.
To view recommendations for an app, select the app’s name to open the side panel. The chart shows a callout with a recommended action for improving the metric.

Important
Recommendations are only available in Managed Environments. Please contact your admin to enable Managed Environments for access to recommendations.