Troubleshooting the DevTools extension
- Make sure to open DevTools in one of the supported ways or scenarios. See Opening DevTools and the DevTools browser.
Controlling CSS mirror editing
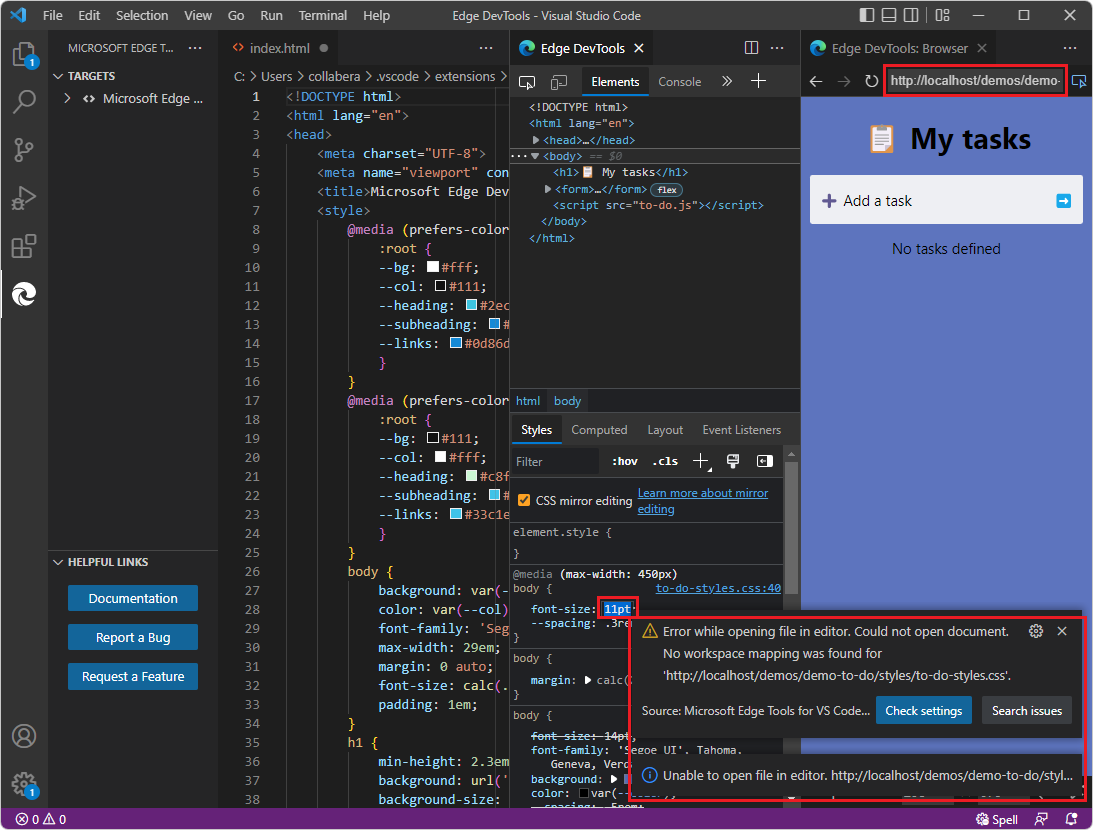
By default, the CSS mirror editing checkbox is selected, in the Styles tab in the Elements tool in the Edge DevTools tab. If you change CSS values using DevTools, but DevTools doesn't find a matching file in a workspace (folder) that's open in Visual Studio Code, error messages about mapping to source files for CSS mirror editing appear.
If you are changing CSS in DevTools, either:
Select the CSS mirror editing checkbox and open a folder that contains source files that match the webpage that you are inspecting with DevTools.
Or, clear the CSS mirror editing checkbox, to prevent such error messages.
See also:
- The CSS Mirror Editing checkbox in Update .css files from within the Styles tab (CSS mirror editing)
- Mapping URL files to the opened folder in Opening DevTools and the DevTools browser.
Restarting DevTools
A powerful way of restarting DevTools is to close and reopen the folder:
In Visual Studio Code, select File > Close Folder.
If you started a web server by using Terminal in Visual Studio Code, restart the web server, such as by running
npx http-server. Or instead, you can start the web server from a command prompt outside of Visual Studio Code, so it keeps running. For more information, see Step 6: Set up a localhost server in Installing the DevTools extension for Visual Studio Code.In Visual Studio Code, select File > Open Recent, and open a folder that contains web page source files.
Closing all instances of DevTools
Normally, closing the two DevTools tabs closes any instances of DevTools and the DevTools browser. If the Debug toolbar is open, click the Stop button.
To reset the state of DevTools, close all instances of DevTools. Make sure the Launch Instance button is shown in Visual Studio Code > Activity Bar > Microsoft Edge Tools Side Bar. That indicates that no instance of DevTools is running.
If necessary, close all Visual Studio Code instances, then open Visual Studio Code, and make sure the Launch Instance button is shown in Activity Bar > Microsoft Edge Tools Side Bar.
Error messages
The solution for most error messages is to open DevTools in one of the recommended ways. Make sure a folder is open that contains webpage source files that DevTools can map to the file path or URL that the DevTools browser is using.
The DevTools browser uses the URL or file path that you specify any of the various ways:
| Way of opening DevTools | Where the file path or URL is specified |
|---|---|
| Click the Launch Instance button. | The URL or file path that you specify in the DevTools browser's address bar. |
Right-click an .html file. |
The path of the .html file that you right-click. |
| Click the Launch Project button. | The URL or file path that you specify in launch.json. |
If you enter a different URL or file path in the address bar of the DevTools browser, for DevTools to provide automatic CSS mirror editing of local source files, you must also open a folder that contains files that match the webpage (file path or URL) that you specify in the DevTools browser.
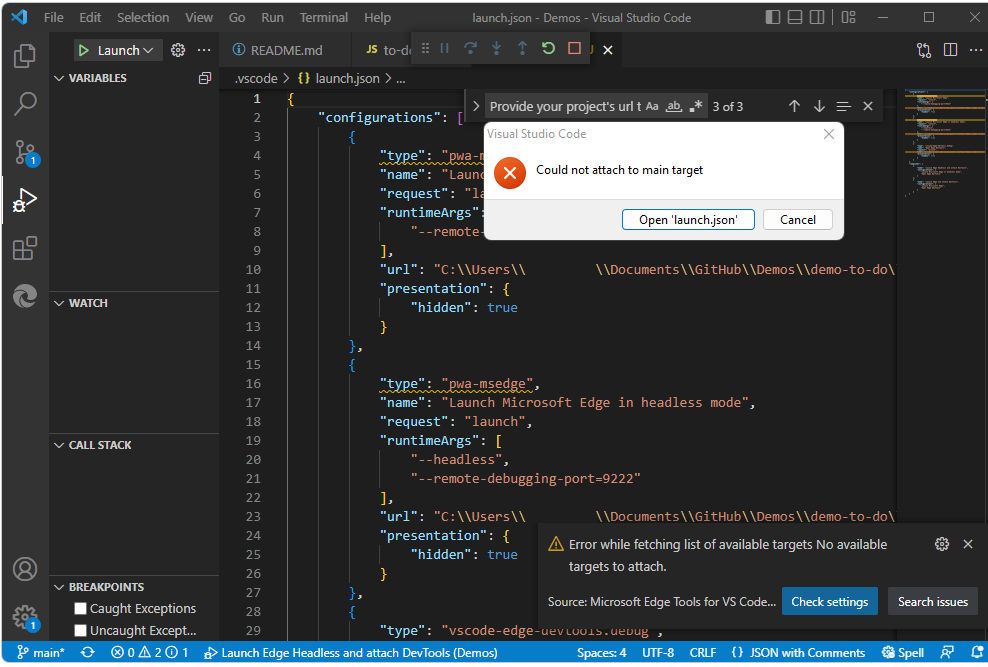
Suppose you click the Launch Instance button, then paste a localhost URL into the address bar, such as http://localhost:8080, but you don't have the local source files folder open. Then in the Styles tab of the Elements tool, try to change a CSS value. Error messages might appear, such as:
Error while mirroring css content to document. Could not mirror css changes to document. No workspace mapping was found.
Unable to open file in editor.
Error while opening file in editor.
Error while fetching.
Could not attach to main target.
Error while fetching list of available targets. No available targets to attach.

If you get errors while trying to point to a file path, instead of using a launch.json file, try right-clicking the .html file instead:

See Opening DevTools and the DevTools browser.
Deleting or re-creating launch.json
In addition to closing a reopening a folder, if you want to reset a project to use with DevTools, you can delete and optionally re-create launch.json. launch.json defines debug configurations.
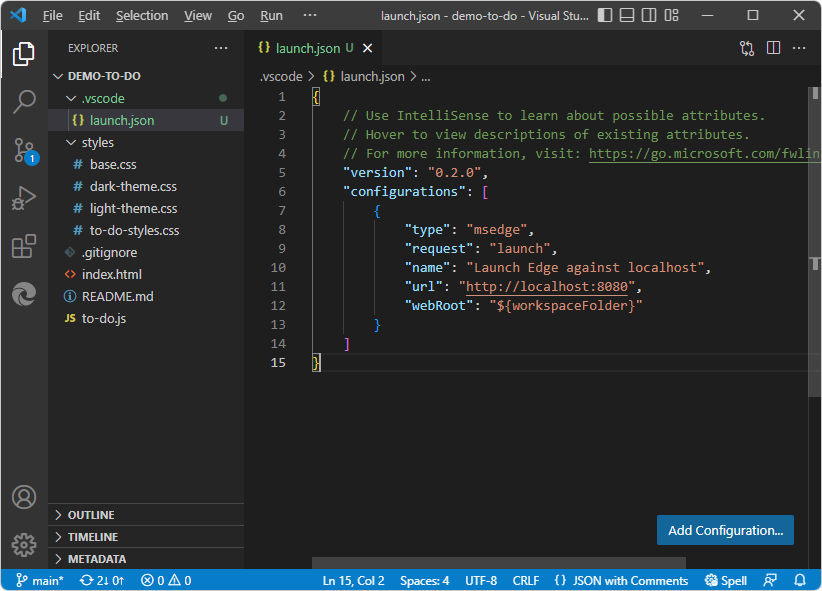
The following launch.json file is too short for the DevTools extension. It was created by Visual Studio Code without using the DevTools extension. The Demos repo doesn't have launch.json in demo-to-do, so you might want to remove the file:

To re-create a fresh launch.json file for DevTools:
Make a backup copy of the
launch.jsonfile.In Visual Studio Code > Activity Bar > Explorer, right-click
launch.json> Delete.Activity Bar > Microsoft Edge Tools now shows a Launch Instance button and a Generate launch.json button.
If you want use a
launch.jsonfile for DevTools, make sure you have the desired folder open in Visual Studio Code > Activity Bar > Explorer, and then click the Generate launch.json button. See Opening DevTools by clicking the Launch Project button in Opening DevTools and the DevTools browser.
launch.json requires well-formed JSON
If Activity Bar > Microsoft Edge Tools contains a Configure launch.json button instead of the expected Launch Project button when a DevTools-generated launch.json file exists in the opened folder, this may be caused by adding a line with a missing comma or empty quotes. Be sure launch.json contains well-formed JSON.