What's New in DevTools (Microsoft Edge 124)
To check out the latest features of Microsoft Edge DevTools and the Microsoft Edge DevTools extension for Microsoft Visual Studio Code and Visual Studio, read these announcements.
To stay up to date and get the latest DevTools features, download an Insiders preview version of Microsoft Edge. Whether you're on Windows, Linux, or macOS, consider using Canary (or another preview channel) as your default development browser. The Beta, Dev, and Canary versions of Microsoft Edge run as separate apps, side-by-side with the stable, released version of Microsoft Edge. See Microsoft Edge Insider Channels.
For the latest announcements, follow the Microsoft Edge team on Twitter. To report a problem with DevTools or ask for a new feature, file an issue in the MicrosoftEdge/DevTools repo.
postMessage events and handlers are distinguished from other events
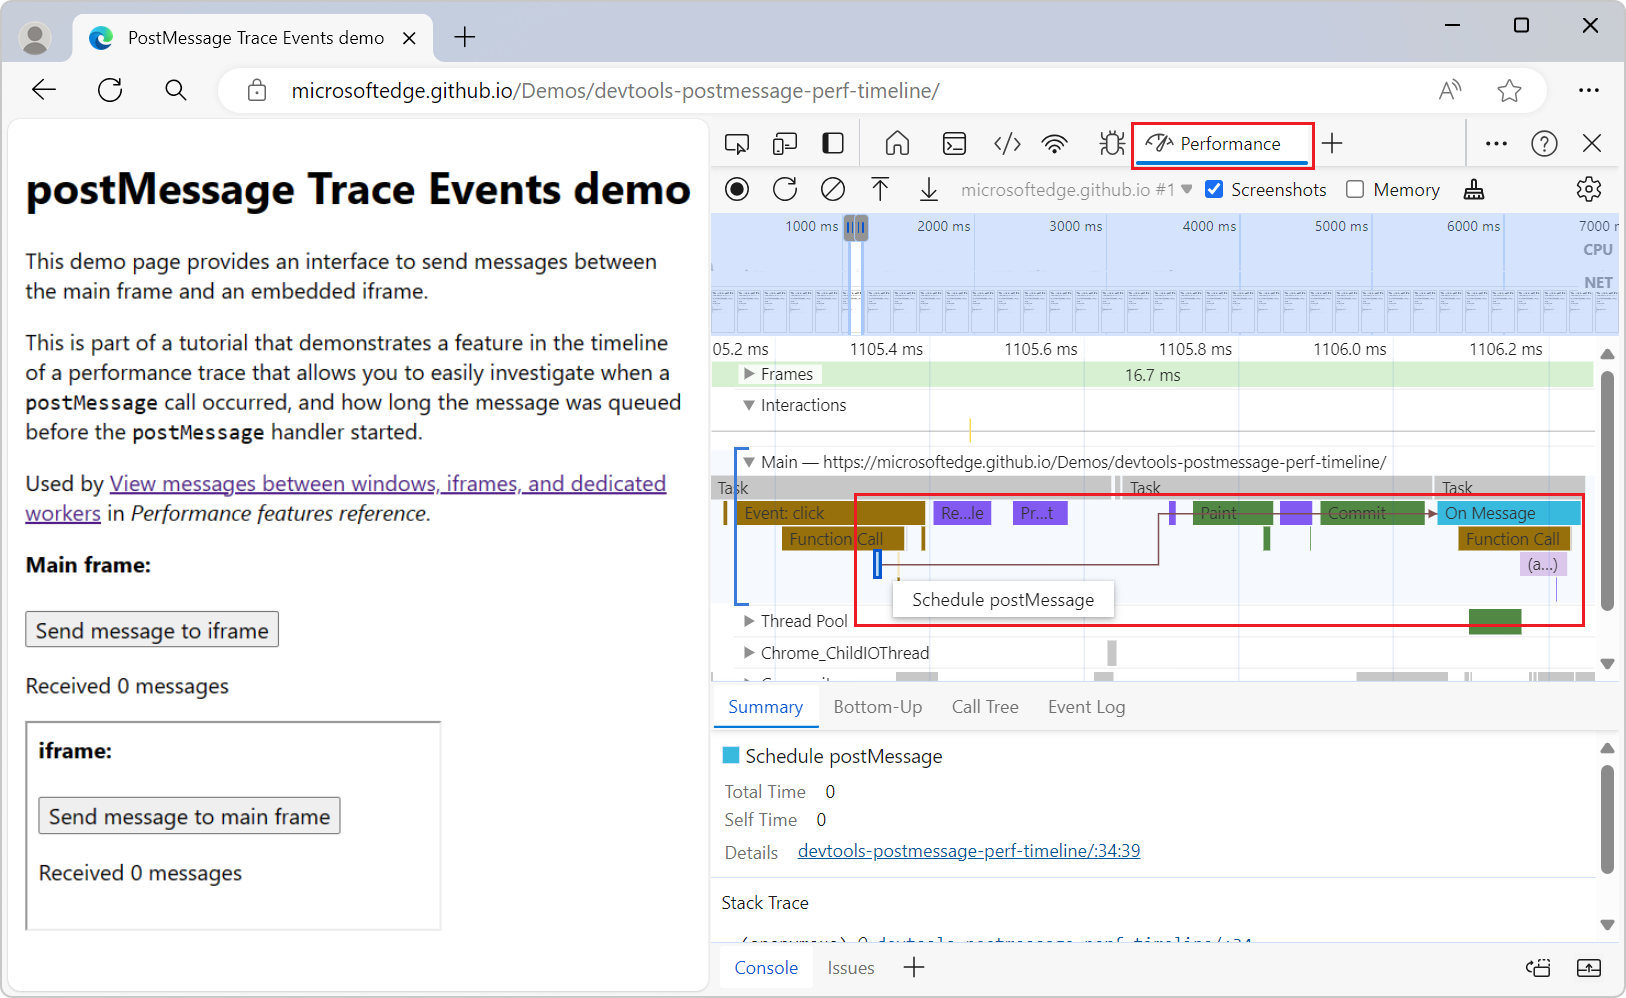
The new experiment Timeline: Show postMessage dispatch and handling flows improves the Performance tool's Main section to help you quickly identify postMessage events and handlers, by distinguishing events that are triggered by the postMessage method from other events that are displayed in the Performance tool. This experiment helps you investigate performance issues that are related to posting messages across various threads of an application, to view messages between windows, iframes, and dedicated workers.
Without this experiment, events that are triggered by dispatching and handling messages between threads of an application appear as generic scripting function-call events. With this experiment enabled:
postMessagedispatch events appear as Schedule postMessage.postMessagehandler events appear as On Message:

This experiment helps you investigate when a postMessage call occurred, and how long the message was queued before the postMessage handler starts. The dispatch events are linked to handler events by initiator arrows that appear when you click on either type of event:

To use this feature, in DevTools, select Customize and control DevTools (![]() ) > Settings > Experiments, select the checkbox Timeline: Show postMessage dispatch and handling flows, click the Close (X) button, and then click the Reload DevTools button.
) > Settings > Experiments, select the checkbox Timeline: Show postMessage dispatch and handling flows, click the Close (X) button, and then click the Reload DevTools button.
See also:
- Performance features reference
- postMessage Trace Events demo (rendered)
- postMessage Trace Events demo (source code)
Move a tab left or right in the Activity bar by right-clicking it
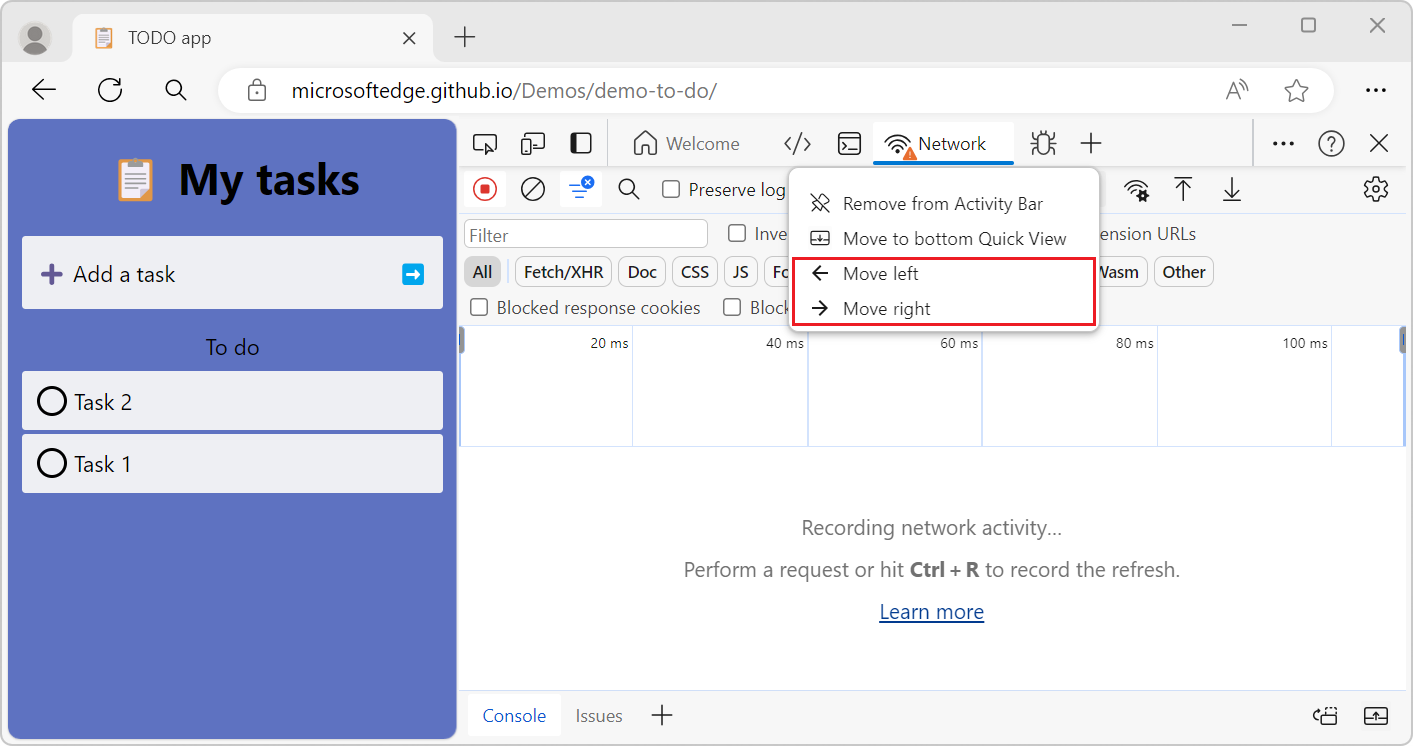
Before Microsoft Edge 124, you could rearrange the tabs in the Activity bar only by dragging them. This can be difficult for users who are using input devices such as a trackball or head pointer. Now, you can also move a tab left or right by right-clicking the tab and then selecting Move left or Move right:

See also:
- Pin and rearrange tools in the Activity Bar in Overview of DevTools.
Network tab shows a warning icon when using overrides or throttling
Recent releases stopped showing a warning icon in the Network tool's tab when using overrides or throttling. This issue has been fixed. When you enable local overrides in the Sources tool, the Network tab now displays a warning icon:
![]()
Also, when you turn on throttling in the Network tool, the Network tab now displays a warning icon:
![]()
See also:
- Override webpage resources with local copies (Overrides tab)
- Emulate slow network connections in Network features reference.
Announcements from the Chromium project
Microsoft Edge 124 also includes the following updates from the Chromium project:
- New Autofill panel
- Enhanced network throttling for WebRTC
- Scroll-driven animations support in the Animations panel
- Improved CSS nesting support in Elements > Styles
- Enhanced Performance panel
- Tooltips for special categories in Memory > Heap snapshots
- Application > Storage updates
- Coverage panel improvements
- JavaScript Profiler deprecation: Phase four, final