How to Add Tracing to IIS 7.0 Managed Modules
by Saad Ladki
Introduction
IIS 7.0 and above features the ability to plug-in and use custom developed managed modules to accomplish many different tasks and use those modules for all sorts of content. However, the question arises: what happens if the module has problems or difficulties? Previously, you used System.Diagnostics to trace the event when problems occurred. Unfortunately, those traces are completely separate from IIS traces.
Not so with IIS 7.0 and above. Now you can add traces to the module code using System.Diagnostics.TraceSource (new to .Net 2.0). You have the ability to route those traces into the IIS tracing infrastructure so that they are available to modules that consume traces--for example, Failed Request Tracing.
The IIS Team encourages instrumenting code using basic patterns such as:
- START & STOP events around key activities within your code
- WARNING & ERROR events for unexpected occurrences that might cause the request to fail (such as failed authentication)
- INFORMATIONAL & VERBOSE events for help with diagnostics, such as module configuration being used
Tasks illustrated in this walkthrough include:
- Adding tracing to the module using System.Diagnostics.TraceSource
- Configuring failed request tracing to capture these traces
- Generating the failure condition and viewing the resulting trace
Prerequisites
Follow the steps below before performing the tasks in this article.
Step 1: Installing IIS
First, IIS must be installed. Check to see if IIS is installed by browsing to http://localhost/. If IIS is installed, you see the "under construction" page. If IIS is not installed, refer to Installing IIS for instructions. Make sure to install the following IIS components:
- ASP (under World Wide Web Services => Application Development Features => ASP)
- ASP.Net (under World Wide Web Services => Application Development Features => ASP.Net)
- Tracing (under World Wide Web Services => Health & Diagnostics => Tracing)
Step 2: Log in as Administrator
Login as is the administrator account or in the Administrators group.
Note
Being in the Administrators group does not grant you complete administrator privileges by default. You must run many applications as Administrator. Right-click the application icon and choose "Run as Administrator".
Step 3: Make a Backup
Make a backup of the configuration before executing the tasks in this article. Run the following:
Click the Start button -> All Programs -> Accessories -> (r-click)Command Prompt -> Run as Administrator
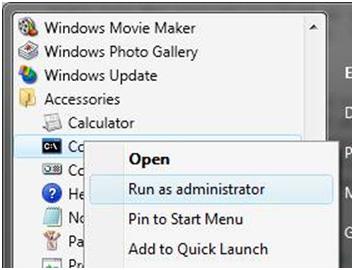
Execute the following command in that command prompt:
%windir%\system32\inetsrv\appcmd add backup
Step 4 : Creating Sample Content
- Delete everything in the
c:\inetpub\wwwrootfolder. - From the Administrator command prompt started above, paste the attached code into a file in inetpub\wwwroot called test.htm:
<h2>HOWTO: Adding tracing to modules </h2>
This is a sample page served by the static file handler (native code).
Creating & Tracing a Simple Module
In this section, you create a sample module to instrument.
Step 1: Create a Simple Module
Using the Administrator command prompt, copy and paste the following code into a file called IIS_MOD_REQDATA.cs:
using System;
using System.Collections.Generic;
using System.Text;
using System.Web;

namespace IIS_MOD_REQDATA
{
    public class IIS_MOD_REQDATA : IHttpModule
    {
        public void Init(HttpApplication application)
        {
            application.EndRequest += (new EventHandler(this.Application_EndRequest));
        }

        private void Application_EndRequest(Object source, EventArgs e)
        {
            HttpApplication application = (HttpApplication)source;
            HttpContext context = application.Context;

            // start writing out the request data

            context.Response.Write("<hr>");
            context.Response.Write("<b><font size=2 color=green>REQUEST HEADERS</font></b><br>");
            context.Response.Write("<font size=2>");
            context.Response.Write("METHOD : " + context.Request.HttpMethod + "<br>");
            context.Response.Write("URL : " + context.Request.Url + "<br>");
            context.Response.Write("QUERYSTRING : " + context.Request.QueryString + "<br>");
            context.Response.Write("</font><br>");

            // now response data

            context.Response.Write("<b><font size=2 color=blue>RESPONSE HEADERS</font></b><br>");
            context.Response.Write("<font size=2>");
            context.Response.Write("STATUS CODE : " + context.Response.StatusCode.ToString() + "." + context.Response.SubStatusCode.ToString() + "<br>");
            context.Response.Write("CONTENT TYPE : " + context.Response.ContentType.ToString() + "<br>");
            context.Response.Write("EXPIRES : " + context.Response.Expires.ToString() + "<br>");
            context.Response.Write("</font><br>");

            // set cache policy on response so it's not cached.

            context.Response.DisableKernelCache();
        }

        public void Dispose()
        {
        }
    }
}
Step 2: Adding Tracing to the Managed Module
In order to add tracing to your module and route its trace events into IIS, use System.Diagnostics.Trace source. Add the following line under the using statements:
using System.Diagnostics;
You must create a TraceSource within the code – notice the definition of the traceSource within the declaration of the IIS_MOD_REQDATA module:
public class IIS_MOD_REQDATA : IHttpModule
{
    TraceSource tsStatus;
The tsStatus member is initialized during the IHttpModule's Init() method:
public void Init(HttpApplication application)
{
    application.EndRequest += (new EventHandler(this.Application_EndRequest));
    // setup traceSource
    tsStatus = new TraceSource("tsStatus");
}
The name of the TraceSource ("tsStatus") is important, as this name is later referenced in the web.config file later. The module is now setup to emit events if needed.
To add a new trace event, use tsStatus.TraceEvent(<type>, 0, <somestring>) to write out events. Add the recommended Start & End events to the Application_EndRequest() method:
private void Application_EndRequest(Object source, EventArgs e)
{
    tsStatus.TraceEvent(TraceEventType.Start, 0, "[REQDATA MODULE] START EndRequest");

    // other code

    tsStatus.TraceEvent(TraceEventType.Stop, 0, "[REQDATA MODULE] END EndRequest");
}
Notice the different <type>'s – the types supported, among others, include:
- TraceEventType.Start
- TraceEventType.Stop
- TraceEventType.Error
- TraceEventType.Warning
- TraceEventType.Information
- TraceEventType.Verbose
For completeness, the entire source for the module (including the trace events), can be copied from here:
using System;
using System.Collections.Generic;
using System.Text;
using System.Web;
using System.Diagnostics;

namespace IIS_MOD_REQDATA
{
    public class IIS_MOD_REQDATA : IHttpModule
    {

        TraceSource tsStatus;

        public void Init(HttpApplication application)
        {
            application.EndRequest += (new EventHandler(this.Application_EndRequest));

            // TRACING

            tsStatus = new TraceSource("tsStatus");
        }

        private void Application_EndRequest(Object source, EventArgs e)
        {
            HttpApplication application = (HttpApplication)source;
            HttpContext context = application.Context;

            tsStatus.TraceEvent(TraceEventType.Start, 0, "[REQDATA MODULE] START EndRequest");

            // start writing out the request data

            context.Response.Write("<hr>");
            context.Response.Write("<b><font size=2 color=green>REQUEST HEADERS</font></b><br>");
            context.Response.Write("<font size=2>");
            context.Response.Write("METHOD : " + context.Request.HttpMethod + "<br>");
            context.Response.Write("URL : " + context.Request.Url + "<br>");
            context.Response.Write("QUERYSTRING : " + context.Request.QueryString + "<br>");
            context.Response.Write("</font><br>");

            tsStatus.TraceEvent(TraceEventType.Verbose, 0, "[REQDATA MODULE] done with Req Data, moving onto Response");

            // now response data

            context.Response.Write("<b><font size=2 color=blue>RESPONSE HEADERS</font></b><br>");
            context.Response.Write("<font size=2>");
            context.Response.Write("STATUS CODE : " + context.Response.StatusCode.ToString() + "." + context.Response.SubStatusCode.ToString() + "<br>");
            context.Response.Write("CONTENT TYPE : " + context.Response.ContentType.ToString() + "<br>");
            context.Response.Write("EXPIRES : " + context.Response.Expires.ToString() + "<br>");
            context.Response.Write("</font><br>");

            if (context.Response.StatusCode > 399)
            {
                tsStatus.TraceEvent(TraceEventType.Warning, 0, "[REQDATA MODULE] error status code detected");
            }

            tsStatus.TraceEvent(TraceEventType.Verbose, 0, "[REQDATA MODULE] done with Response Data");

            // set cache policy on response so it's not cached.

            context.Response.DisableKernelCache();
            tsStatus.TraceEvent(TraceEventType.Verbose, 0, "[REQDATA MODULE] cache setting is (" + context.Response.Cache.ToString() + ")");

            tsStatus.TraceEvent(TraceEventType.Stop, 0, "[REQDATA MODULE] STOP - EndRequest");
        }

        public void Dispose()
        {
        }
    }
}
Step 3: Compiling Our Traced Module
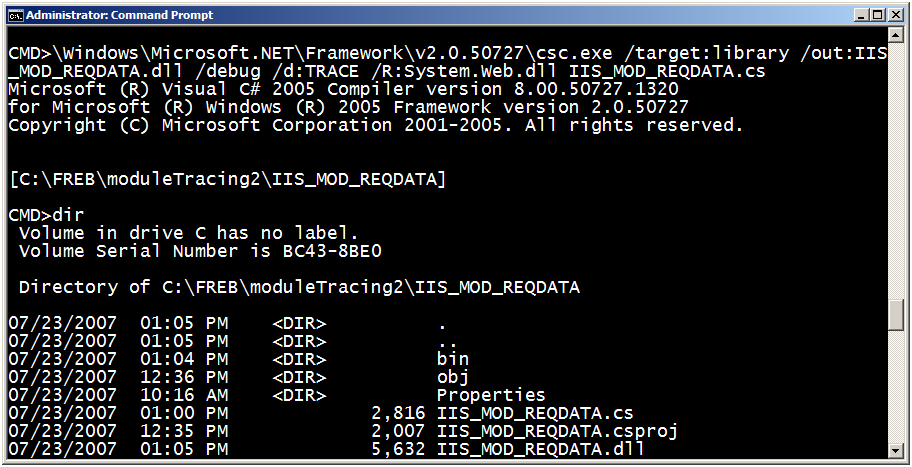
Now to compile the module & deploy it. In the Administrator command prompt, run the following command:
%systemroot%\Microsoft.NET\Framework\v2.0.50727\csc.exe /target:library /out:IIS_MOD_REQDATA.dll /debug /d:TRACE /R:System.Web.dll IIS_MOD_REQDATA.cs
Note
If you are running this on a 64bit system, compile using the 64bit c# compiler in %windir%\microsoft.net\framework64\v2.0.50727\csc.exe
Note the use of the /debug & /d:TRACE switches. You must use these switches to compile the trace events into the binary. Failing to compile with these switches means that the module will not have any trace events in it.
Having compiled the module, deploy the module and run an initial test to see if the module works before capturing its traces.
Adding Modules to the Site's Configuration
This section includes adding and testing the module.
Step 1 : Adding the Module to the Site's Configuration
- Using the same Administrator command prompt, make a directory called \inetpub\wwwroot\bin, then copy IIS_MOD_REQDATA.dll over to that directory.
- Enable the module. From the administrator command prompt, type start inetmgr to bring up the IIS administration UI.
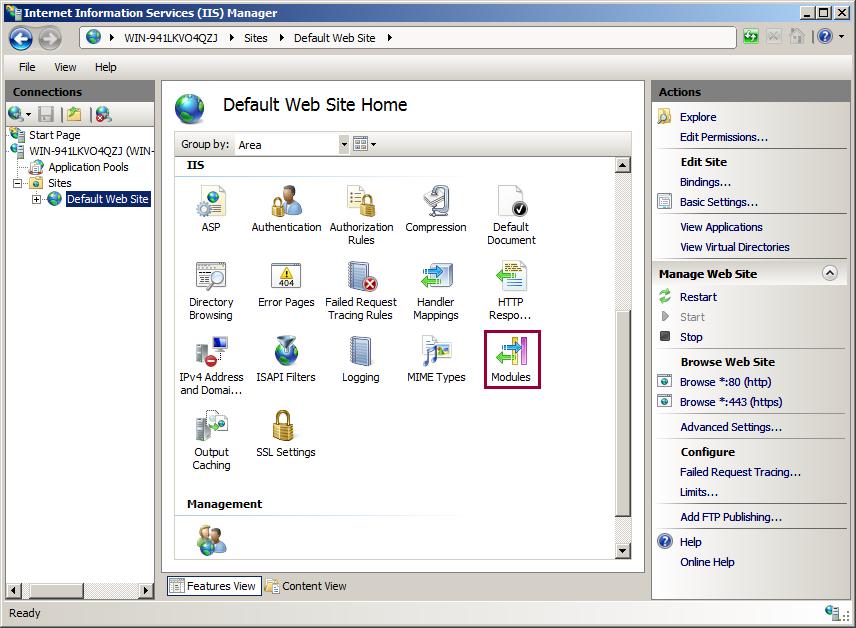
- Under the Connections pane, expand the local machine name, then Sites, and click on Default Web Site.
- Under IIS in the center pane, double-click on Modules:
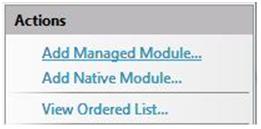
- You see a large list of modules configured for use by this site. On the right side of the UI under Actions, click Add Managed Module:
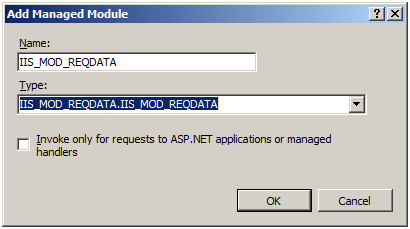
- In the window that displays, name the managed module IIS_MOD_REQDATA and the type of the module is IIS_MOD_REQDATA.IIS_MOD_REQDATA(select this from the dropdown list box):
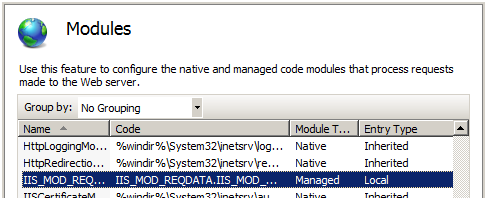
- Click OK. The newly traced module is now configured for the web site's use.
Step 2 : Testing Our Module
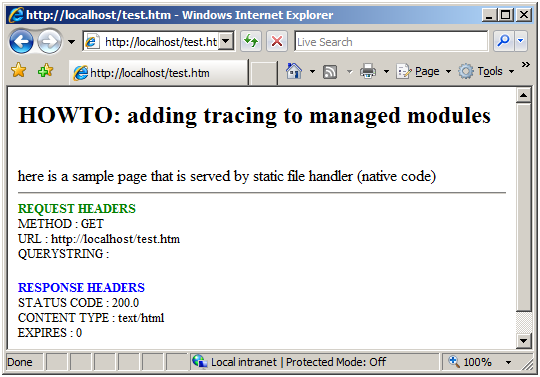
Test the module by opening Internet Explorer and browsing to http://localhost/test.htm. You see the following window:
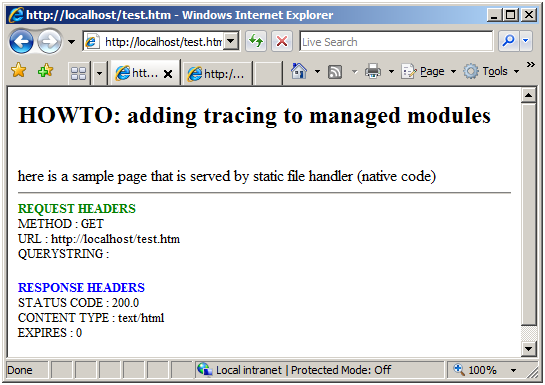
The "REQUEST HEADERS" & "RESPONSE HEADERS" content came from our module, indicating that is works.
Routing Events to IIS
This task hooks the Module's TraceSource up to IIS tracing so that its events are emitted through IIS and then configure Failure Request Tracing to capture these trace events.
Step 1 : Enabling the Module TraceSource & Routing Its Events into IIS
The module is updated to include trace events. Configure System.Diagnostics and IIS to capture these trace events and route them into IIS's Failed Request Tracing module. Do this by configuring the <system.diagnostics> section in the web.config file to setup the TraceSource & route its events accordingly.
Using your Administrator command prompt, navigate to
c:\inetpub\wwwroot, and use notepad to edit your web.config file.There are 3 parts of the configuration that must be completed to get the events emitted by the module to be routed to IIS's tracing infrastructure:
- Defining the IIS event traceListener as a shared Listener
- Defining a switch to enable all the events
- Defining the trace source, attaching the switch we defined as well as defining the trace listener for our source.
IIS ships a new System.Diagnostics.TraceListener used to route TraceSource events into IIS's Trace infrastructure. This provider must also be defined in your web.config file.
Define the traceSource by its name (tsStatus) and wire it up to the DefaultSwitch & IisTraceListener.
Copy and paste this <system.Diagnostics> section into your web.config file (after your
<system.webServer>section).<system.diagnostics> <sharedListeners> <add name="IisTraceListener" type="System.Web.IisTraceListener, System.Web, Version=2.0.0.0, Culture=neutral, PublicKeyToken=b03f5f7f11d50a3a" /> </sharedListeners> <switches> <add name="DefaultSwitch" value="All" /> </switches> <sources> <source name="tsStatus" switchName="DefaultSwitch"> <listeners> <add name="IisTraceListener" type="System.Web.IisTraceListener, System.Web, Version=2.0.0.0, Culture=neutral, PublicKeyToken=b03f5f7f11d50a3a" /> </listeners> </source> </sources> </system.diagnostics>
The tsStatus traceSource is wired up to the IIS7TraceListener, which will emit events into IIS's tracing infrastructure. Continue to the next step to wire those events up to the Failed Request Tracing provider.
Step 2 : Enabling Failed Request Tracing to Capture Module Trace Events
When these diagnostics events are emitted into IIS's tracing infrastructure, they are mapped to the ASP.net Provider & the Module flag on that provider. Their verbosity depends on the TraceEventType used. To configure Failed Request Tracing to pick these up:
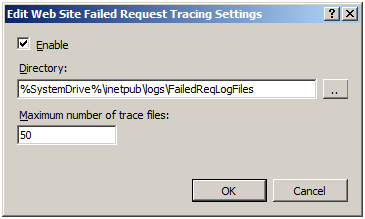
From your Administrator command prompt, type start inetmgr. In the Connections panel, expand the machine name, then Sites folder, then click on the Default Web Site. To the right under the Actions pane, click on Failed Request Tracing… link under Configure:
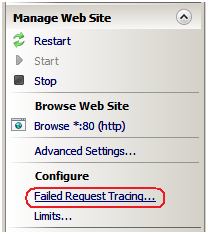
Check the Enable check box. Keep the defaults for the other settings. Click OK to continue.
Now that we have verified that Failed Request Tracing Logging is enabled, we must configure the failure definitions. Back in the IIS Manager, under IIS, double-click on Failed Request Tracing Rules
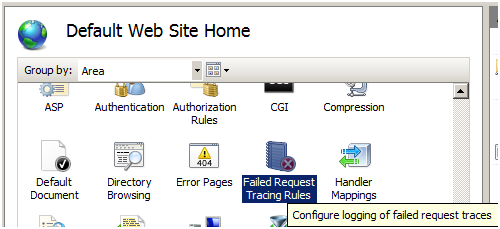
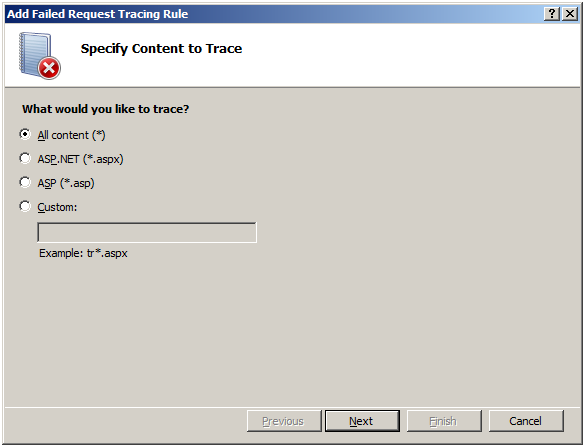
In the Actions pane, click Add…. This launches the Add Failed Request Tracing Rule wizard.
On the Specify Content to Trace page, select the All Content (*) option for what to trace. Click Next.
In the Define Trace Conditions screen, check the Status Codes check box & enter "200" as the status code to trace.
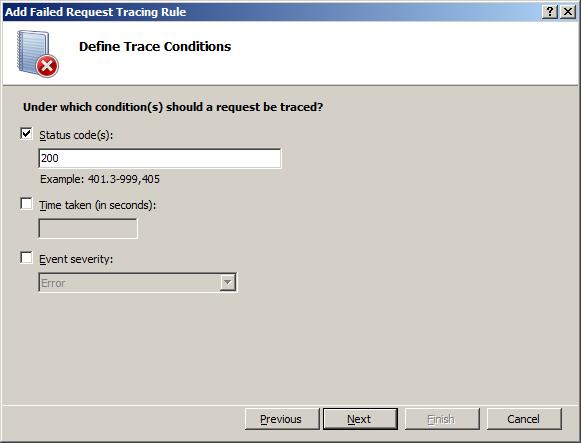
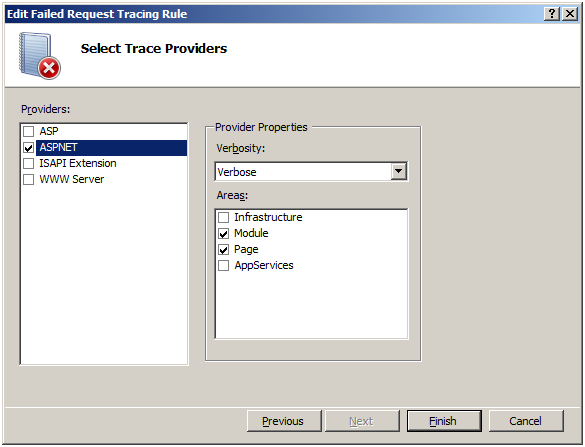
Click Next. The Select Trace Providers page appears. Select the ASPNET check box and the Module & Page check boxes under "Areas". Under Verbosity, select Verbose.
Note
Due to a bug in Server Beta 3 builds, module traces can only be captured if both Module and Page areas are selected. Post Server Beta 3, only Module is required to collect these events.
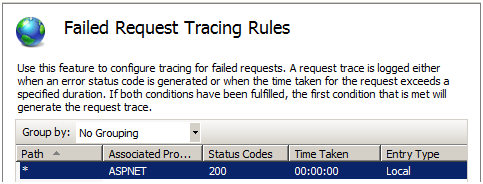
Click Finish. You see the following definition for the Default Web Site:
Testing and Viewing the Results
In this task, we generate the failed request and view the resulting trace log. Remember, we configured IIS to capture trace logs for http://localhost/* requests that fail with a 200. To verify that it worked:
- Open a new Internet Explorer window. Type in the address
http://localhost/test.htm. Again, you see the following:
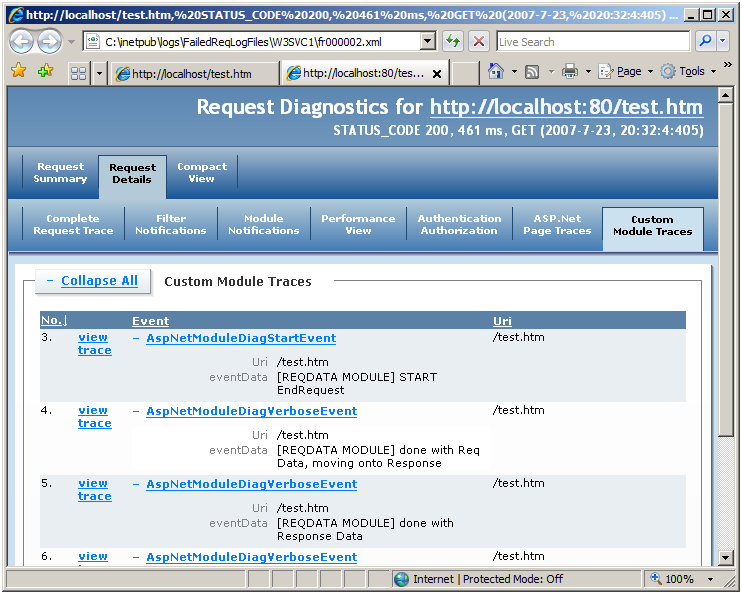
- To verify our module has generated traces that have been captured, use an Administrator-elevated Internet Explorer window and hit CTRL-O, then navigate to
c:\inetpub\logs\FailedReqLogFiles\W3SVC1. In the dropdown list box that reads HTML Files, select All Files. - Select the most recent fr######.xml file (today's date) and click Open. You see the events:
Summary
You finished adding a new trace event to a managed module, compiled and deployed that module, configured System.Diagnostics to route its events to IIS's tracing infrastructure, and finally, configured IIS's Failed Request Tracing feature to capture its events. You can now easily add new events to the module, then recompile the module & deploy it to the \bin directory. Using Failed Request Tracing, you see the results of the events.
Remember that using System.Diagnostics.TraceSource allows you to still use your module and its trace events down level, provided you hook it up to a different trace Listener.
