Floating threads
Use this topic to learn how to find threads that are floating between cores. Critical processes can be stalled by threads floating between cores.
A thread's affinity dictates which CPU cores the OS can schedule the thread to execute on. By default, a thread can be scheduled to execute on any CPU core. When a thread is switched out, it could be scheduled to run on a different CPU core when it's switched back in (that is, when it floats to another core). In some cases this behavior is preferable because it can help load-balance tasks and keep threads from waiting when other cores are available. However, this can negatively affect the performance your title. Consider the following examples.
- A thread can float to a title-critical core. For example, if the title locked the render thread to core 1, a worker thread could float to core 1, and then stall the render thread.
- The cache will almost always have the wrong data in it. This in turn causes a large number of cache misses.
PIX
You can easily determine whether a thread is floating between cores in PIX. The thread timelines show you which core each thread is executing on for each event.
To use PIX to determine whether a thread is floating between cores
Create a Timing Capture. For more information, see Common steps.
On the thread timelines, zoom in to a section that you suspect might be causing a problem. For an example, see figure 1.
Notice that there are two horizontal lines on the timeline for each thread. The lower line represents active PIX events. The upper line represents the CPU core that the thread is running on.
Figure 1. A zoomed-in view of PIX thread timelines that shows thread 836 floating between cores
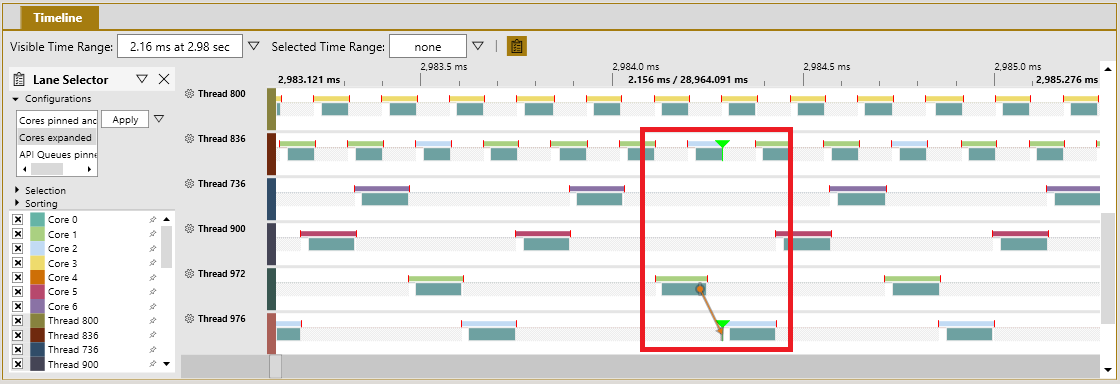
Consider thread 836 in figure 1. Notice that it's running on both the green core (core 1) and the light-blue core (core 2). Move your mouse over any of the upper event lines to highlight the section, and it displays a pop-up window that tells you which core it represents.
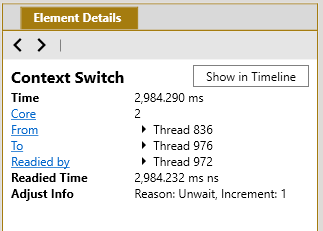
Notice that thread 836 is floating between cores 1 and 2—upon which threads 972 and 976 are already executing (see figure 2). Look at the selected context switch with the arrow. Notice that thread 976 was readied by thread 972 at the end of its task. However, thread 976 has its affinity set to run only on core 2. Therefore, it had to be switched in 58 μs later from 836 (which was occupying core 2 at the time). While this is a trivial example, it demonstrates how floating threads can affect the performance of other threads.
Figure 2. The element details for the context switch that was selected in figure 1
Windows Performance Analyzer (WPA)
In WPA, the CPU Usage (Precise) Timeline by Process, Thread window (which is part of the ThreadFloating.wpaProfile WPA profile) provides all the information that you need to determine whether any of your title threads float between cores.
To use WPA to find floating threads
Generate an event trace log (ETL) file. For details, see Common steps.
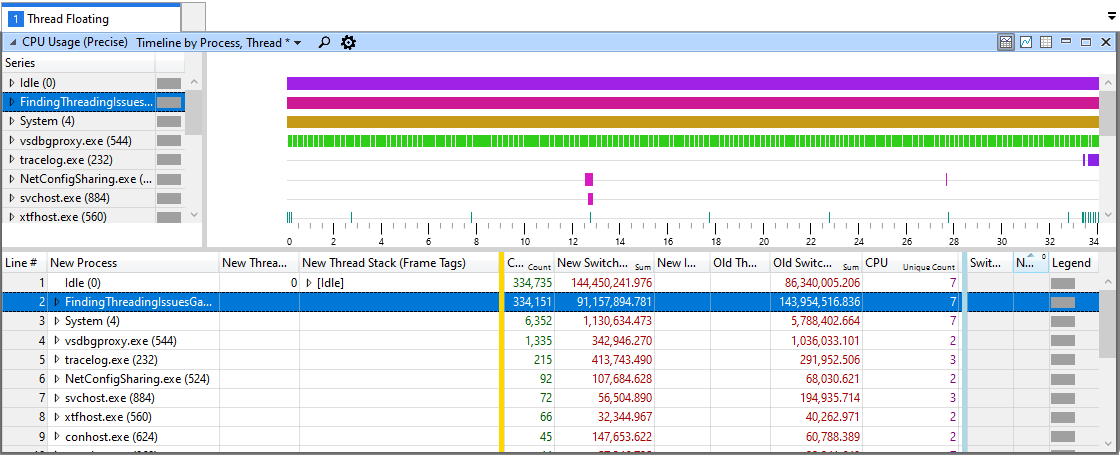
Apply the
ThreadFloating.wpaProfileWPA profile, as explained in Common steps. Figure 3 shows what the new analysis tab looks like.Figure 3. Default view of the ThreadFloating WPA profile
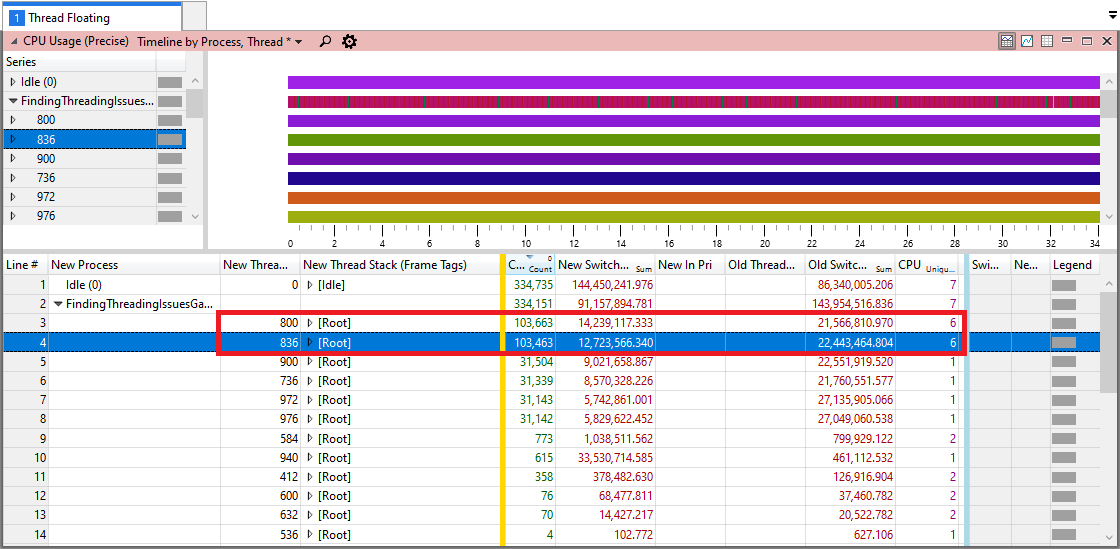
With this WPA profile, the CPU column has been set to show the Unique Count for each line (see figure 4). This shows you the number of unique CPU values that ETL events reported for that process and thread. Any value above one means that the thread floated between CPU cores at least once during the visible time frame.
Figure 4. Focusing on unique CPU values for threads, threads 800 and 836 are running on six different cores
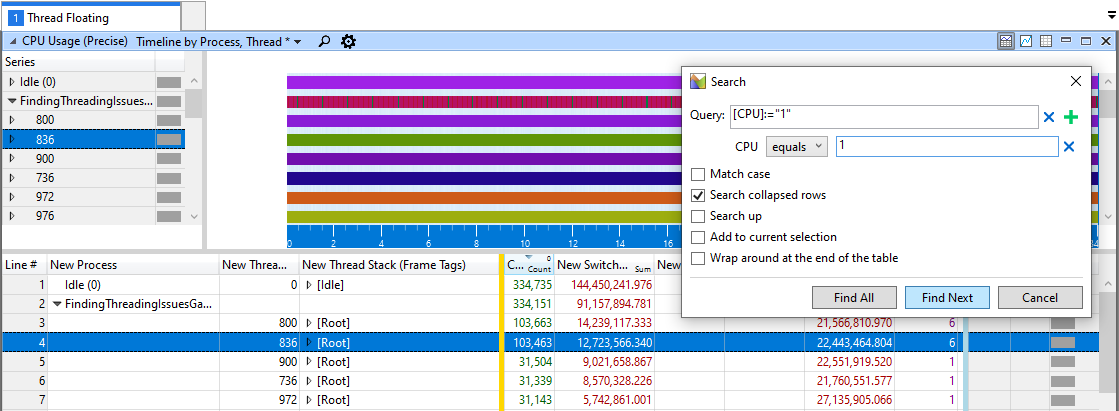
Find threads floating onto a critical core. To do so, right-click the CPU column, and then select Find In Column.... This searches for all threads that are floating to that particular core.
Figure 5. Using the Search feature to locate all threads that were running on core 1 during the capture