Real-Time Intelligence tutorial part 6: Create a Power BI report
Note
This tutorial is part of a series. For the previous section, see: Tutorial part 5: Create a Real-Time dashboard.
A Power BI report is a multi-perspective view into a semantic model, with visuals that represent findings and insights from that semantic model. In this section, you use a KQL query output to create a new Power BI report.
Build a Power BI report
Browse to the KQL database you created in a previous step, named Tutorial.
In the object tree, under the KQL database name, select the query workspace called Tutorial_queryset.
Copy and paste the following query into the query editor. The output of this query is used as the semantic model for building the Power BI report.
RawData
| summarize arg_max(Timestamp, No_Bikes,  No_Empty_Docks, Neighbourhood, Lat=todouble(Latitude), Lon=todouble(Longitude)) by BikepointID
Select Create Power BI report. The Power BI report editor opens with the query result available as a data source named Kusto Query Result.
Add visualizations to the report
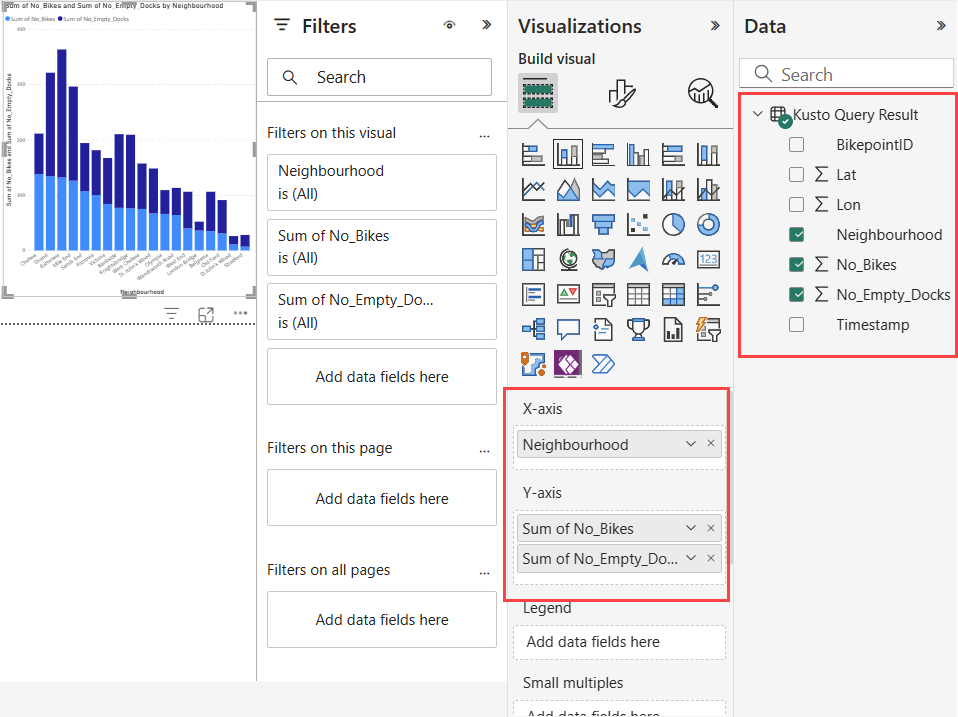
In the report editor, select Visualizations > Stacked column chart icon.

Drag the following fields from Data > Kusto Query Result to the Visualizations pane.
- Neighbourhood > X-axis
- No_Bikes > Y-axis
- No_Empty_Docks > Y-axis
Save the report
- In the top left corner of the ribbon, select File > Save.
- Enter the name TutuorialReport. Choose your workspace, and set sensitivity as Public.
- Select Continue.
- Select Open the file in Power BI to view, edit, and get a shareable link.
Related content
For more information about tasks performed in this tutorial, see:
