How to monitor data pipeline runs in Microsoft Fabric
In this how-to guide, you learn the different ways to review and monitor your pipeline runs.
Monitor data pipeline runs
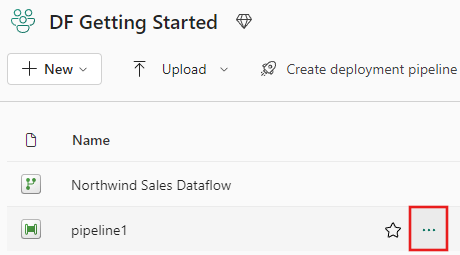
To monitor your data pipeline runs, hover over your pipeline in your workspace. Doing so brings up three dots to the right of your pipeline name.
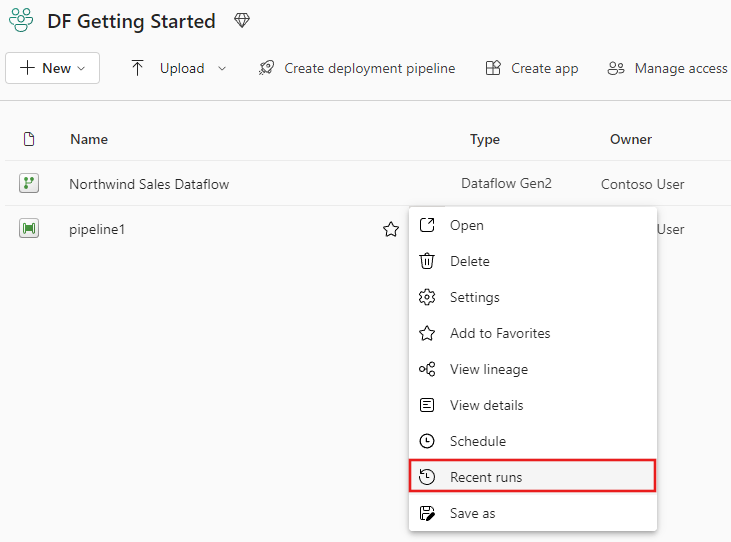
Select the three dots to find a list of options. Then select View run history. This action opens a fly-out on the right side of your screen with all your recent runs and run statuses.
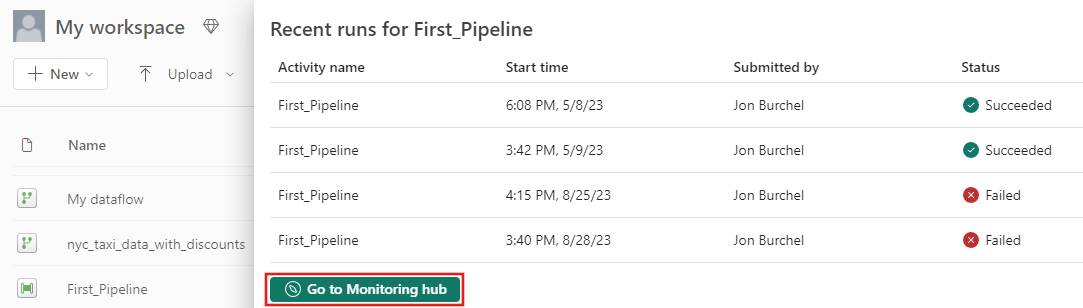
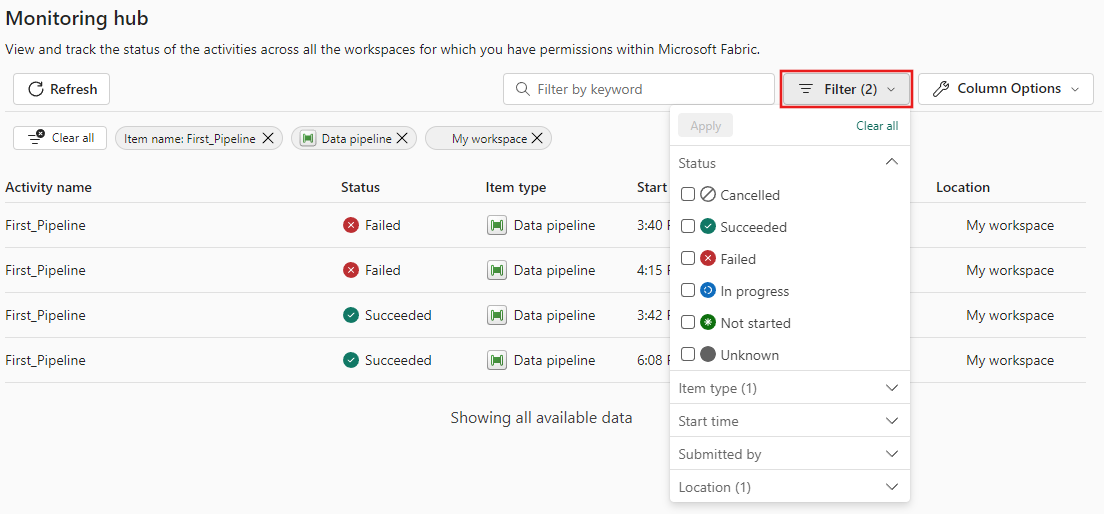
Select Go to monitoring hub from the prior screenshot to view more details and filter results. Use the filter to find specific data pipeline runs based on several criteria.
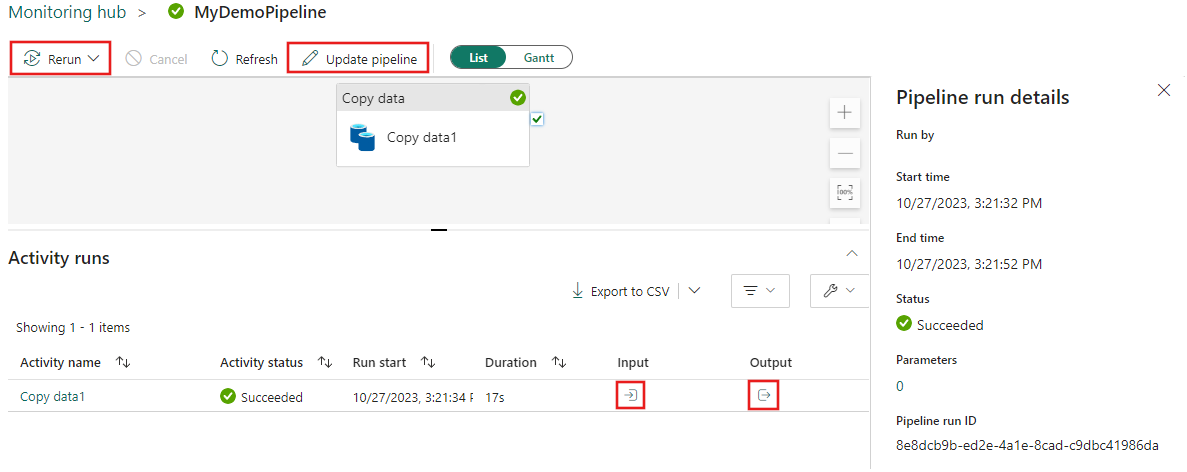
Select one of your pipeline runs to view detailed information. You're able to view what your pipeline looks like and view more properties like Run ID or errors if your pipeline run failed.
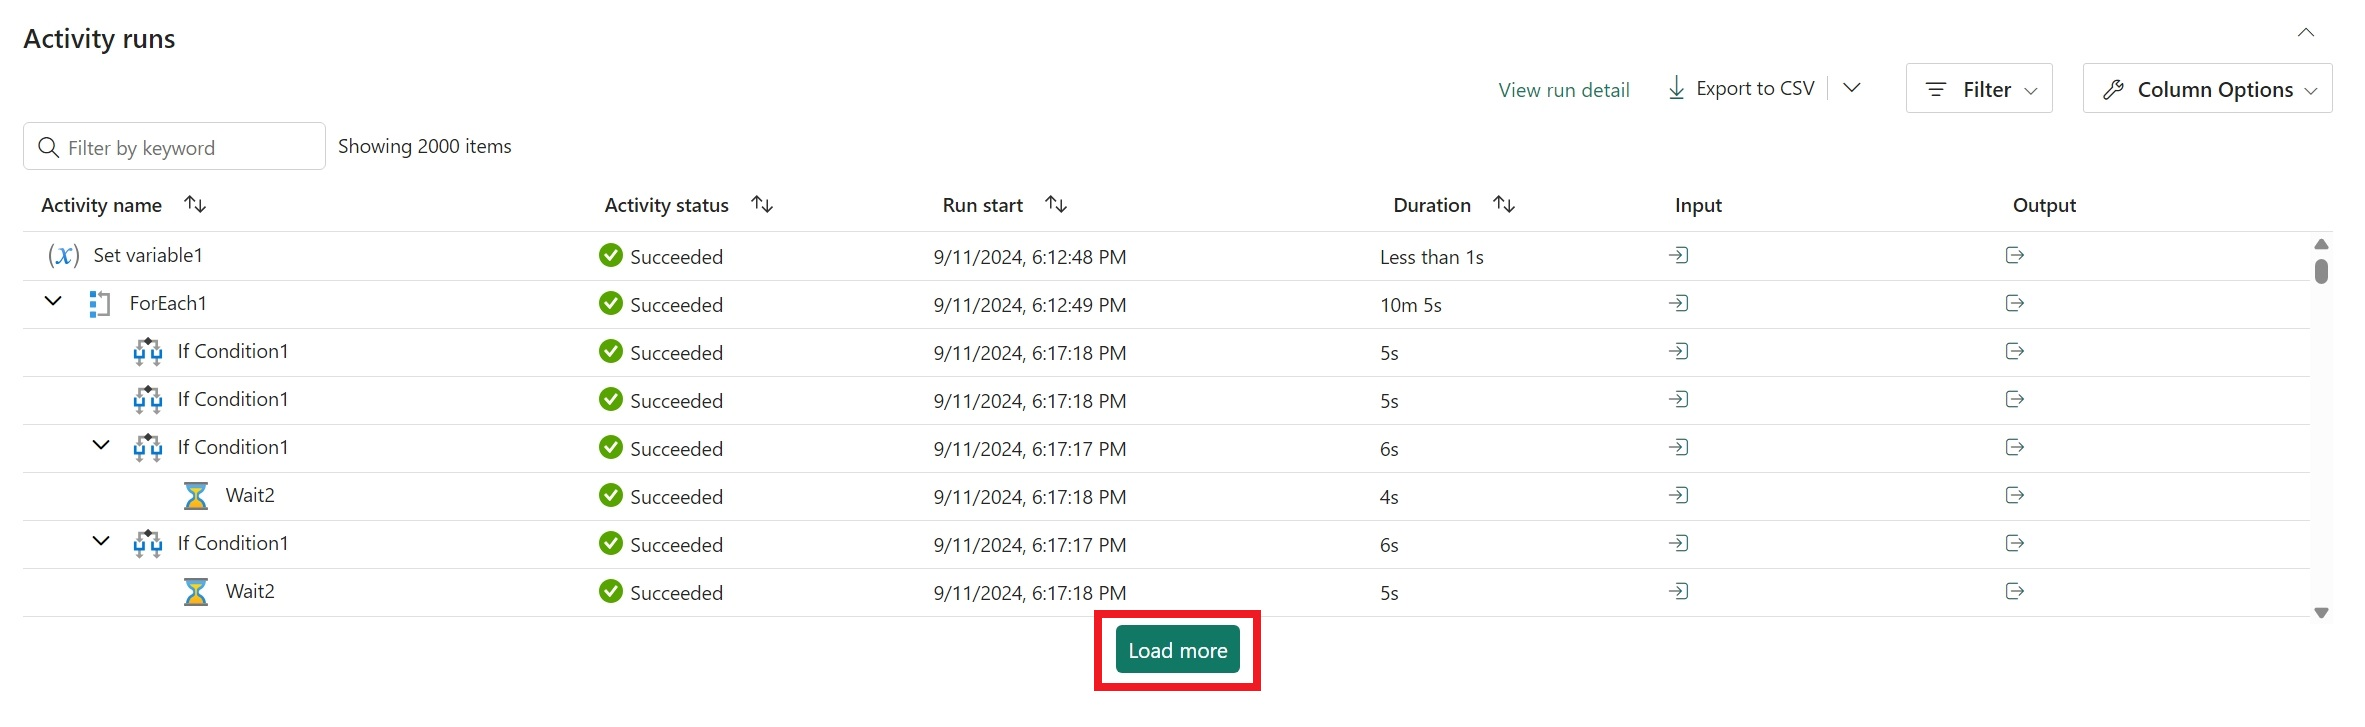
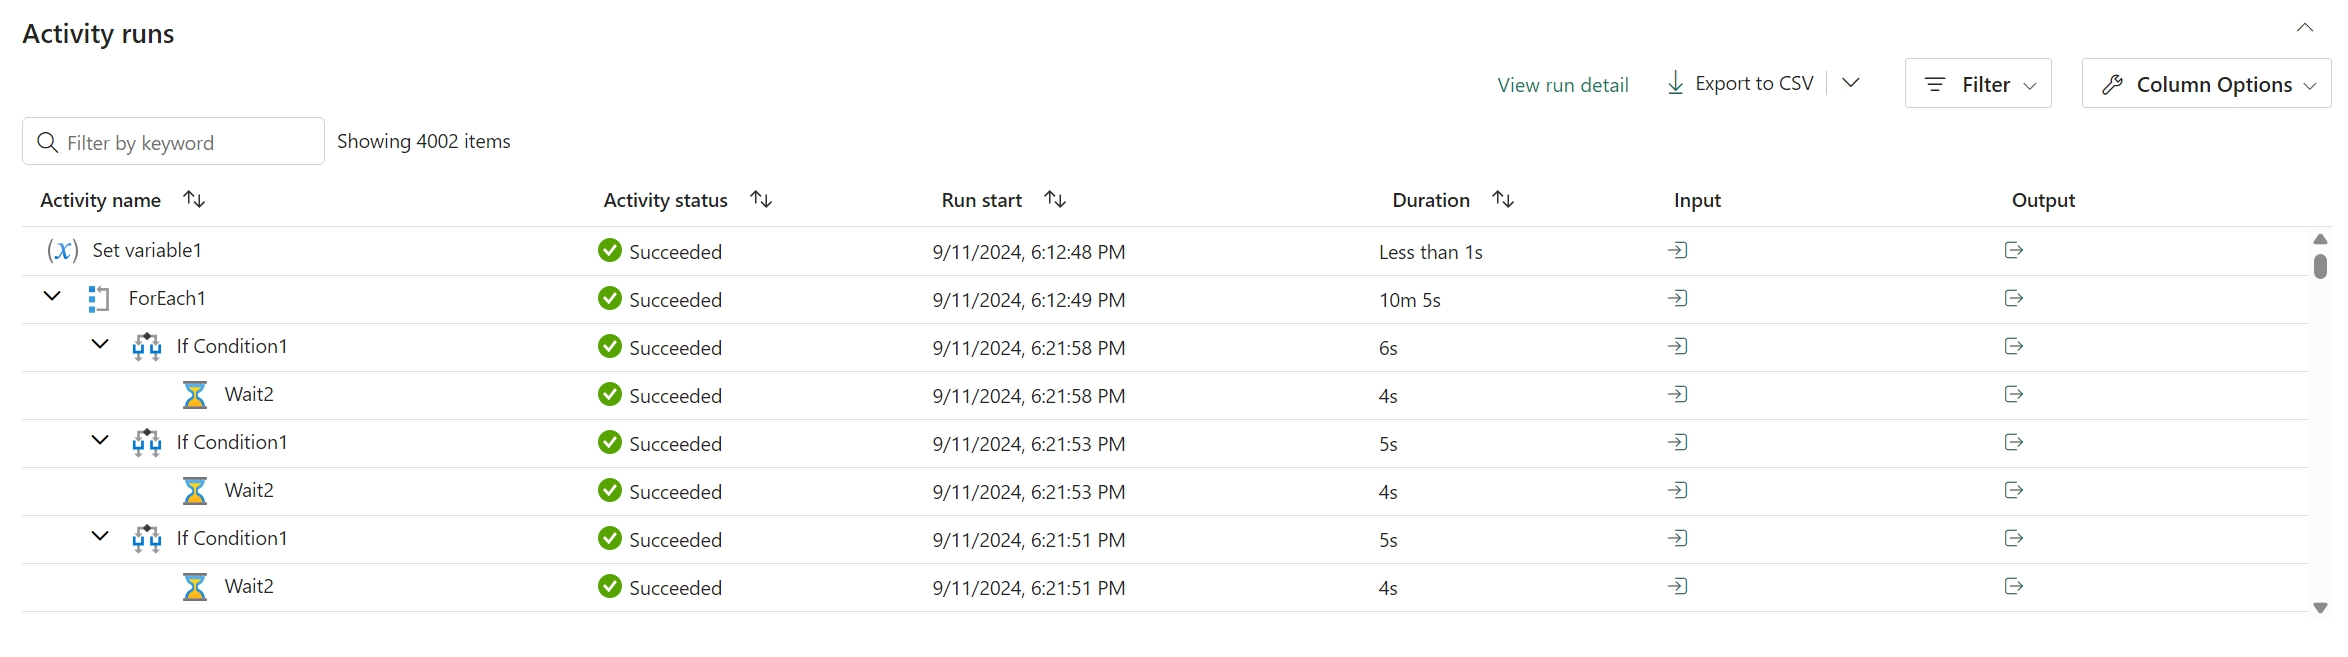
If you have greater than 2000 activity runs in your pipelines, select Load more to see more results in the same monitoring page.
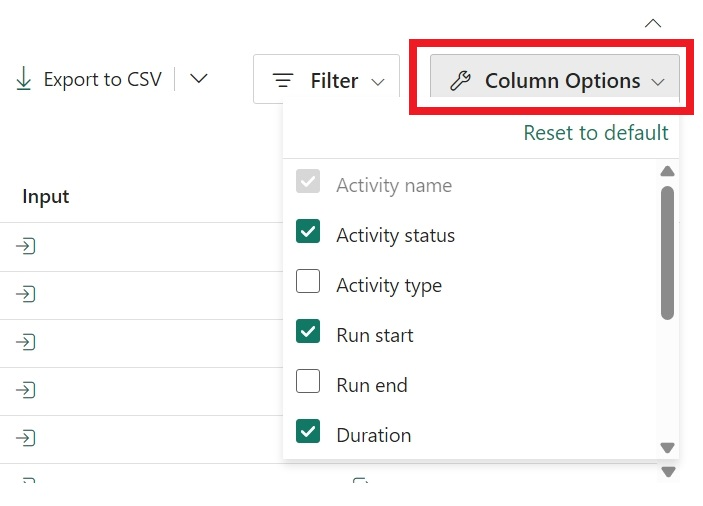
Use the Filter to filter by activity status or Column Options to edit the columns viewed in the monitoring view.
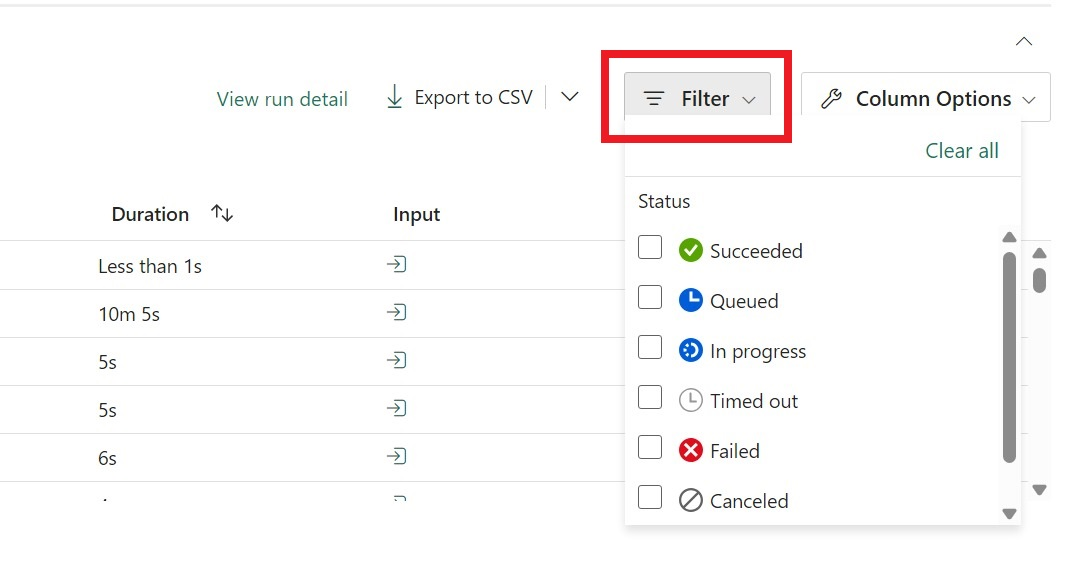
You can also search for an activity name, activity type, or activity run ID with the Filter by keyword box.


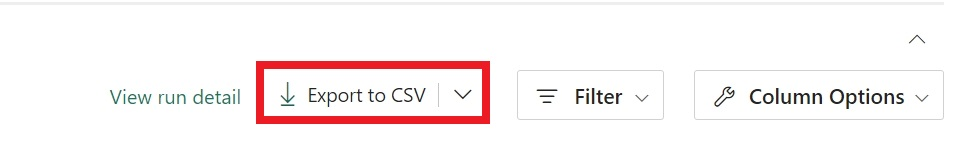
If you want to export your monitoring data, select Export to CSV.
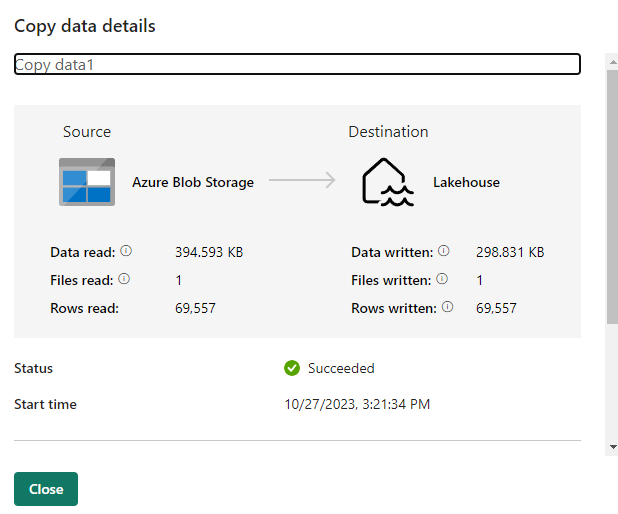
To find additional information on your pipeline runs Input and Output, select the input or output links to the right of the relevant row in the Activity Runs.
You can select Update pipeline to make changes to your pipeline from this screen. This selection takes you back to the pipeline canvas.
You can also Rerun your data pipeline. You can choose to rerun the entire pipeline or only rerun the pipeline from the failed activity.
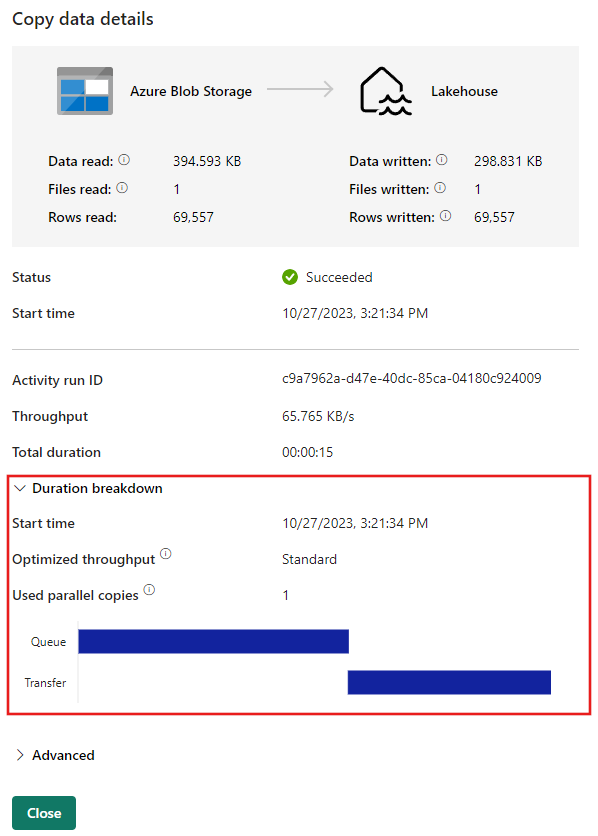
To view performance details, select an activity from the list of Activity Runs. Performance details pop up.
More details can be found under Duration breakdown and Advanced.
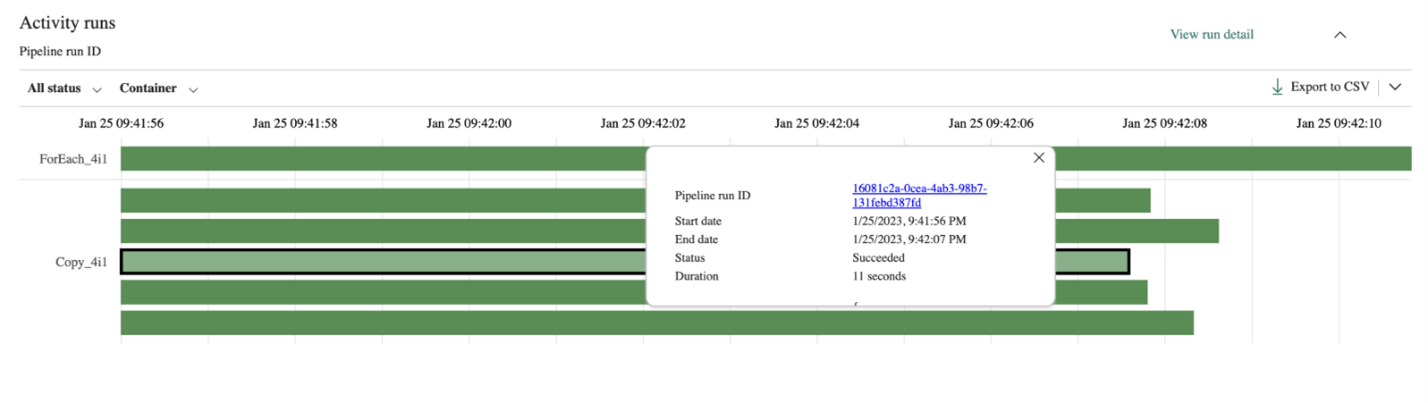
Gantt view
A Gantt chart is a view that lets you see the run history over a time range. If you switch to a Gantt view, all pipeline runs are grouped by name, displayed as bars relative to how long the run took.
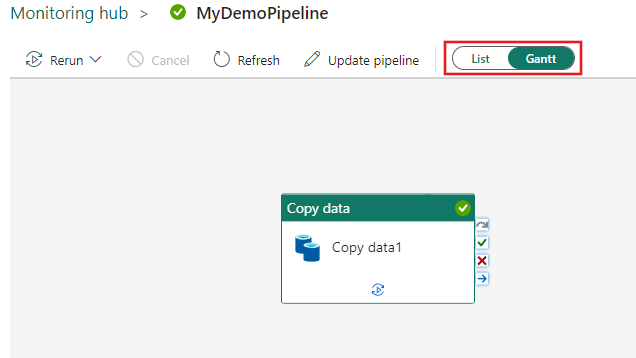
The length of the bar relates to the duration of the pipeline. You can select the bar to view more details.