Set up Azure Monitor in external tenants (preview)
Applies to:  Workforce tenants
  External tenants (learn more)
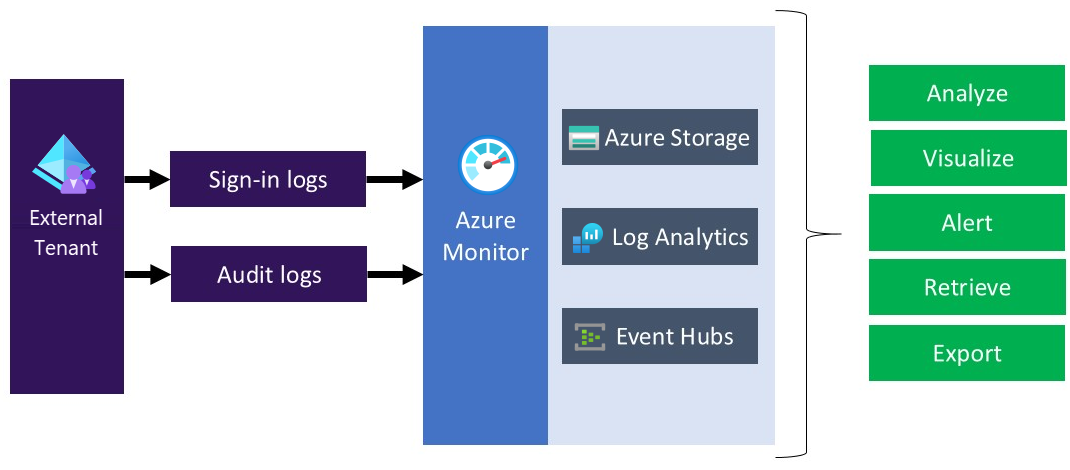
Azure Monitor is a comprehensive solution for collecting, analyzing, and responding to monitoring data from your cloud and on-premises environments. The diagnostic settings on the monitored resource specify what data to send and where to send it. For Microsoft Entra, the destination options include Azure Storage, Log Analytics and Azure Event Hubs.
When you plan to transfer external tenant logs to different monitoring solutions, or repository, consider that external tenant logs contain personal data. When you process such data, ensure you use appropriate security measures on the personal data. It includes protection against unauthorized or unlawful processing, using appropriate technical or organizational measures.
Deployment overview
The external tenant uses Microsoft Entra monitoring. Unlike Microsoft Entra tenants, an external tenant can't have a subscription associated with it. So, we need to take extra steps to enable the integration between external tenant and Log Analytics, which is where we send the logs. To enable Diagnostic settings in workforce tenant within your external tenant, you use Azure Lighthouse to delegate a resource, which allows your external tenant (the Service Provider) to manage a workforce tenant (the Customer) resource.
Tip
Azure Lighthouse is typically used to manage resources for multiple customers. However, it can also be used to simplify cross-tenant administration within an enterprise that has multiple Microsoft Entra tenants of its own. In our case, we're using it to delegate management of a single resource group.
By following the steps in this article, you'll create a new resource group named ExtIDMonitor in your workforce tenant and gain access to the same resource group containing the Log Analytics workspace in your external tenant. You'll also be able to transfer the logs from external tenant to your Log Analytics workspace.
During this deployment, you'll authorize a user or group in your external tenant directory to configure the Log Analytics workspace instance within the tenant that contains your Azure subscription. To create the authorization, you deploy an Azure Resource Manager template to the subscription that contains the Log Analytics workspace.
The following diagram depicts the components you'll configure in your workforce tenant and external tenants.
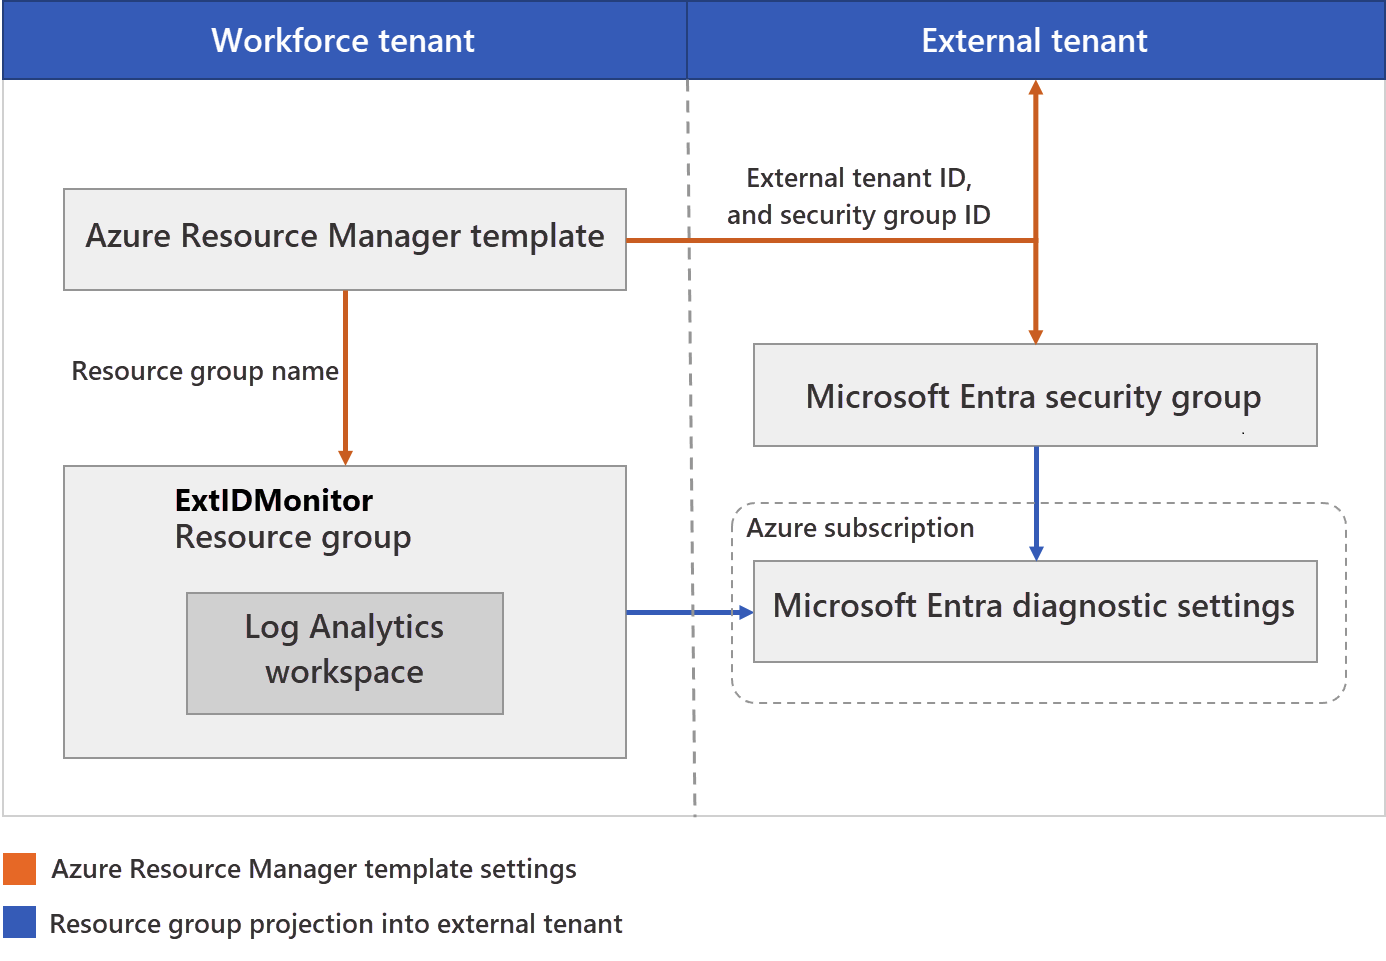
During this deployment, you'll configure your external tenant where logs are generated. You'll also configure your external tenant where the Log Analytics workspace will be hosted. The external tenant accounts used (such as your admin account) should be assigned the Global Administrator role on the external tenant. The account you'll use to run the deployment in the external tenant must be assigned the Owner role in the Microsoft Entra subscription. It's also important to make sure you're signed in to the correct directory as you complete each step as described.
In summary, you'll use Azure Lighthouse to allow a user or group in your external tenant to manage a resource group in a subscription associated with a different tenant (the workforce tenant). After this authorization is completed, the subscription and log analytics workspace can be selected as a target in the Diagnostic settings in external tenant.
Prerequisites
- An Azure subscription. If you don't have one, create a free account before you begin.
- A Microsoft Entra account with the Owner role in the Microsoft Entra subscription.
- An account in the external tenant that's been assigned the Global Administrator role.
Configuration overview
To follow the configuration steps in this article, we recommend opening two separate browser windows or tabs: one for the workforce tenant and one for the external tenant. This setup will help you switch between the two tenants as needed.
Step 1: Workforce tenant configuration - create resource group and logs workspace
Create a resource group
First, create, or choose a resource group that contains the destination Log Analytics workspace that will receive data from external tenant. You'll specify the resource group name when you deploy the Azure Resource Manager template.
- Sign in to the Azure portal.
- If you have access to multiple tenants, select the Settings icon in the top menu to switch to your workforce tenant from the Directories + subscriptions menu.
- Create a resource group or choose an existing one. This example uses a resource group named ExtIDMonitor.
Create a Log Analytics workspace
A Log Analytics workspace is a unique environment for Azure Monitor log data. You'll use this Log Analytics workspace to collect data from external tenant, and then visualize it with queries.
- Sign in to the Azure portal.
- If you have access to multiple tenants, select the Settings icon in the top menu to switch to your workforce tenant from the Directories + subscriptions menu.
- Create a Log Analytics workspace. This example uses a Log Analytics workspace named ExtIDLogAnalytics, in a resource group named ExtIDMonitor.
Add microsoft.insights as a resource provider
In this step, you choose your external tenant as a service provider. You also define the authorizations you need to assign the appropriate built-in roles to groups in your Microsoft Entra tenant. To see all resource providers, and the registration status for your subscription:
- Sign in to the Azure portal.
- If you have access to multiple tenants, select the Settings icon in the top menu to switch to your workforce tenant from the Directories + subscriptions menu.
- On the Azure portal menu, search for Subscriptions.
- Select the subscription you want to view.
- On the left menu, under Settings, select Resource providers.
- Select the microsoft.insights resource provider, and select Register.
Step 2: External tenant configuration - get external tenant ID and create a group for external ID monitoring
Get your external tenant ID
First, get the Tenant ID of your external tenant. You'll need this ID to configure the external tenant to send logs to the Log Analytics workspace in the workforce tenant.
- Sign in to the Microsoft Entra admin center.
- If you have access to multiple tenants, use the Settings icon
 in the top menu and switch to your external tenant from the Directories + subscriptions menu.
 - Select Tenant overview and select Overview.
- Record the Tenant ID.
Create a group for external ID monitoring
Now create a group or user to which you want to give permission to the resource group you created earlier in the directory containing your subscription.
To make management easier, we recommend using Microsoft Entra user groups for each role, allowing you to add or remove individual users to the group rather than assigning permissions directly to that user. In this walkthrough, we'll add a security group.
- Sign in to the Microsoft Entra admin center.
- If you have access to multiple tenants, use the Settings icon
in the top menu and switch to your external tenant from the Directories + subscriptions menu.
- Select Groups, and then select a group. If you don't have an existing group, create a Security group, then add members. For more information, follow the procedure Create a basic group and add members using workforce tenant.
- Select Overview and record the group's Object ID.
Step 3: Workforce tenant configuration - configure Azure Lighthouse
Create an Azure Resource Manager template
To create the custom authorization and delegation in Azure Lighthouse, we use an Azure Resource Manager template. This template grants the external tenant access to the Microsoft Entra resource group, which you created earlier, for example, ExtIDMonitor. Deploy the template from the GitHub sample by using the Deploy to Azure button, which opens the Azure portal and lets you configure and deploy the template directly in the portal. For these steps, make sure you're signed in to your Microsoft Entra workforce tenant (not the external tenant).
Sign in to the Azure portal.
If you have access to multiple tenants, select the Settings icon in the top menu to switch to your workforce tenant from the Directories + subscriptions menu.
Use the Deploy to Azure button to open the Azure portal and deploy the template directly in the portal. For more information, see create an Azure Resource Manager template.
On the Custom deployment page, enter the following information:
Field Definition Subscription Select the directory that contains the Azure subscription where the ExtIDMonitor resource group was created. Region Select the region where the resource will be deployed. Msp Offer Name A name describing this definition. For example, ExtIDMonitor. It's the name that will be displayed in Azure Lighthouse. The MSP Offer Name must be unique in your workforce tenant. To monitor multiple external tenants, use different names. Msp Offer Description A brief description of your offer. For example, Enable Azure Monitor in the external tenant. Managed By Tenant ID The Tenant ID of your external tenant (also known as the directory ID). Authorizations Specify a JSON array of objects that include the workforce tenant principalId,principalIdDisplayName, and AzureroleDefinitionId. TheprincipalIdis the Object ID of the group or user that will have access to resources in this Azure subscription. For this walkthrough, specify the group's Object ID that you recorded earlier in the external tenant. For theroleDefinitionId, use the built-in role value for the Contributor role,b24988ac-6180-42a0-ab88-20f7382dd24c.Rg Name The name of the resource group you create earlier in your workforce tenant. For example, ExtIDMonitor. The following example demonstrates an Authorizations array with one security group.
[
  {
    "principalId": "<Replace with group's OBJECT ID>",
    "principalIdDisplayName": "external tenant administrators",
    "roleDefinitionId": "b24988ac-6180-42a0-ab88-20f7382dd24c"
  }
]
After you deploy the template, it can take a few minutes (typically no more than five) for the resource projection to complete. You can verify the deployment in your =workforce tenant and get the details of the resource projection. For more information, see View and manage service providers.
Step 4: External tenant configuration - select your subscription
After you've deployed the template and waited a few minutes for the resource projection to complete, follow these steps to associate your subscription with your external tenant.
Note
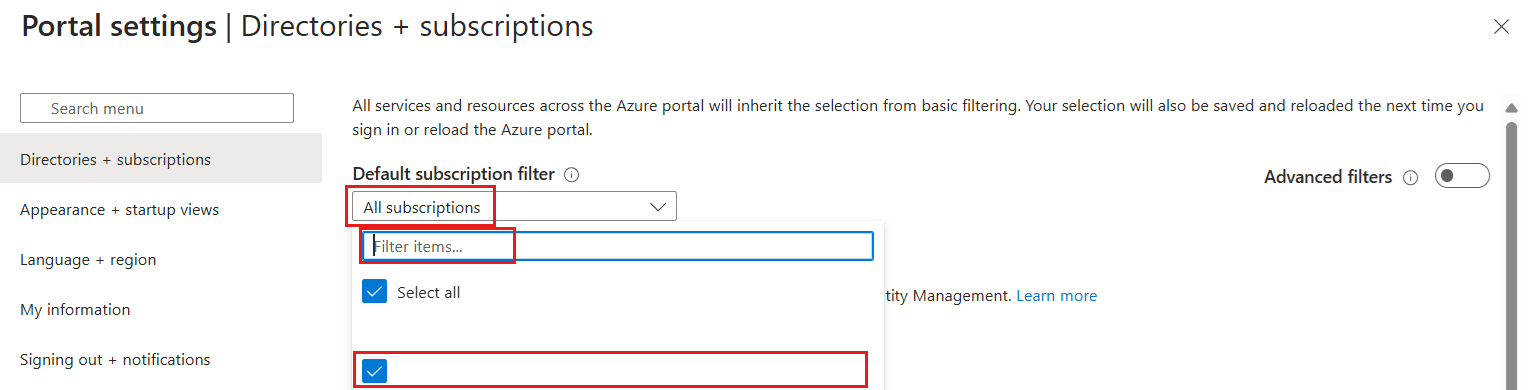
On the Portal settings | Directories + subscriptions page, ensure that your external and workforce tenants are selected under Current + delegated directories.
Select your subscription
- Sign out of the Azure portal and sign back in with your external tenant administrative account. This account must be a member of the security group you specified previously. Signing out and singing back in allows your session credentials to be refreshed in the next step.
- Select the Settings icon in the portal toolbar.
- On the Portal settings | Directories + subscriptions page, in the Directory name list, find your workforce tenant directory that contains the Azure subscription and the ExtIDMonitor resource group you created, and then select Switch.
- Verify that you've selected the correct directory and your Azure subscription is listed and selected in the Default subscription filter.
Configure diagnostic settings
Diagnostic settings define where logs and metrics for a resource should be sent. Possible destinations are:
In this example, we use the Log Analytics workspace to create a dashboard. Follow the steps to configure monitoring settings for the external tenant activity logs:
Sign in to the Microsoft Entra admin center.
If you have access to multiple tenants, use the Settings icon
in the top menu and switch to your external tenant from the Directories + subscriptions menu. This account must be a member of the security group you specified previously.Browse to Diagnostic settings by navigating to Identity > Monitoring & health.
If there are existing settings for the resource, you'll see a list of settings already configured. Either select Add diagnostic setting to add a new setting, or select Edit settings to edit an existing setting. Each setting can have no more than one of each of the destination types.
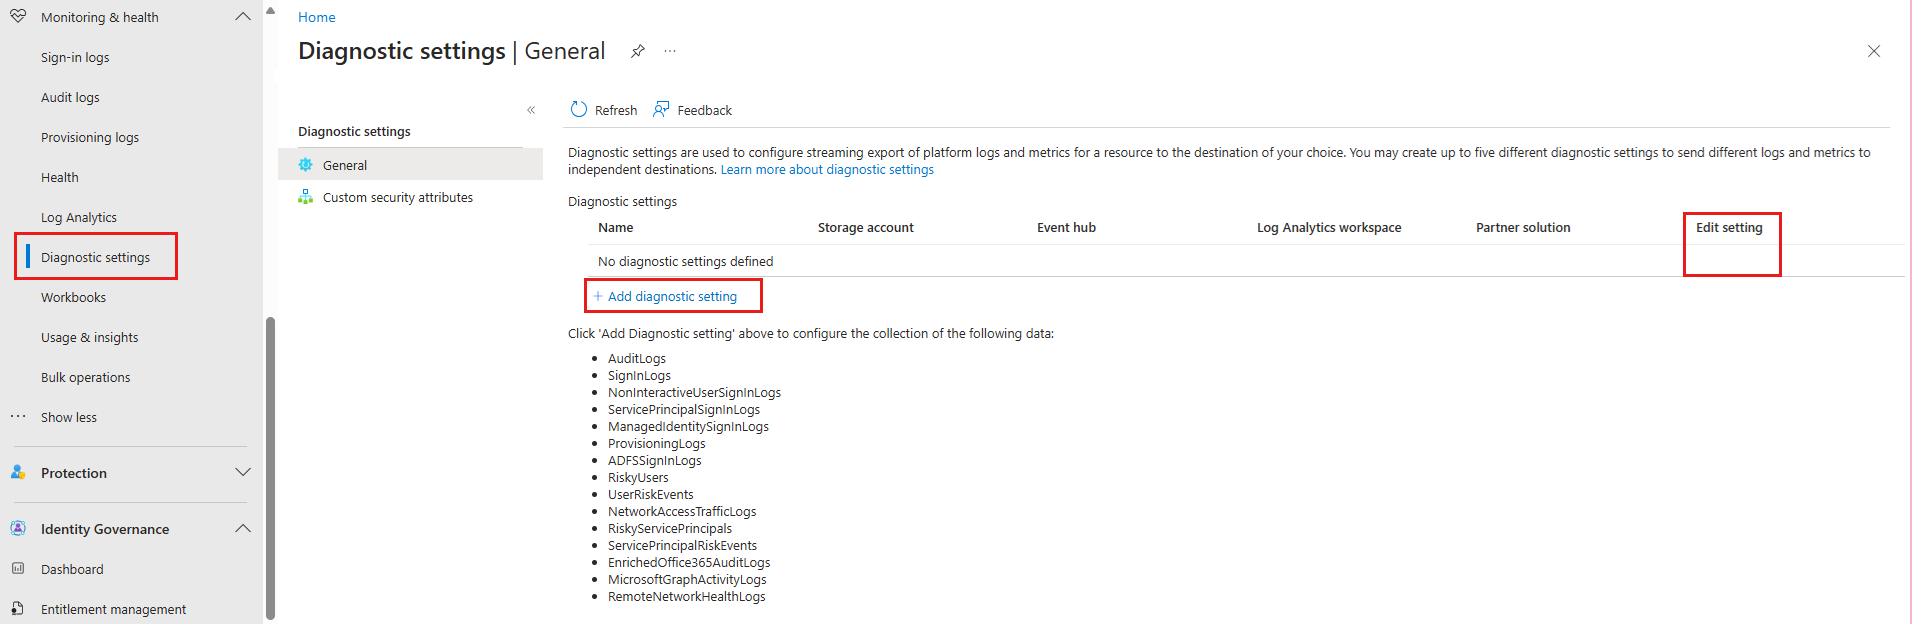
Give your setting a name if it doesn't already have one.
Select AuditLogs and SignInLogs.
Select Send to Log Analytics Workspace, and then:
- Under Subscription, select your subscription.
- Under Log Analytics Workspace, select the name of the workspace you created earlier such as ExtIDLogAnalytics.
Select Save.
Note
It can take up to 15 minutes after an event is emitted for it to appear in a Log Analytics workspace. While you're waiting, it might be helpful to perform some actions to generate logs. For example, you could follow the Get started guide to create some configurations and sign up a user.
Step 5: Workforce tenant configuration – visualize your data
Now you can configure your Log Analytics workspace to visualize your data and set up alerts. You can make these configurations in both your workspace and external tenant.
Create a query
Log queries help you to fully use the value of the data collected in Azure Monitor Logs. A powerful query language allows you to join data from multiple tables, aggregate large sets of data, and perform complex operations with minimal code. Virtually any question can be answered and analysis performed as long as the supporting data has been collected and you understand how to construct the right query. For more information, see Get started with log queries in Azure Monitor.
Sign in to the Azure portal.
If you have access to multiple tenants, select the Settings icon in the top menu to switch to your workforce tenant from the Directories + subscriptions menu.
From Log Analytics workspace window, select Logs
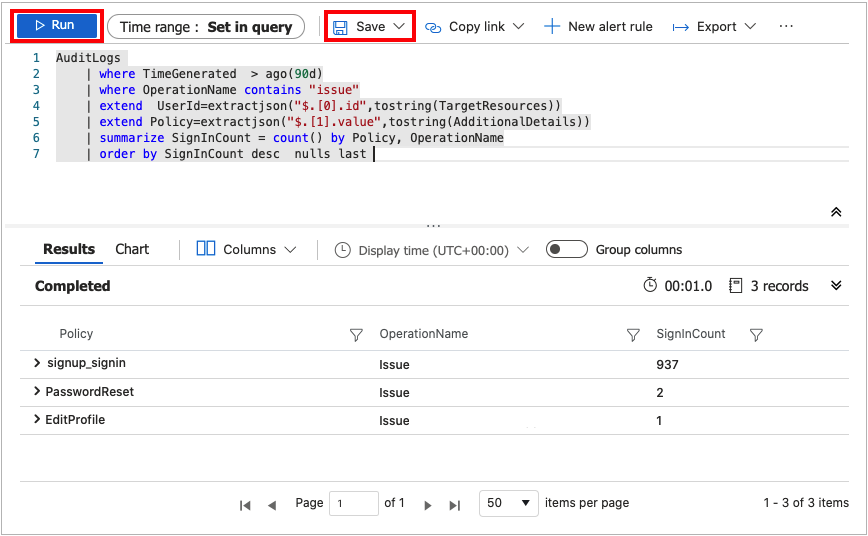
In the query editor, paste the following Kusto Query Language query. This query shows policy usage by operation over the past x days. The default duration is set to 90 days (90d). Notice that the query is focused only on the operation where a token/code is issued by policy.
AuditLogs
| where TimeGenerated  > ago(90d)
| where OperationName contains "issue"
| extend  UserId=extractjson("$.[0].id",tostring(TargetResources))
| extend Policy=extractjson("$.[1].value",tostring(AdditionalDetails))
| summarize SignInCount = count() by Policy, OperationName
| order by SignInCount desc  nulls last
Select Run. The query results are displayed at the bottom of the screen.
To save your query for later use, select Save.
Fill in the following details:
- Name - Enter the name of your query.
- Save as - Select
query. - Category - Select
Log.
Select Save.
You can also change your query to visualize the data by using the render operator.
AuditLogs
| where TimeGenerated  > ago(90d)
| where OperationName contains "issue"
| extend  UserId=extractjson("$.[0].id",tostring(TargetResources))
| extend Policy=extractjson("$.[1].value",tostring(AdditionalDetails))
| summarize SignInCount = count() by Policy
| order by SignInCount desc  nulls last
| render  piechart
Change the data retention period
Azure Monitor Logs are designed to scale and support collecting, indexing, and storing massive amounts of data per day from any source in your enterprise or deployed in Azure. By default, logs are retained for 30 days, but retention duration can be increased to up to two years. Learn how to manage usage and costs with Azure Monitor Logs. After you select the pricing tier, you can Change the data retention period.
Disable monitoring data collection
To stop collecting logs to your Log Analytics workspace, delete the diagnostic settings you created. You'll continue to incur charges for retaining log data you've already collected into your workspace. If you no longer need the monitoring data you've collected, you can delete your Log Analytics workspace and the resource group you created for Azure Monitor. Deleting the Log Analytics workspace deletes all data in the workspace and prevents you from incurring additional data retention charges.
Delete Log Analytics workspace and resource group
- Sign in to the Azure portal.
- If you have access to multiple tenants, select the Settings icon in the top menu to switch to your workforce tenant from the Directories + subscriptions menu.
- Choose the resource group that contains the Log Analytics workspace. This example uses a resource group named ExtIDMonitor and a Log Analytics workspace named ExtIDLogAnalytics.
- Delete the Logs Analytics workspace.
- Select the Delete button to delete the resource group.