Omnichannel Summary dashboard
Applies to: Dynamics 365 Contact Center—standalone and Dynamics 365 Customer Service only
Important
Power Virtual Agents capabilities and features are now part of Microsoft Copilot Studio following significant investments in generative AI and enhanced integrations across Microsoft Copilot.
Some articles and screenshots might refer to Power Virtual Agents while we update documentation and training content.
Note
Copilot Studio bot is renamed as Copilot agent (agent or AI agent). Human agent is now renamed as customer service representative (service representative or representative). You might come across references to the old and new terms while we update the product UI, documentation, and training content.
The Summary dashboard provides a seamless end-to-end reporting of metrics across the customer service journey. This integrated analytics report aligns key metrics in Copilot Studio and Omnichannel for Customer Service.
With the Summary dashboard, customer service managers or supervisors can:
- Use Copilot Studio bot metrics, such as escalation and deflection rate, and customer service representatives (service representatives or representatives) metrics like engagement rate and abandon rate to get an overview of how customers interact with AI agents and their performance.
- Evaluate how different AI agent topic areas and their corresponding agent conversation topics affect your organization’s support performance.
- Get actionable insights to handle AI agent escalations and customer requests effectively, which help improve customer satisfaction and decrease costs.

Access the Summary dashboard
In the Customer Service workspace or Omnichannel for Customer Service app, do one of the following to view the dashboard:
- In the default view, select the plus (+) icon, and then select Omnichannel historical analytics.
- If the enhanced multisession workspace view is enabled, select the site map and then select Omnichannel historical analytics.
On the page that appears, select the dashboard.
Report details
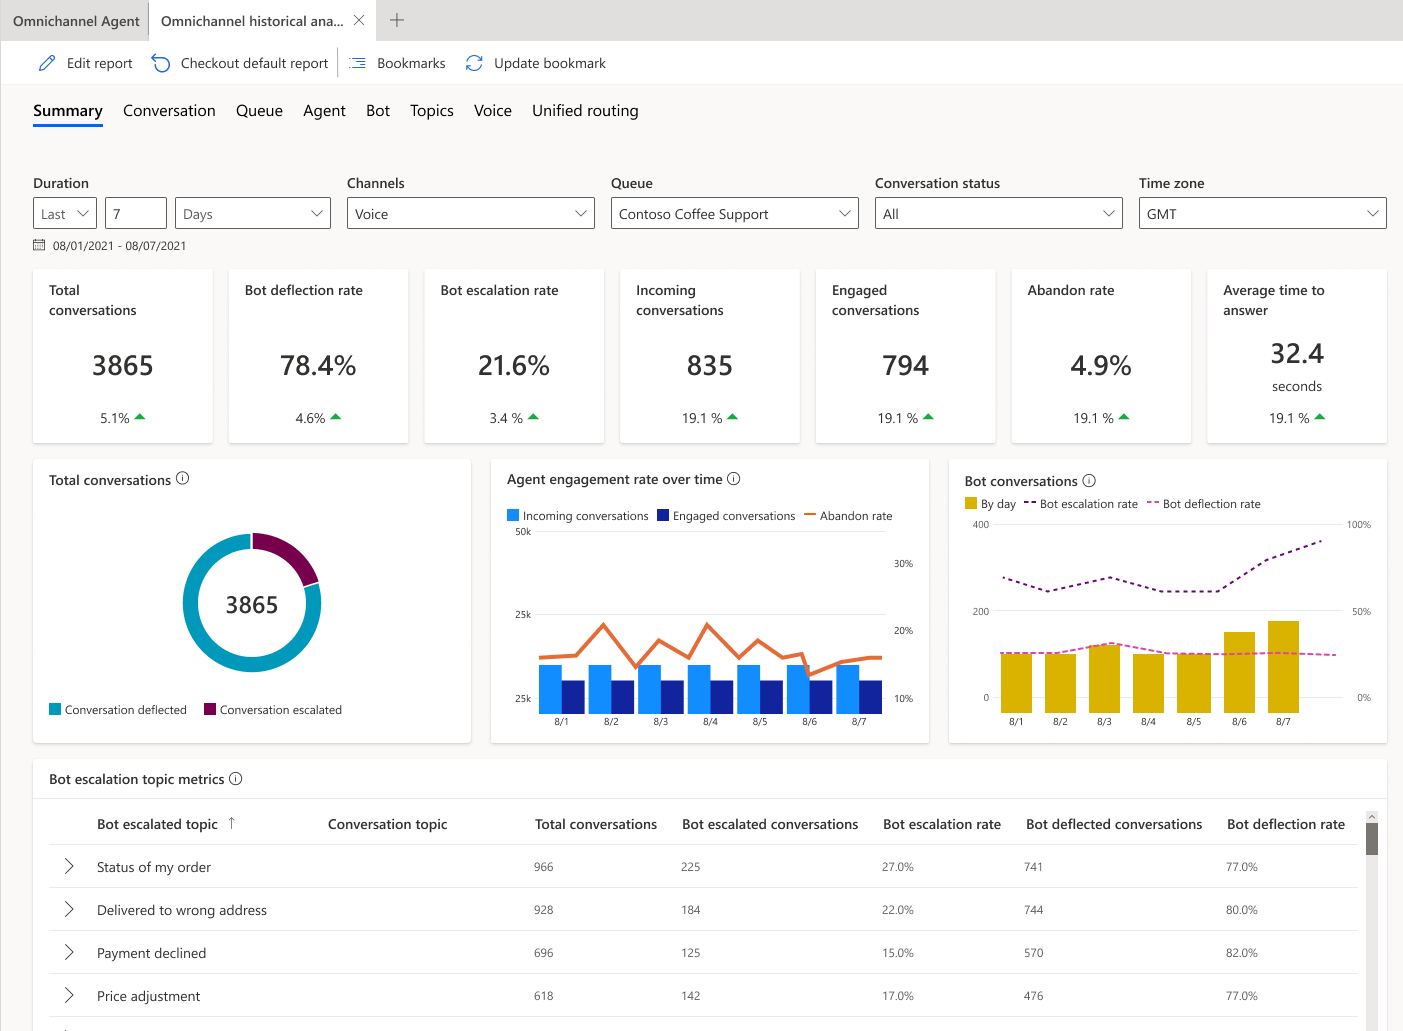
The report summarizes the KPIs for the specified time period and the percentage change over that period. You can filter these areas by duration, channel, queue, or conversation status.

| KPI | Description |
|---|---|
| Total conversations | The number of conversations initiated by customers. |
| Bot deflection rate | The percentage of conversations engaged by AI agents that were resolved. |
| Bot escalation rate | The percentage of conversations engaged by AI agents that were escalated to a customer service representative (service representative or representative). |
| Incoming conversations | The total number of conversations that are initiated by the customer and are presented to a service representative. Conversation escalated by the Copilot agents is also included. |
| Engaged conversations | Offered conversations that are engaged by an agent. Customer-to-agent communication begins at this point. |
| Abandon rate | The percentage of incoming conversations that are in a service representative's queue but aren't engaged by agents. |
| Average time to answer | The average time customers waited in the queue before being connected to an agent. |
An up-and-down indicator below the value indicates the percent change in either a positive or negative direction.
The following charts are displayed in the Summary dashboard.

| Title | Description |
|---|---|
| Total conversations | A graphical view of the conversations initiated by the customer and connected to a service representative directly, resolved by the Copilot Studio agent, or escalated by an AI agent to the service representative. |
| Agent engagement rate over time | A graphical view of the daily incoming conversations, conversations engaged by an agent, and abandoned conversations over time. |
| Bot conversations | A graphical view of the daily deflection and escalation rate and abandon rate over the specified time period. |
Bot escalation topic metrics
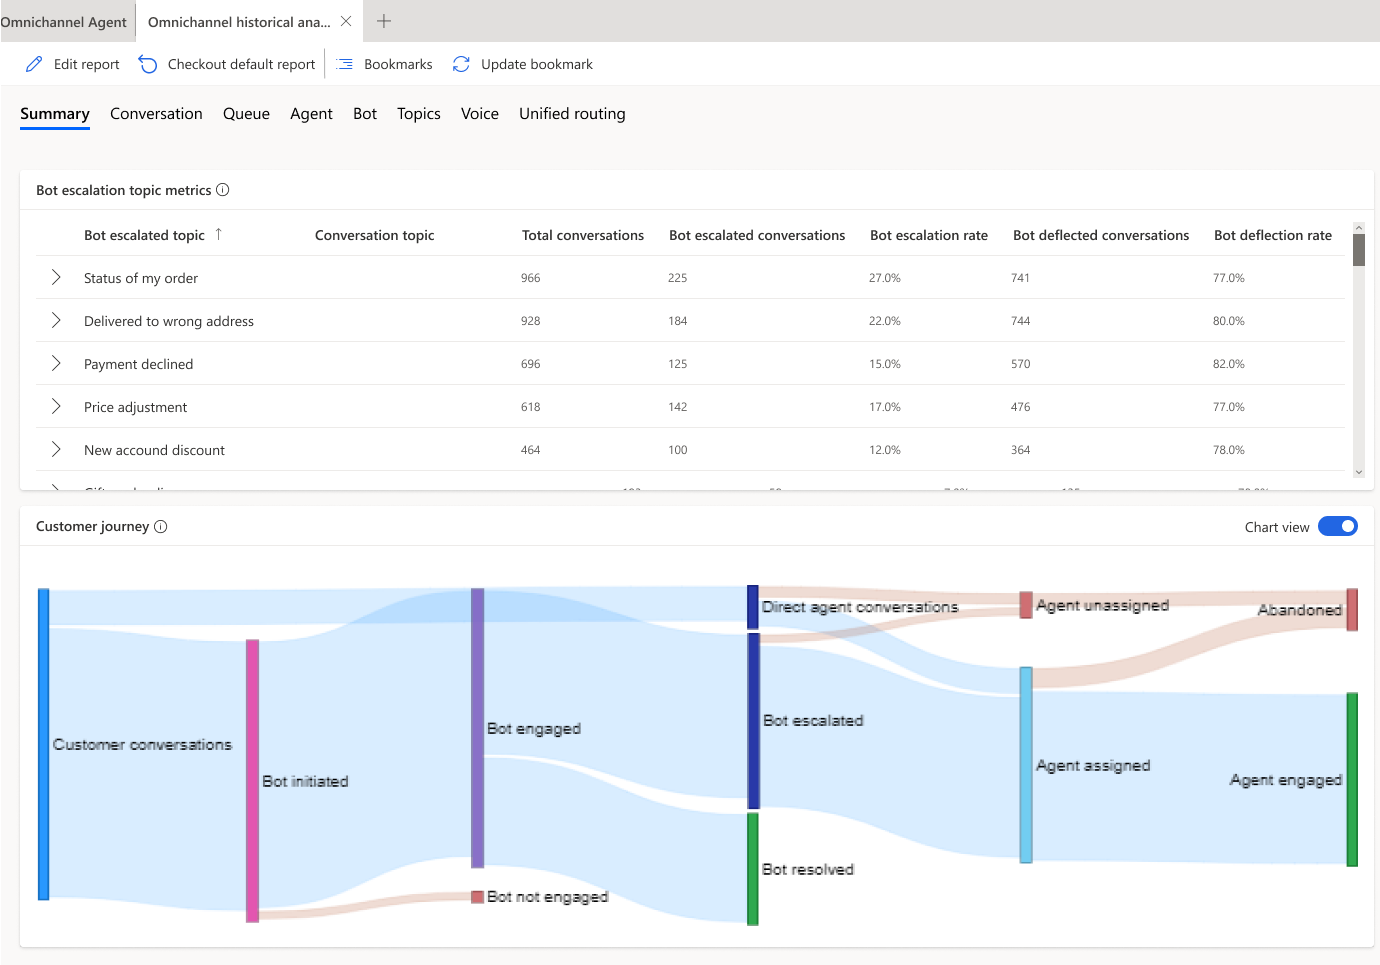
The Bot escalation topic metrics section provides insights into the performance of individual AI agent topics and their key business metrics. Supervisors can drill down into a topic to view the corresponding agent conversation topics and analyze how an AI agent is resolving a topic versus how an agent is resolving an escalated conversation topic. The resolution helps supervisors analyze how different topic areas impact an organization’s support performance.

Learn more about AI agent topics and their related metrics in Bot dashboard.
Language availability for topics
The topics capability in the Customer Service historical analytics reports comes with a natural language understanding model that can understand text semantics and intent in the following languages:
- English
- French
- German
- Italian
- Japanese
- Portuguese
- Simplified Chinese
- Spanish
Note
While topic discovery is enabled and still possible in languages that aren't listed in this section, there might be differences in experience for users who uaw topics in unsupported languages.
Related information
Conversation dashboard
Dashboard overview
Agent dashboard
Bot dashboard
Manage report bookmarks