Use report metrics
Applies to: Dynamics 365 Contact Center—standalone and Dynamics 365 Customer Service only
Note
Copilot Studio bot is renamed as Copilot agent (agent or AI agent). Human agent is now renamed as customer service representative (service representative or representative). You might come across references to the old and new terms while we update the product UI, documentation, and training content.
This article describes the different metrics that help you analyze key performance indicators (KPIs) as you work with customer service representatives (service representatives or representatives) in your contact center. Use metrics to do a quantitative assessment of the data that is shown on the Omnichannel dashboards. Metrics can also help you make strategic decisions, and track and improve customer satisfaction.
Understand the Omnichannel analytics data model
The application provides an out-of-box data model that consists of fact and dimension tables.
- Facts, also known as metrics, represent the observational or event data that you want to analyze. Fact tables logically organize KPIs. For example, the
FactConversationtable has conversation metrics such as average handle time, whereas theFactAgenttable has service representative metrics. - Dimensions represent the attributes of the facts. You can use them to break down the data for further analysis.
You can use facts and dimensions to visualize data according to your organizational requirements. For example, if you want to understand how average handle time varies by queue, you can filter the Average handle time fact by the Queue name dimension.
Fact tables are larger than dimension tables because numerous events, such as individual customer requests, occur in them. Dimension tables are typically smaller because you're limited to the number of items that you can filter on and group. For example, the number of queues is a limited set.
Understand the workflow
Here's a brief description of the workflow.
When a customer raises a request through a channel such as voice, messaging, or chat, the system creates a conversation. A conversation represents an entire end-to-end interaction with a customer. The system can also create a conversation when a service representative calls a customer. A conversation typically originates in a workstream on a specific channel. It then routes to a queue, based on your organizational rule settings. A conversation entity holds metrics about your customer's experience with the contact center. These metrics include the current status, wait time, handle time, and current customer sentiment.
A conversation can end during a single session or it can extend to multiple sessions. A session is created when the system identifies a service representative to work on a conversation. New sessions are created for different reasons. For example, a conversation might be transferred to a different queue, or a service representative might reject a conversation request or let it time out. From this entity, you can get KPIs and metrics that describe queue performance and service representative performance. Examples include the number of requests that landed in a queue, the number of requests that service representatives rejected, and service representative handle time.
The workflow in the following diagram represents a single conversation where multiple sessions are created. The first session is created when the conversation is created and assigned to an AI agent. When the AI agent escalates the conversation to a service representative, the second session is created, and the first session is automatically closed. In the second session, the system identifies and assigns the best service representative to work on the customer request. If that service representative rejects the request, a new session is created, and the process of identifying another service representative begins.

For every service representative who is identified to work on a conversation and associated with the latest session, a session participant entry is created. A single session can have multiple participants. Every session has one primary participant: the service representative who has the assigned work item. A session might then have many other participants who monitor the conversation or help with the consultation. Alternatively, the session might have no other participants. From this entity, you can get KPIs and metrics about consultations that service representatives provide and monitored conversations.
Dimensions
This section describes the different dimensions of the out-of-box omnichannel real-time analytics metrics.
For information about how you can use these metrics to customize the visual display of your reports, go to Customize visual display.
Skills
Skills assigned to service representatives.
Proficiency
A service representative's proficiency level for assigned skills.
Capacity profile name
This dimension represents the name of the capacity profile.
Conversation direction
This dimension applies only to voice conversations. It indicates whether the customer or a service representative in the contact center initiated the conversation.
If a contact center service representative initiates the conversation (and the customer receives it), the system considers it outbound. If the customer initiates the conversation (and the contact center receives it), the system considers it inbound.
Conversation status
This dimension represents the current state of a customer interaction. The following status values are available:
Open: The conversation is currently awaiting service representative assignment.
Active: Either the conversation has a service representative assigned and is awaiting acceptance, or a service representative is in contact with the customer.
Waiting: The conversation is currently awaiting either a customer response or a service representative response. This option applies to asynchronous conversation modes, such as messages.
Wrap-up: The service representative is performing post–customer interaction activities such as adding notes or updates to the case after the end of a customer conversation.
Closed: The conversation is currently closed. The following metrics are a measure of the conversations grouped by call closure reason.
- Ghost Conversation: Conversations that are connected to a service representative but there was no interaction from customer after the conversation was connected.
- Ghost Conversations Rate: Percentage of engaged conversations that are connected to a service representative but there was no interaction from the customer.
- Conversation disconnect rate: Percentage of conversations that were ended by customer before a service representative ended the conversation.
- Disconnect reason: Represents the reason behind a customer disconnect. For chats, it represents whether the customer closed the widget, ended the conversation, or there was a system disconnect. For voice, it represents whether the customer ended the call or the call was disconnected due to connection issues.
Queue name
This dimension represents the name of the queue.
Service representative presence
This dimension represents the statuses that are available for service representatives. The out-of-box options include Online, Away, Busy, Offline, and Do Not Disturb. The status options that are available to you depend on your organization's configuration and include any other custom presence statuses configured for your organization.
Date hour
This dimension represents the hour of the day in a 24-hour format.
Time range
The following time-based filter options are available on real-time dashboards:
- Today: View all conversations that started since 12 AM in the selected time zone, in any state or province.
- Last 24 hours: View all conversations that started in the last 24 hours, in any state or province.
- Include open conversations beyond 24 hours: View all conversations that started in the last 24 hours, in any state or province. In addition, view all conversations that started in the last three days and are still open.
Time zone
This dimension represents the time zone that is used to calculate and show metrics across the dashboards. The available options are standard time zones.
Service representative name
This dimension represents the name of the omnichannel service representative.
Service representative participation mode
The following service representative participation modes are available:
- Primary: Service representative participation mode is Primary.
- Consult: Service representative participation mode is Consult.
- Monitor: Supervisor participation mode is Monitor. This option applies only to users who have the Omnichannel supervisor role.
Workstream name
This dimension represents the name of the omnichannel workstream where the conversation originated.
Channel name
This dimension represents the name of the channel.
Metrics
Consult
This metric represents the service representative participation consult mode. The related metrics aren't available by default. You can use these metrics to customize the visual display of your reports. Select Edit report to find the following metrics in your data model when you search for Consult. Learn more in Customize visual display.
Related metrics
Average consult time: The average time that service representatives spend helping other service representatives on consult requests. It's calculated by dividing the total time spent by service representatives on these requests by the total number of consult requests accepted. You can display the average consult time in seconds or in the hh:mm:ss format.
Consult acceptance rate: The total number of sessions accepted by service representative over all the sessions requested for consult from the service representative.
Consult not acceptance rate: The total number of sessions that didn't have acceptance by the service representative over all the sessions requested for consult from the service representative. This number includes timed out and rejected requests.
Consult rejection rate: The total number of sessions that the service representative rejected over all the sessions requested for consult from the service representative.
Consults requested: The total number of sessions that were requested for consultation.
Consult requests accepted: The total number of sessions that were requested for consultation and accepted by the service representative.
Consult requests not accepted: The total number of sessions that were requested for consultation and had no acceptance from the service representative.
Consult requests rejected: The total number of sessions that were requested for consult but the service representative rejected.
Consult requests timed out: The total number of sessions that were requested for consult from the service representative but resulted in a timeout because the service representative failed to respond.
Consult time: The time taken by service representatives to help other service representatives on consult requests. This metric can be viewed in seconds and in hh:mm:ss formats. Available only for the omnichannel real-time out-of-the-box dashboard.
Consult sessions: The total number of sessions that are under consult. Available only for the omnichannel historical out-of-the-box dashboard.
Consult timed out rate: The total number of sessions that resulted in timeout over all the sessions requested for consult from the service representative.
Conversation first wait time
This metric is a measure of the time, in seconds, before a service representative responds to a customer's request. In other words, it represents the amount of time that the customer spends waiting for the first response from a service representative. Service representative availability, a high volume of requests, and increased handle time are some factors that can affect customer wait time. A shorter wait time indicates that customers get faster issue resolution and have a better support experience.
If an AI agent or interactive voice response (IVR) handles the customer before it escalates the issue to a service representative, the calculation is based on the time between the point when the AI agent or IVR escalates the incoming conversation to a service representative and the point when the service representative accepts the conversation. If the customer abandons the conversation, the calculation is based on the time between the point when the AI agent or IVR escalates the conversation to a service representative and the point when the customer disconnects the conversation.
If the customer reaches a service representative queue directly, the calculation is based on the time between the point when the customer creates the request and the point when a service representative accepts the conversation. If the customer abandons the conversation, the calculation is based on the time between the point when the customer creates the request and the point when the customer disconnects the conversation.
This metric is available in two formats: seconds and hh:mm:ss.
Related metrics
- Average conversation first wait time: This metric is calculated by dividing the total wait time for customers who are waiting in the queue by the total number of served customers.
- Longest wait time: This metric is a measure of the longest first wait time among incoming conversations that a service representative hasn't yet accepted.
- Conversations in queue: This metric is a count of customer requests that are currently awaiting service representative assistance, or conversations where a service representative is assigned but are waiting for the service representative to accept.
For information about metrics that are related to the time that customers wait in individual queues if they're transferred from one service representative to another, go to the Session wait time section.
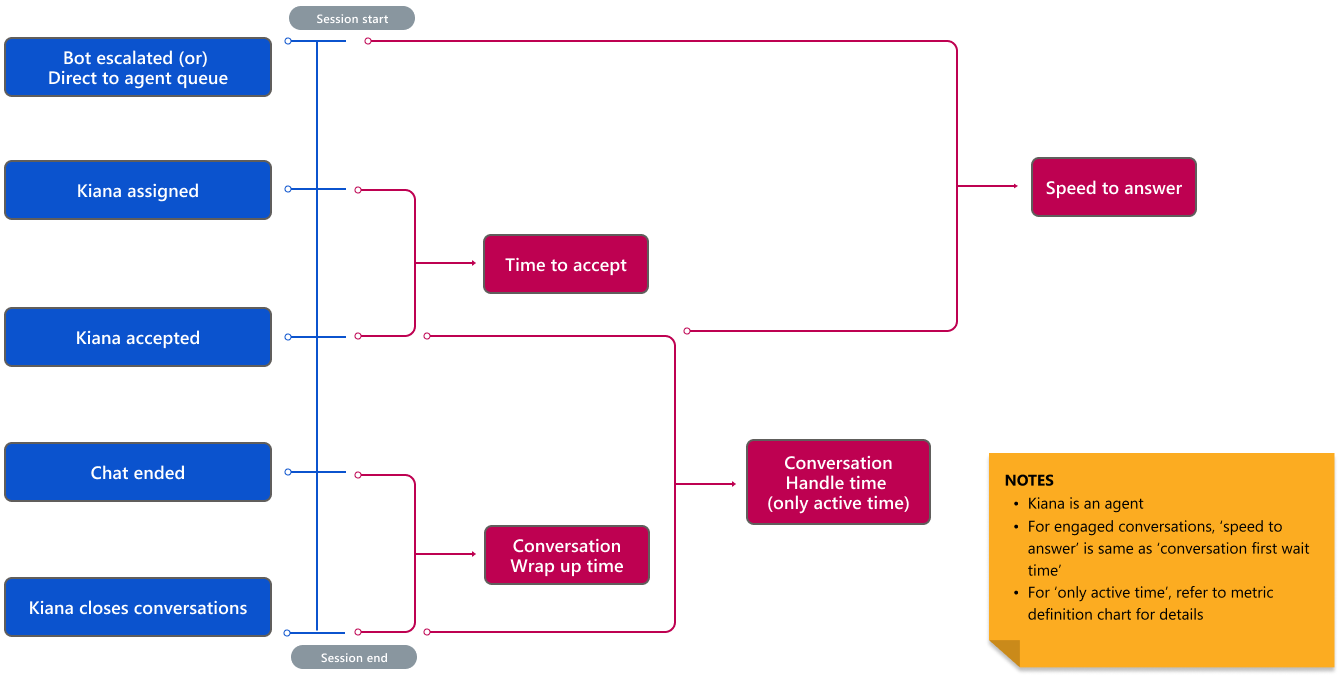
Average speed to answer
This metric measures how quickly the customer service team responds to a customer's request. It's calculated by dividing the total wait time for customers who are waiting in the queue (after their issue is escalated from an AI agent to a service representative) by the total number of served customers. Average speed to answer reflects the efficiency and availability of the service representatives. A lower average speed to answer indicates that customers can get their issues resolved more quickly and have a better experience with the service.
If an AI agent or IVR handles the customer before it escalates the issue to a service representative, the calculation is based on the time between the point when the AI agent or IVR escalates the incoming conversation to a service representative and the point when the service representative accepts the conversation.
If the customer reaches a service representative queue directly, the calculation is based on the time between the point when the customer creates the request and the point when a service representative accepts the conversation.
This metric is available in two formats: seconds and hh:mm:ss.
Related metrics
- Service level (10 seconds): This metric is a measure of the percentage of customer conversations where the speed to answer is less than or equal to 10 seconds.
- Service level (20 seconds): This metric is a measure of the percentage of customer conversations where the speed to answer is less than or equal to 20 seconds.
- Service level (30 seconds): This metric is a measure of the percentage of customer conversations where the speed to answer is less than or equal to 30 seconds.
- Service level (40 seconds): This metric is a measure of the percentage of customer conversations where the speed to answer is less than or equal to 40 seconds.
- Service level (60 seconds): This metric is a measure of the percentage of customer conversations where the speed to answer is less than or equal to 60 seconds.
- Service level (120 seconds): This metric is a measure of the percentage of customer conversations where the speed to answer is less than or equal to 120 seconds.
- Speed to answer: This metric is a measure of the time before a customer request is accepted.
For information about metrics that are related to how quickly a service representative accepts a request, go to the Average speed to answer section.
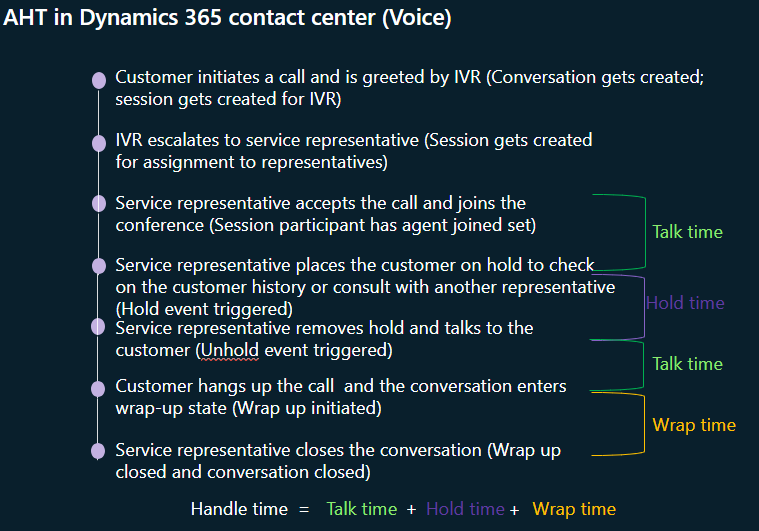
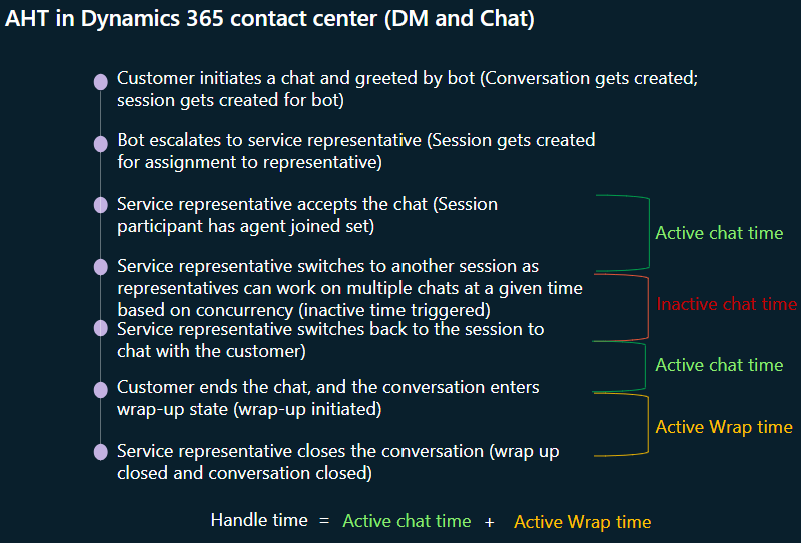
Conversation handle time
This metric is a measure of the time that service representatives spend actively helping customers and resolving their issues. If multiple service representatives handle a conversation, the talk time, hold time, and wrap-up time that all the service representatives spend is aggregated. This metric also includes time that service representatives spend wrapping up the conversation after the customer disconnects, and the time that they spend updating notes or contact details. However, it excludes time that subject matter experts or other service representatives spend consulting with service representatives who are assigned to work on customer conversations.
A service representative is considered as actively working on a conversation if they have the conversation open in the Customer Service workspace app. If a service representative is handling multiple conversations, including conversations that they're currently wrapping up, only the time that the service representative spends on the conversation on an open tab counts toward that conversation's handle time.
A long average handle time might indicate that service representatives are taking too long to resolve customer issues, and that they need more training or support to help them work better. In addition, a long average handle time might suggest that customers aren't receiving the level of service or support that they need to resolve their issues. Therefore, it might lead to customer dissatisfaction.
This metric can be viewed in two formats: seconds and hh:mm:ss.
Average handle time
This metric represents the average duration of a single customer interaction. This includes total time spent on the call or chat, any hold time, and the wrap up time or after-call work required to close the interaction. It helps you understand how efficiently customer inquiries are handled and issue resolution is done.
For information about metrics that are related to the time that individual service representatives spend when multiple service representatives handle conversations, see Average session handle time.
For the Voice report, this metric is a measure of total talk time, total hold time, and total wrap-up time or after-call work, divided by the number of calls handled, where:
Talk time: The time a service representative spends in actively speaking with the customer.
Hold time: The time for which a service representative puts the customer on hold during the interaction.
Wrap-up time or after-call work: The time taken to complete any post-call tasks related to the interaction.
Total number of calls handled: The total number of customer interactions handled by the service representatives.
For the Chat report, this metric is a measure of the active chat time and active wrap-up time, divided by the number of chats handled, where:
Active chat time: The time a service representative spends in actively chatting with the customer.
Active wrap-up time: The time taken to complete any post-chat tasks related to the interaction.
Total number of chats handled: The total number of customer interactions handled by the service representatives.
Average conversation hold time
This metric is a measure of the average time, in seconds, that the service representatives who handled a conversation had the customer on hold. If multiple service representatives handled the conversation, the hold time across all the service representatives is aggregated. This metric is calculated by dividing the total hold time for all customer requests by the total number of customers who were served.
There are several reasons why a service representative might put a customer on hold. For example, the service representative might have to gather more information or research an issue, perform tasks that don't require interaction (for example, entering data into a system), or work on an offline task. A long hold time can cause customer frustration and might lead to a poor customer experience.
Average conversation talk time
This metric is a measure of the average time, in seconds, that service representatives spent actively conversing with customers on the phone for voice conversations. If multiple service representatives handled the conversation, the conversation talk time is aggregated across all the service representatives. This metric is calculated by dividing the total talk time for all customer requests by the total number of customers who were served.
Related metric
- Conversation talk time: This metric is calculated based on the total talk time across all customer requests.
Average conversation time
This metric is a measure of the average time, in seconds, that a customer who was seeking help from the contact center spent with a service representative. It includes the time that the customer spent waiting for service representatives to work with them.
Related metric
- Conversation time: This metric is calculated as the time between the point when the customer initiated the request and the point when the service representative wrapped up the conversation.
Average conversation wrap-up time
This metric is a measure of the average time that a service representative spends completing any necessary tasks after the customer disconnects. These tasks might include documenting the conversation, updating notes, or updating the customer's information. The calculation is based on the time between the beginning of the wrap-up and the point when the service representative closes the conversation. If multiple service representatives handled a conversation, this metric applies only to the time that the last service representative who worked with the customer spent.
This metric can be viewed in two formats: seconds and hh:mm:ss.
Abandoned conversations
A conversation can be abandoned for multiple reasons. For example, a customer might be disconnected or might cancel the call because of a long waiting period, supervisors might forcibly close requests, or automatic system actions might be configured to respond to handle overflow. Abandoned conversations can lead to customer dissatisfaction because of a lack of assistance from the contact center. A high abandonment rate might require further investigation into operational metrics such as service representative availability and queue distribution.
If an AI agent or IVR handles the customer before it escalates the request to a service representative, this metric is calculated as the number of conversations that were abandoned while customers were waiting for a service representative after the AI agent escalated the request. If a conversation is abandoned before an AI agent can be assigned, the system considers the conversation abandoned.
If the customer reaches a service representative queue directly, this metric is calculated as the number of incoming conversations that were abandoned.
The conversation direction is Incoming. The channels that the conversation came in through are Messaging and Voice.
Related metric
- Abandoned rate: This metric is a measure of the percentage of incoming conversation requests that ended before customers were connected to a service representative. It's calculated by dividing the number of abandoned conversations by the number of AI agent-escalated conversations.
Active conversations awaiting service representative acceptance
This metric is a count of conversation requests from customers where service representatives are assigned but that are currently waiting for a service representative to accept and join the conversation. The conversations revert to an Open state if the service representative rejects or responds to the request.
Active conversations with service representative acceptance
This metric is a count of conversations where a service representative is assigned and is actively in contact with the customer. Supervisors can monitor these conversations, track sentiment to ensure customer satisfaction, and intervene as needed.
Waiting conversations
This metric is a count of conversations that are currently in a Waiting state. A conversation is moved to a Waiting state when the service representative closes the session without ending the conversation (that is, without selecting the End button on the communication panel), or when the customer closes the browser window without closing the chat widget. If there are asynchronous messaging channels, a Waiting state indicates conversations that are waiting for a service representative to respond. Learn more in Understand conversation states.
Wrap-up conversations
This metric is a count of conversations that are currently in a Wrap-up state. A conversation is moved to a Wrap-up state when the service representative ends the conversation, or when the customer leaves the conversation either by ending it on their side or by being disconnected. Learn more in Understand conversation states.
Total conversations
This metric is a measure of the total number of customer conversations. Learn more in Understand conversation states.
Incoming conversation
This metric is a measure of the total number of conversation requests that customers initiated across all channels and received by the contact center. Learn more in Understand conversation states.
Sentiment
The metric is a measure of the current sentiment of customer. It's powered by Contact Center sentiment analysis.
Average session handle time
This metric is similar to conversation handle time, but it's granular and is calculated for every service representative who works on the conversation. This metric is relevant to conversations that multiple service representatives handled. If multiple service representatives were assigned to work on a customer request for any reason (for example, transfers or escalations), this metric measures the average time that each service representative who worked with the customer spent. Conversation handle time is a measure of the aggregated session handle time for all the associated sessions.
Related metric
- Session handle time: This metric is a measure of the time that service representatives spend helping customers on assigned customer requests.
Customer sentiment
This metric is a measure of the current sentiment of the customer. It's powered by Contact Center sentiment analysis.
Is handled by external participant (session)
Multiple service representatives might handle a customer request, including a combination of internal contact center service representatives and external service representatives. For example, your contact center can engage external service representatives through transfers to an external phone number or through a Microsoft Teams voice call. This metric is used to identify the portion of a customer request that service representatives outside Dynamics 365 Customer Service handled. It indicates the sessions that were assigned to and handled by external service representatives only.
For information about metrics that are related to consultations with external service representatives, go to the Is handled by external participant (session) section.
Session transfer rate
This metric is a measure of the rate at which service representatives transfer work that is assigned to them, or the rate at which supervisors transfer work in the queue that they monitor from one service representative to another or to another queue. It's calculated by dividing the total number of transferred sessions by the total number of handled sessions.
Related metrics
- Is Transferred Out: This metric indicates whether the conversation and the underlying session were transferred out of a queue.
- Transferred sessions: This metric is a measure of the total number of sessions that were transferred.
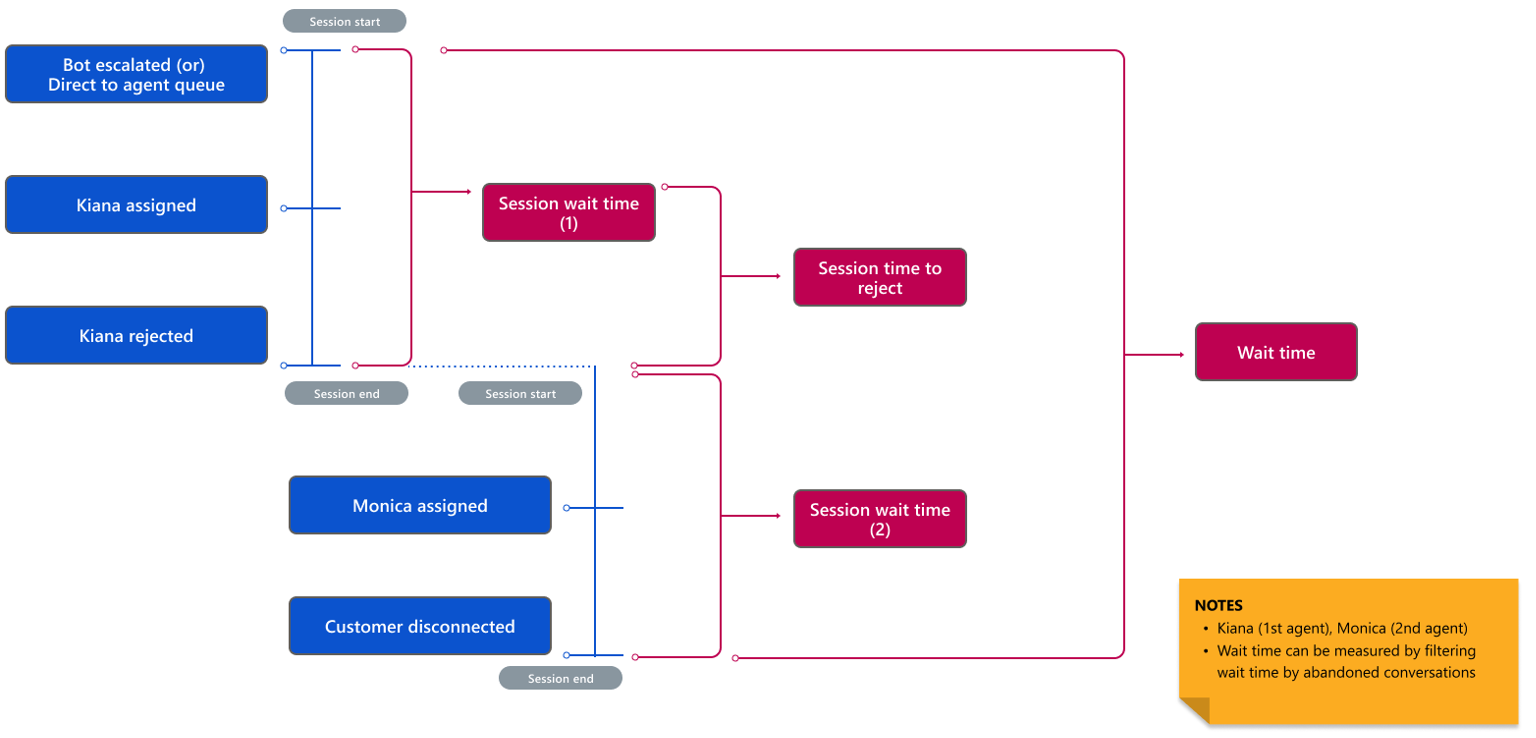
Session rejection rate
This metric is a measure of the rate at which service representatives reject work that is assigned to them. It's calculated by dividing the total number of sessions that service representatives rejected by the total number of sessions assigned to them.
Related metrics
- Rejected sessions: This metric is a measure of the total number of times that service representatives rejected work that was assigned to them.
- Session time to reject: This metric is a measure of the average time that service representatives take to reject work that is assigned to them. The calculation is based on the time between the point when a customer request is assigned to a service representative and the point when the service representative rejects the request.
Session time to accept
This metric is a measure of the average time that service representatives take to accept work that is assigned to them. The calculation is based on the time between the point when a customer request is assigned to a service representative and the point when the service representative accepts the request.
Related metric
- Engaged sessions: This metric is a measure of the total number of sessions that service representatives accepted.
Session timeout rate
This metric is a measure of the rate at which sessions time out because of service representative's inactivity. The service representative didn't accept or reject the customer requests. This metric is calculated by dividing the total number of requests where the service representative didn't provide any response by the total number of sessions that were assigned to them.
Related metric
- Timeout sessions: This metric is a measure of the total number of times that service representatives didn't respond to the work that was assigned to them.
Session wait time
This metric is a measure of the time, in seconds, that a customer spends waiting in a specific queue before an service representative accepts their request. If the customer abandons the request, or if the conversation is transferred to another queue, the calculation is based on the time between the point when the customer request arrives in the queue and the point when the request is closed.
Active sessions
This metric is a count of sessions that are currently in progress. The system considers a session active if no service representative has yet been assigned to it, it's awaiting service representative acceptance, or service representatives are actively helping customers.
Closed sessions
This metric is a count of sessions that are currently closed.
Total sessions
This metric is a measure of the total number of sessions that were presented to or handled by service representatives.
Is handled by external participant
Multiple service representatives might handle a customer request, including a combination of internal contact center service representatives and external service representatives. For example, your contact center can engage external service representatives through transfers to an external phone number or through a Microsoft Teams voice call. This metric is used to identify the portion of a customer request that service representatives outside Dynamics 365 Customer Service handled.
Related metrics
- External participant channel: This metric helps identify the channels that external service representatives were engaged through. For example, an external service representative can help customers with requests by calling them directly at their phone number or via a Microsoft Teams Public Switched Telephone Network (PSTN) call.
- External participant channel type: This metric represents the details of the external service representative, such as the phone number.
Session participant count
This metric is a measure of the total number of service representatives who were involved in helping a customer. These service representatives include the primary service representative who was assigned to work on the session and any subject matter experts who were consulted. You can use the SessionParticipationType dimension to analyze this metric and get further statistics.
Average first response time
Whereas speed to answer provides insights into how quickly a service representative was connected with a customer, first response time provides insights into how quickly the service representative responded to the customer. First response time is a measure of the time that customers spend waiting for a first response from a service representative. The time is adjusted based on operating hours. The calculation is based on the time between the point when a customer initiates a conversation (or, in the case of an AI agent-escalated conversation, the point when the AI agent escalates it) and the point when the service representative accepts the request and responds to the customer. For messaging conversations, this time represents how soon the service representative sent the first response to customer.
The system calculates average first response time by dividing the total first response time across all engaged conversations by the number of engaged conversations.
The time can be viewed in two formats: seconds and hh:mm:ss.
Average service representative response time
Service representative response time is a measure of the average time that customers who sent a message must wait to get a response from a service representative. The time is adjusted based on operating hours. The system calculates average service representative response time by dividing the total response time by the number of exchanges between customers and service representatives across all engaged conversations. A longer response time indicates that more time passes between messages as customers wait for a service representative to respond and provide updates. A longer response time negatively affects the customer experience.
The time can be viewed in two formats: seconds and hh:mm:ss.
First response service level
This metric is a measure of the percentage of customer conversations that have a service representative response time of less than 60 seconds.
Service representative response service level
This metric is a measure of the percentage of customer messages that have a service representative response time of less than 60 seconds.
Assigned capacity profile count
This metric is a count of capacity profiles that are assigned to service representatives.
Total available work item capacity
This metric is a measure of the maximum number of more work items that can be assigned.
Total work item capacity in use
This metric is a measure of the work items that are currently being handled.
Total work item capacity
This metric is a measure of the maximum work items that are allowed, based on the configuration of the capacity profile.
Logged in service representatives
This metric is a count of omnichannel service representatives who are currently signed in.
Total service representatives
This metric is a measure of the total number of omnichannel service representatives.
Total available capacity units
This metric is a measure of the capacity units that are available to handle conversations.
Total capacity units
This metric is a measure of the maximum capacity units that are assigned. It applies only to organizations that use capacity units.
Total occupied capacity units
This metric is a measure of the capacity units that are currently occupied.
Status duration
This metric is a measure of the time that a service representative spent in a presence status.