Historical analytics for unified routing in Customer Service
With the introduction of unified routing, an advanced and elaborate set of capabilities are available for organizations to enhance their routing configurations. Supervisors and business administrators need metrics to track how these advanced routing capabilities are helping their businesses serve their customers.
In Customer Service, the report displays metrics pertaining to only those records that are routed using unified routing.
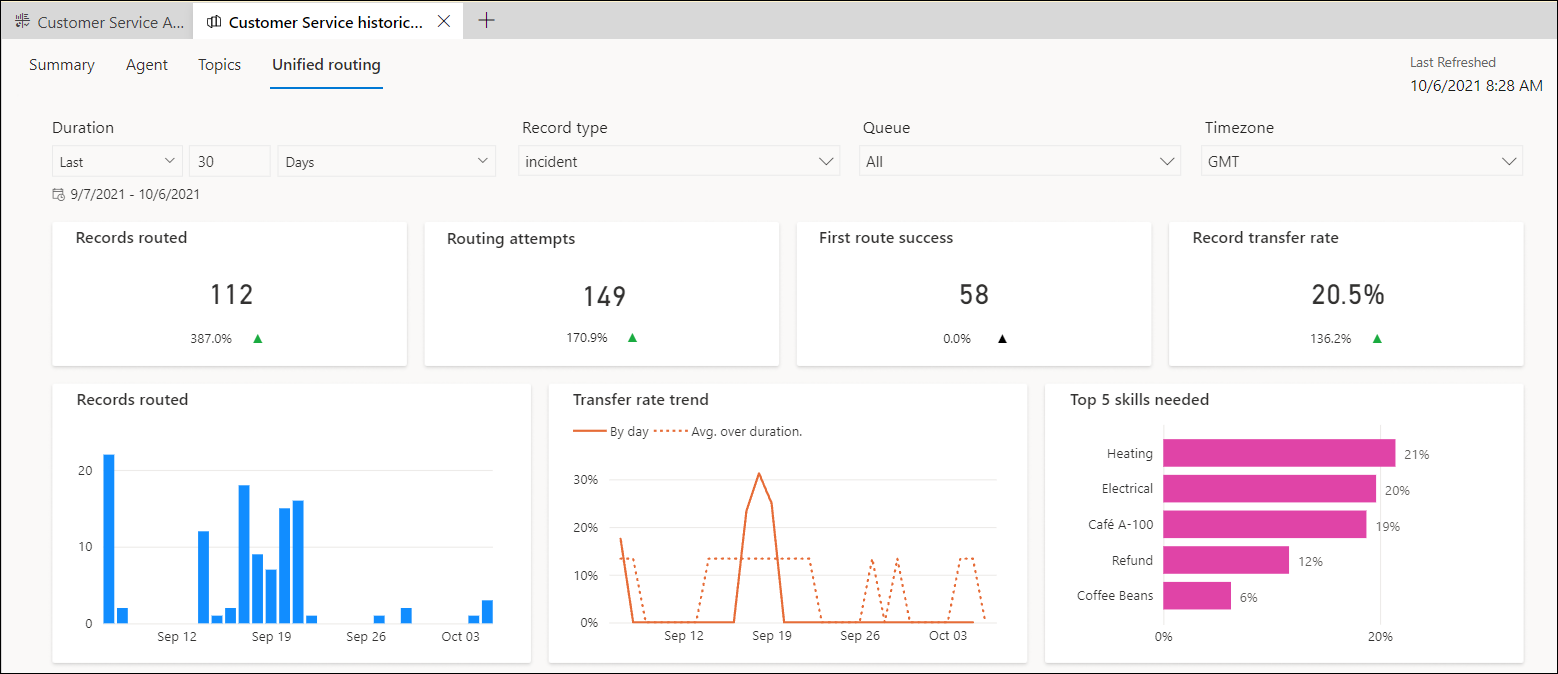
Unified routing report in Customer Service historical analytics
The Unified routing report provides routing-specific KPIs and metrics that can be used by supervisors and administrators to track the success of their routing strategy. They can also track the incorrectly routed work items and configurations and correct them to improve the routing effectiveness and thereby customer satisfaction.
The report appears as a tab in the Customer Service historical analytics report if your administrator has enabled the corresponding setting on the Insights page in Customer Service Hub. You can access the report in Service. In the site map, select Customer Service historical analytics, and then select Unified routing.
Access the Unified routing dashboard
In the Customer Service workspace or Omnichannel for Customer Service app, do one of the following to view the dashboard:
- In the default view, select the plus (+) icon, and then select Customer Service historical analytics.
- If the enhanced multisession workspace view is enabled, select the site map and then select Customer Service historical analytics.
On the page that appears, select the dashboard.

The report can be filtered on the following:
- Duration: Filters the data by the selected value of day, week, or month.
- Record type: Filters the data for the selected record, such as a case, lead, or custom record. By default, the report is filtered on incident (case).
- Queue: Filters the data for the selected queue that's enabled for unified routing.
- Time zone: Filters the data for the selected time zone.
The unified routing report displays the following metrics.
| Metric | Description | Derivation |
|---|---|---|
| Records routed | Number of records that were routed. | Only records routed using unified routing are considered. |
| Routing attempts | Number of routing attempts across records that were routed. | Records that were attempted for routing using the "Save and Route" action will be considered as an attempt. |
| First route success | Number of records that were successfully routed in the first attempt. | Success for a push workstream is when the record is assigned to a customer service representative (service representative or representative). Success for a pick workstream is when the record is routed to a queue. |
| Records transfer rate | The percentage of records that were transferred to another representative or queue. | |
| Records routed | Day wise view of records that have been routed. | |
| Transfer rate trend | Percentage of sessions transferred out of the total sessions for the records routed. | |
| Top 5 skills needed | Top five skills required by the routed records. |
Queue drill-down view
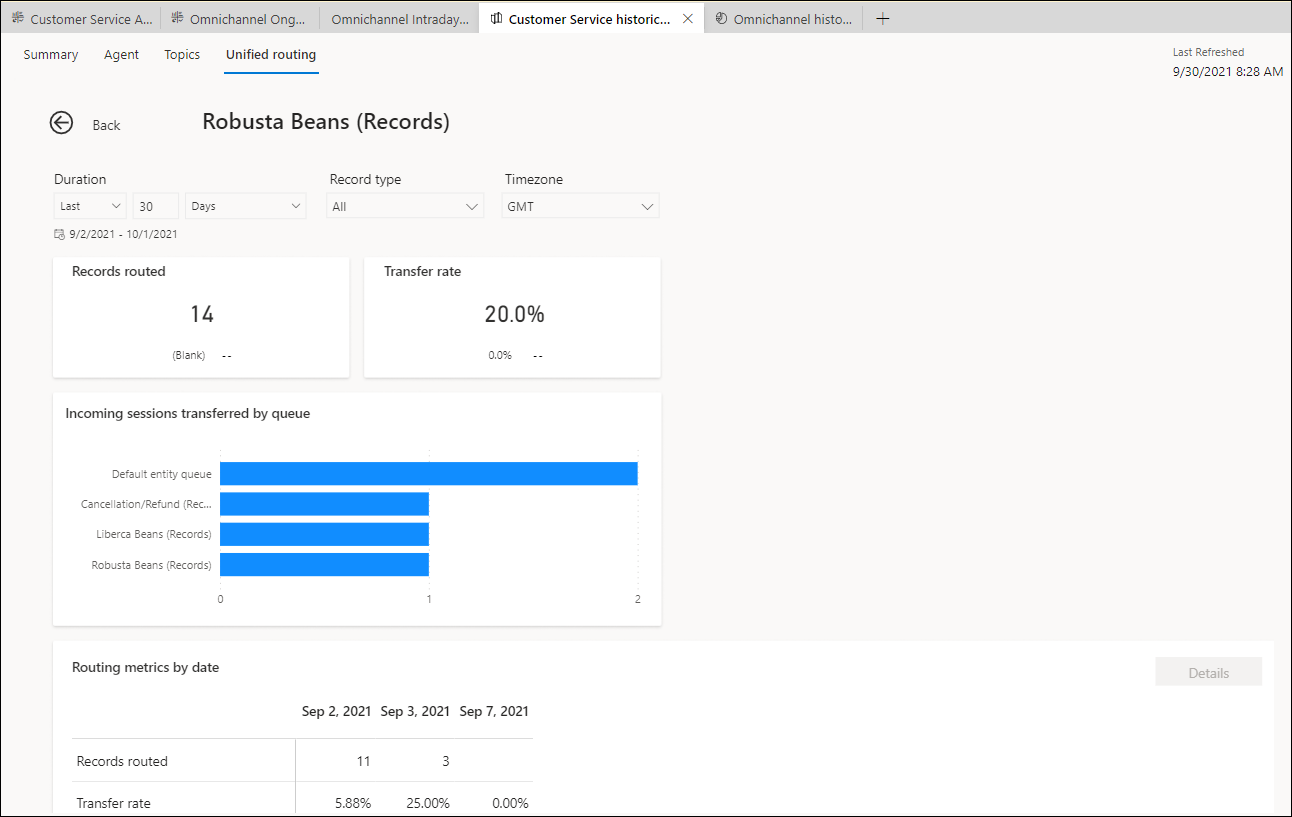
On the Unified routing report page, in Routing metrics by queue, select a queue, and then select Details to view the queue drill-down view. This view displays information about the records that were routed and the transfer rate for the items that were transferred to other queues.
The Incoming sessions transferred by queue metric displays the incoming sessions that were transferred from the selected queue to other queues.

Hourly drill-down view
On the Unified routing report page, the Routing metrics by date table displays the day wise data for the KPIs and the selected period in the Duration filter.

You can select a date, and then select Details to view the routing metrics by the hour.
Related information
Enable Historical analytics for unified routing
Unified routing report in Omnichannel historical analytics
Diagnostics for unified routing
Manage report bookmarks